Camilla Tincati1, Valeria Bono1, Silvia Nozza2, Alessandra Bandera3, Delfina Tosi4, Valentina Sala1, Giuseppe Ancona1, Andrea Calcagno5, Antonio Muscatello3, Stefano Rusconi6, Matteo Augello1, Roberta Rovito1, Umberto Gianelli4, Carlo Pescia4, Andrea Santoro1, Monica Falleni4, Andrea Gori7, Giulia Marchetti1 on behalf of the INACTION (Italian Network of Acute HIV Infection) Study Group
1Clinic of Infectious Diseases, Department of Health Sciences, ASST Santi Paolo e Carlo, University of Milan, Italy
2Infectious Diseases Unit, IRCCS San Raffaele Scientific Institute, Milan, Italy
3Foundation IRCCS Ca’ Granda Ospedale Maggiore Policlinico, Infectious Diseases Unit, Milan, Italy; Department of Pathophysiology and Transplantation, University of Milan, Milan, Italy
4Unit of Pathology, Department of Health Sciences, ASST Santi Paolo e Carlo, University of Milan, Italy
5Infectious Diseases Unit, Department of Biomedical and Clinical Sciences, ASST Ovest Milanese, Ospedale di Legnano, University of Milan, Italy
6Department of Medical Sciences, Unit of Infectious Diseases, Amedeo di Savoia Hospital, University of Turin, Turin, Italy
7Department of Infectious Diseases, Luigi Sacco Hospital, ASST Fatebenefratelli Sacco, Milan, Italy; Department of Biomedical and Clinical Sciences, University of Milan, Milan, Italy
Giulia Marchetti
giulia.marchetti@unimi.it
Tincati C, Bono V, Nozza S, Bandera A, Tosi D, Sala V, Ancona G, Calcagno A, Muscatello A, Rusconi S, Augello M, Rovito R, Gianelli U, Pescia C, Santoro A, Falleni M, Gori A, Marchetti G. Three-Month cART Initiated During Primary HIV Does Not Correct the Structural, Immune, and Microbial Abnormalities within the Gastrointestinal Tract. Pathogens and Immunity. 2025;10(2):263-285. doi: 10.20411/pai.v10i2.864
10.20411/pai.v10i2.864
Background: HIV infection leads to profound alterations of gut structure, immunity, and microbiome, resulting in immune activation and inflammation, which drive the development of non-infectious comorbidities. The introduction of combination antiretroviral therapy (cART) in the chronic stages of disease does not correct such abnormalities; however, the effect of viro-suppressive treatment in the gastrointestinal tract during primary HIV infection (PHI) is largely unknown. We studied the effects of 12-week cART on gastrointestinal (GI) structure, immunity, and mucosal microbiome in people living with HIV (PLWH) with PHI.
Methods: Eleven participants with PHI enrolled in the INACTION trial underwent colonoscopy with ileum and colon biopsies, as well as peripheral blood mononuclear cell (PBMC) and plasma collection, prior to and at 12 weeks of cART. Gut biopsies were stained with CD14, CD68, CD163, and E-cadherin antibodies and Masson trichrome. Flow cytometry was performed on lamina propria and PBMCs to characterize CD4, γδ T, Treg, and Th17 cells. Gut tissue-associated microbiome analysis was conducted on colon and ileum biopsies. Ten untreated individuals with chronic HIV infection (CHI) were also studied for comparative analysis.
Results: Despite treatment of PHI, gut barrier damage (E-cadherin loss, collagen deposition) progressed, with a partially preserved distribution of intestinal macrophages. Treated PHI showed stable CD4+ and γδ T-cell frequencies and decreased activation of these subsets in the colon, with no effect on intestinal Th17 and Treg cells. No major changes in peripheral inflammation and intestinal barrier integrity markers were observed. Gut tissue-associated microbiome composition evolved during cART treatment in PHI.
Conclusion: Despite early initiation, 12-week cART is unable to correct the HIV-mediated gut damage. Since gut injury drives systemic inflammation, which in turn fosters the pathogenesis of non-communicable comorbidities, our findings provide pathogenetic evidence of limited efficacy of early cART in reverting the HIV-associated pro-inflammatory signature and clinical risk.
Acute HIV; Gut Damage; Mucosal Immunity; Mucosal Microbiome
Combination Antiretroviral Therapy (cART) has radically changed the course of HIV disease: indeed, if initiated in the early stages of chronic infection when CD4+ T-cell counts are preserved (> 500/µL), people living with HIV (PLWH) have a comparable life-expectancy to that of their uninfected counterparts [1, 2].
Despite these advances, approximately half of newly diagnosed PLWH present in later stages of infection, ie, with CD4+ T-cell counts below 350/µL, with repercussions on immune reconstitution and clinical outcome [3].
From a pathogenic standpoint, the hampered CD4+ T-cell gain and the emergence of non-communicable diseases in the context of viro-suppressive cART are closely linked to the persistence of abnormalities within the gastrointestinal (GI) tract [4, 5]. Indeed, gut barrier damage, inflammation, and fibrosis, as well as mucosal immune dysfunction, are associated with increased GI permeability and microbial translocation [4, 5]. These represent known drivers of peripheral immune activation/inflammation [4, 5], which in turn are well-established causes of poor immunological gain [6] and non-infectious comorbidities on cART [7–9]. Modifications of the blood and gut microbiome further contribute to these outcomes in treated PLWH [10–14] by influencing systemic inflammation and cellular metabolic functions [15–17].
In line with literature reports of worse clinical outcomes in PLWH presenting in advanced stages of infection, prior studies demonstrated that the degree of gastrointestinal impairment, gut-dependent inflammation, and dysbiosis are linked to the CD4+ T-cell nadir [18–21]. More recently, however, we showed that PLWH with primary/acute HIV infection (PHI/AHI) display mucosal alterations resembling those of chronic disease, vis-à-vis lower levels of microbial translocation [22]. This raises the question as to whether the introduction of cART in PHI is able to arrest the progression of, if not to revert, the structural and functional abnormalities within the GI tract. In this respect, the resolution of gut inflammation in the lamina propria was found in one study [23], and the partial amelioration of mucosal activation as well as Th17 frequencies and function was reported in another [24]. Following these findings, enduring enterocyte turnover, monocyte activation, and fibrosis biomarkers in the peripheral blood were reported following treatment of PHI [25] and were hypothesized to be linked to the early establishment of gut dysbiosis [26]. To reconcile these diverging findings, we conducted a comprehensive study on the effects of 12-week cART on GI structure, immunity, and mucosal microbiome in PLWH with PHI.
The study population included participants enrolled in the immunological substudy of the INACTION trial, in which newly-diagnosed PHI were randomized to 3 different cART regimens [27]. The study was approved by the Milan Area 1 Ethical Committee (approval # 13547/2018, approval date 12/03/2018; EudraCT # 2017-000554-19). Diagnosis of PHI was established on the basis of a positive p24 antigenemia or detectable HIV-RNA with a negative/indeterminate Western Blot confirmation assay; staging of HIV infection was made according to Fiebig classification [28].
Upon providing written informed consent, individuals were enrolled, their demographic and clinical characteristics recorded, and peripheral blood samples collected for plasma and PBMCs separation prior to (T0) and following 12 weeks (T12) of cART. At the same time-points, individuals underwent colonoscopy at the Endoscopy Unit of San Paolo Hospital in Milan, Italy, for tissue sampling and subsequent immunohistochemical/flow cytometric experiments (see below).
Chronically HIV-infected (CHI) and cART-naïve, late-presenter individuals were enrolled as controls at the Clinic of Infectious Diseases at the same institution. In this group, laboratory analyses were only performed before cART introduction (T0), as repeated colonoscopies and plasma/PBMCs samples at T12 were not available.
Participants belonging to the PHI group underwent repeated colonoscopies at T0 and T12 as part of the INACTION immunological substudy, while CHI individuals received a basal colonoscopy as a routine screening procedure offered at diagnosis of HIV infection.
Before the procedure, patients were asked to receive bowel preparation with Moviprep – Norgine. Colonoscopy was performed at the Endoscopy Unit of San Paolo Hospital. Standard sedation with a combination of midazolam (2mg) and pethidine (50mg) during the examination.
Two pinch biopsies were collected in the colon and 2 in the ileum: from each site, 1 was processed for flow cytometric analysis, and 1 was fresh-frozen. Additionally, biopsies from all colonic tracts and distal ileum were obtained (1 biopsy per site) and processed for routine histopathological examination, after standard fixation for 24 hours.
Colonic biopsies were routinely formalin-fixed and paraffin-embedded, and serial 3 µm-thick sections were performed from each block; morphological signs of inflammation, integrity of intestinal barrier, and collagen deposition were evaluated in areas with oriented tubular glands in at least 5 interglandular spaces. Immunohistochemistry was performed using the Autostainer Dako Omnis. The following antibodies were used: anti-CD14, clone EPR 3653 (dilution 1:25), Gennova Scientific; anti-CD68, clone PG-M1 (ready to use), Dako Agilent; anti-CD163, clone 10D6 (dilution 1:100), Gennova Scientific; anti-E-Cadherin, clone NCH-38, (ready to use), Dako Agilent.
CD14, CD68 (PGM-1), and CD163 antibodies were used to assess the monocyte-macrophage lineage. We analyzed and quantified these populations because their role in gut inflammation in HIV, and their relationship with stromal fibrosis, has been only partially characterized—particularly with respect to the M2 (CD163+) subpopulation [29]. We used ImageJ visualization tool to accurately assess the percentage of monocytic-macrophagic cells out of 100 counted interstitial cells across 5 intervillar spaces divided into 3 virtual compartments along the glandular axis (upper, mid, and lower third).
Integrity of the intestinal barrier was evaluated with E-cadherin antibody (CDh)1, based on a previously published semi-quantitative score [22] using a semi-quantitative score as follows: 1 = no reduction of membranous staining; 2 = reduction in the luminal surface with retained basolateral expression; 3 = lateral positivity only; 4 = basal positivity only.
Lastly, collagen stromal deposition was evaluated with Masson trichrome staining (Bio-Optica Spa) and quantified in 3 non-overlapping 40× areas on lamina propria by ImageJ. The lamina propria was outlined to define the region of interest (ROI), threshold set to omit background, and fibrosis was calculated as the percentage of unmasked pixels above threshold, relative to total pixels within the ROI. Data are presented as % of fibrotic area [22].
For immunohistochemical staining experiments, biopsies from people living without HIV undergoing routine colonic screening (n = 5) were used as historical controls.
Biopsies were digested at 37°C for 1 hour in 0.25mg/mL of collagenase D (Roche) and 300 μg/mL DNase (Sigma) in complete RPMI. Cells were filtered through a 50-micron filter, washed with 5 mL 1X PBS, and pelleted. Cells were then resuspended in HBSS (Euroclone) and centrifuged at 1500 rpm for 5 minutes at room temperature. Mononuclear cells were collected at the interface and used for subsequent flow cytometry analyses (see below).
PBMCs were isolated from EDTA tubes collected venous blood using Ficoll-Histopaque (Biocoll, BIOSPA), cryo-preserved in fetal bovine serum (EuroClone) with 10% Dimethyl Sulfoxide (EuroClone), then stored in liquid nitrogen. For the surface phenotyping, PBMCs were thawed, and 1.5 x 10⁶ cells were plated for 3 hours in complete RPMI containing 10% human serum supplemented with 1% Penicillin–Streptomycin–Glutamine. Rested PBMCs were then stained for 30 min at 4°C in the dark. The following antibodies were used for surface immunophenotyping: CD3 (V500), CD4 (APC), TCR-γδ (FITC), CD38 (PE), Vδ1 (APC), Vδ2 (PE-Cy7), CD161 (PerCP-Cy5.5), CCR6 (PE-Cy7), CD127 (FITC), CD25 (V450) (Miltenyi, Biotech); dead cells were labeled using LIVE/DEAD™ Fixable cell stain APC-H7 (Molecular Probes, Life technologies). Combinations used were: CD4+ CCR6+ CD161+ (Th17), CD3+ pan-TCRγδ+ (γδ T cells), CD4+ CD25+ CD127- (Treg cells), CD3+ TCRγδ+ CD38+ (γδ T-cells activation), CD4+ CD38+ (CD4 T-cells activation).
A 2% paraformaldehyde (Sigma-Aldrich) in 1X PBS and 4% bovine serum albumin (Sigma-Aldrich) in 1X PBS were used for cell fixation and blocking, respectively. Data acquisition was performed using FACSVerse™cytometer (BD Biosciences) and thereafter analyzed using FlowJo software 10.7.2 (BD Biosciences). For lamina propria mononuclear cells immunophenotyping, freshly isolated cells, as previously described, were submitted directly to cell staining, fixation, and data acquisition using the same panel of PBMCs FACS analysis. An example of the gating strategy used is presented in Supplementary Figure 1.
Plasma cytokine Interleukin-6 (IL-6) was quantified using Human Quantikine HS ELISA kit (R&D Systems, Inc.), E-cadherin, and soluble (s) CD14 were quantified with Human Quantikine ELISA kits (R&D Systems, Inc.) according to the manufacturer’s instructions. Freshly thawed plasma samples were diluted 1:20, 1:200 with the calibrator diluent for E-cadherin and sCD14 ELISA kits, respectively. EndoCab IgG Human, Human lipolysaccharide binding protein (LBP), Human 1,3-beta-D-glucan, and I-FABP markers were measured by ELISA (EndoCab IgG cod HYC-HK504-IGG, Hycult Biotech; LBP cod E0360HU-96; 1,3-beta-D-glucan cod E4111hu-96, BT LAB; Human I-FABP Immunoassay cod DFBP20, R&D Systems), following the manufacturer’s instructions. The optical density (OD) of each well was measured using the microplate reader set to 450 nm (EnSight™ multimode plate reader, PerkinElmer Inc.).
Colon and ileum biopsies were stored at -80°C. DNA was extracted from the samples using tissue-specific optimized techniques at Vaiomer SAS. The integrity and concentration of DNA were evaluated using UV spectroscopy (Nanodrop®, Thermo Scientific).
PCR amplification was performed using 16S universal primers targeting the V3-V4 region of the bacterial 16S ribosomal gene (Vaiomer universal 16S primers). The joined pair length was set to encompass a 467 base pair amplicon using the 2 x 300 paired-end MiSeq kit V3. For each sample, a sequencing library was generated by addition of sequencing adapters.
The detection of the sequencing fragments was performed using the MiSeq Illumina® technology. The sequencing output target was 75,000 raw reads (2 x 37,500 paired-end reads) per sample, which has been experimentally determined to be the number of reads to have exhaustive coverage of the community profiles present in high diversity samples. A variation in the total number of reads (up to 2-fold change) can occur between samples and is considered acceptable for analysis.
The targeted metagenomic sequences from microbiota were analyzed using the bioinformatics pipeline established by Vaiomer [30, 31]. Briefly, after demultiplexing of the bar-coded Illumina reads, single read sequences were cleaned and paired, for each sample independently, into longer fragments. After quality-filtering (abundance, fragment length and sample quality), the data were clustered into operational taxonomic units (OTU) using the Swarm algorithm, a method which allows the clustering threshold to adapt to the input data. Then, a taxonomic assignment was performed in order to determine community profiles.
Descriptive and statistical analyses were performed with the use of GraphPad Prism 9.0 (GraphPad Inc.). Discrete variables are presented as absolute/percentage values and analyzed by Fisher’s exact test. Continuous variables are presented as median values and interquartile range and analyzed with the Wilcoxon and Mann-Whitney tests. A P value < 0.05 was considered statistically significant.
A total of 21 participants were enrolled in the study (PHI, n = 11; CHI, n = 10). The 2 groups had comparable demographic characteristics (Table 1); however, at T0, PHI presented significantly higher CD4+ (538/µL[IQR, 49–609] vs 147/µL[IQR, 12–279]; P=0.001) and CD8+ T-cell counts (1352/µL [IQR, 826–1752] vs 688/µL [IQR, 248–925]; P=0.02) as well as a trend to higher HIV RNA (5.58 log10 cp/mL [IQR,5.16–5.92] vs 5.13 log10 cp/mL [IQR, 4.8-5.4]; P=0.05) than CHI (Table 1).
Among PHI individuals, 4/11 were diagnosed in Fiebig stages II-III and 7/11 in stages IV-V, with an estimated time of infection of 30 days and 40 days, respectively [28]. cART was introduced at a median time of 12 days (IQR 9–26) from HIV diagnosis in PHI. Upon cART introduction in PHI, we found a significant increase in total (756/µL [IQR, 590–940]; P=0.004) and percentage (37.7% [IQR, 33–43.7]; P=0.001) CD4+ T cells as well as a rise of CD4+/CD8+ T-cell ratio (1.23 [IQR, 0.76–1.44]; P=0.001); parallelly, we observed a decrease in total (816/µL [IQR, 554-900]; P=0.001) and percentage (35% [IQR, 28.4–40.7]; P=0.001) CD8+ T cells and HIV RNA levels (1.6 log10 cp/mL [IQR, 1.55–1.91]; P=0.001).
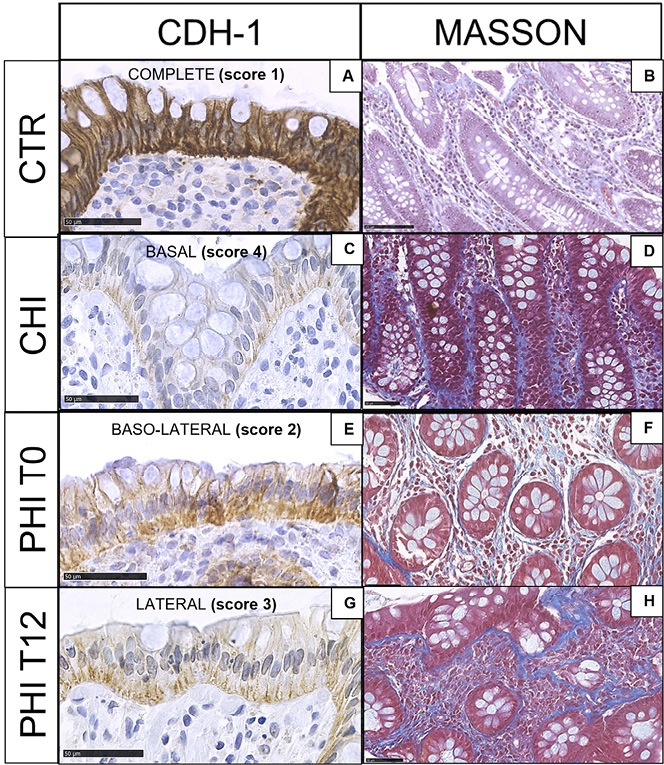
As compared to HIV-uninfected controls (Figure 1A-B), CHI displayed marked reduction of E-cadherin expression with residual immunoreactivity at the bottom of the glands (Figure 1C) as well as a massive deposition of collagen fibers (Figure 1D). In contrast, in PHI at T0, a decrease in E-cadherin immunostaining was detected from the luminal surface to the lowest part of the gland (Figure 1E), and mildly/intense collagen fibers were observed (Figure 1F). At T12, E-cadherin expression was progressively lost, with the highest depletion in the upper third of the gland (Figure 1G) and detection of dense fibrosis (Figure 1H). Detailed results for E-cadherin expression and Masson staining are presented in Supplementary Table 1A-B. We did not observe significant variations in neutrophil infiltration across different samples.
Table 1. Demographic and Clinical Features of the Study Population
|
PHI |
CHI |
P value |
|
|---|---|---|---|
|
Age at enrollment [years], median (IQR) |
41 (29-45) |
42 (34-51) |
0.34 |
|
Male sex, n (%) |
11 (100) |
8 (80) |
0.21 |
|
Ethnicity, n (%) Caucasian Other |
10 (91) 1 (9) |
7 (70) 3 (30) |
0.31 |
|
Epidemiology, n (%) MSM Heterosexual/other |
10 (91) 1 (9) |
8 (80) 2 (20) |
0.59
|
|
HBV/HCV coinfection, n (%) |
3 (27) |
3 (30) |
1 |
|
CD4+ T cells at enrollment cells/µL, median (IQR) %, median (IQR) |
538 (493-609) 25 (14-28) |
147 (12-279) 17 (10-18) |
0.001 0.13 |
|
CD8+ T cells at enrollment cells/µL, median (IQR) %, median (IQR) |
1332 (826-1752) 56 (49-72) |
688 (248-925) 58 (49-66) |
0.02 0.53 |
|
CD4/CD8 ratio at enrollment, median (IQR) |
0.50 (0.19-0.57) |
0.26 (0.15-0.32) |
0.17 |
|
HIV-RNA at colonoscopy [median log10 cp/mL, IQR] |
5.58 (5.16-5.92) |
5.13 (4.80-5.42) |
0.05 |
|
Fiebig stage, n (%) I II-III IV-V |
0 (0) 4 (36) 7 (63) |
NA
|
NA |
|
cART treatment (INACTION trial), n (%) TAF/FTC/DRVc TAF/FTC+ DTG TAF/FTC/DRVc +DTG |
3 (27) 6 (54) 2 (18) |
NA |
NA |
|
CDC stage, n (%) C1-C3 (AIDS-defining conditions) Other |
1 (9) 10 (91) |
4 (40) 6 (60) |
0.15 |
MSM: Men having Sex with Men; HBV/HCV: Hepatitis B Virus/Hepatitis C Virus; NA: Not applicable
Figure 1. E-cadherin and Masson trichrome staining in colonic biopsies. A,B) HIV-uninfected controls (CTR) show epithelial colonic cells, which are highly immunoreactive to E-cadherin (complete expression, score 1) and faint blue collagen fibers in the stroma; C,D) Individuals with chronic HIV infection (CHI) feature the loss of E-cadherin immunostaining (basal expression, score 4) and heavy fibrosis; E,F) Individuals with untreated (T0), primary HIV infection (PHI) show loss of E-cadherin immunoreactive cells (baso-lateral expression, score 2) and collagen deposition; G,H) Individuals with PHI following 12 weeks of cART (T12) display progressive E-cadherin loss (lateral expression, score 3) and collagen deposition.
In HIV-uninfected controls, CD14 immunoreactive cells showed a homogeneous distribution along the interglandular space (Figure 2A), while subepithelial luminal reinforcement (“T-like” disposition) was detected for CD68+ (Figure 2B) and CD163+ (Figure 2C) cells.
CHI showed comparable distribution and number of CD14 immunoreactive cells to uninfected controls with a milder subepithelial luminal concentration (Figure 2D). However, a mild increase of CD68+ (Figure 2E) and CD163+ macrophages (Figure 2F) was noted in the upper third of the stromal space between 2 glands.
In PHI at T0, CD14+ cells increased at the mid-third of the glandular axis (Figure 2G); CD68+ and CD163+ immunoreactive cells also increased, yet maintained a similar distribution to that of uninfected controls (Figure 2H, I). At T12, CD14+ cells showed a homogeneous distribution in the interglandular space (Figure 2J), while CD68+ and CD163+ cells were unaffected (Figure 2K, L).
Detailed results for macrophage populations across samples are provided in Supplementary Table 1C, along with a visual representation of the range of monocytic/macrophagic populations (Supplementary Figure 2).
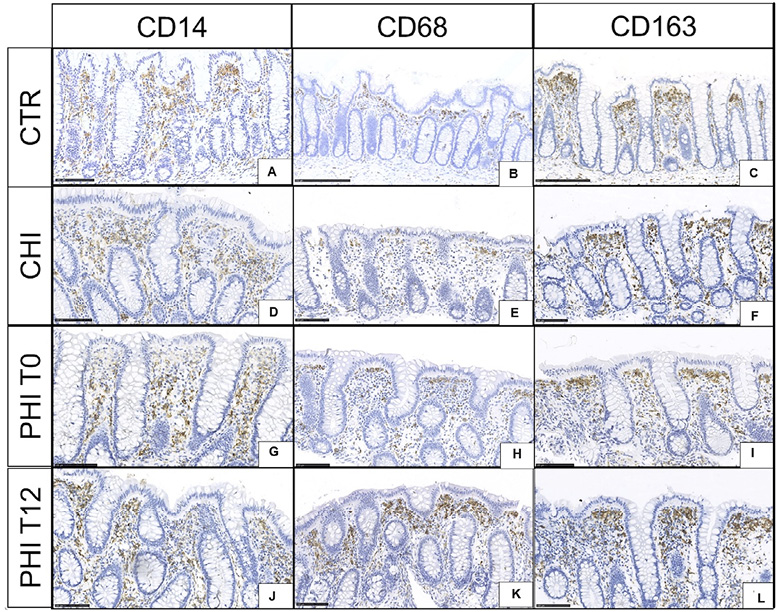
Figure 2. CD14, CD68, and CD163 immunoreactive cells in colonic biopsies. A,B,C) HIV-uninfected controls (CTR) display homogeneous distribution of CD14+ immunoreactive cells with a subepithelial reinforcement of CD68+ and CD163+ cells. D,E,F) Individuals with chronic HIV infection (CHI) feature a similar number and distribution of CD14+ cells to that observed in uninfected controls, yet a mild increase of CD68+ and CD163+ cells in the subluminal stromal space. G,H,I) Individuals with untreated (T0), primary HIV infection (PHI) show recruitment of CD14+ from the mid-third of the interglandular space as well as scant increases of CD68+ and CD163+ cells. J,K,L) Individuals with PHI following 12 weeks of cART (T12) feature homogeneous distribution of stromal CD14 immunoreactive and stable CD68+ and CD163+ cells.
In the colon, at T0, PHI showed significantly higher total (42.7% [IQR, 24–48.6] vs 22.3% [IQR, 20.7–25.4]; P=0.04; Figure 3A) and activated, CD38-expressing CD4+ T cells than CHI (46.7% [IQR, 26.7–62.4] vs 21.7% [IQR, 13.5–31.7]; P=0.04; Figure 3B). At T12, despite no changes in total CD4+ (24.3% [IQR, 18.9–45.8]; P=0.07; Figure 3A), activated CD4+ T cells decreased significantly (25% [IQR, 16.8–20.4]; P=0.03), reaching levels comparable to those seen in CHI (Figure 3B).
In the ileum, at T0, CD4+ T-cell counts were similar in PHI and CHI (Figure 3C), yet activated CD4+ T cells were higher in PHI (51.5% [IQR, 41–69.5] vs 22.9% [IQR, 8.9–33.3]; P=0.03; Figure 3D). At T12, total and CD38-expressing CD4+ T-cell frequencies remained stable despite cART (Figure 3D).
In the colon, at T0, PHI displayed total and activated γδ T-cell counts comparable to CHI (Figure 3E); at T12, the former remained stable while the latter showed a trend to significant decrease (T0: 62.2% [IQR, 55.5–79.1]; T12: 33.9% [IQR, 20.8–57.4]; P=0.05); Figure 3F).
In the ileum, at T0, total γδ T-cell counts were similar in the two groups (Figure 3H) while activated cells were significantly higher in PHI (62% [IQR, 50–83.1] vs 21.4% [IQR, 18.5–48]; P=0.01; Figure 3H) and underwent a non-statistically significant decrease following treatment (47.5% [IQR, 40.1–69]; P=0.09; Figure 3H).
In the peripheral blood, no statistically significant difference was observed in the frequency of γδ T cells (Figure 3I) at both time points. A significant decrease of activated CD38-expressing, yet not CD69-expressing, γδ T cells was shown in PHI at T12, reaching levels significantly lower compared to CHI subjects at T0 (14% [IQR, 7.2–15.8] vs 31.1% [IQR, 19.5–79.4]; P=0.01) (Figure 3J, K).
No significant differences were found in the frequency of Vδ1 and Vδ2 cells in PHI and CHI individuals in the gut or peripheral blood (not shown).
In the colon and ileum, PHI and CHI displayed comparable Th17 and Treg cells at both time-points (Figure 4A-B; D-E); higher colonic Treg cells in CHI vs PHI at T0 (2.3% [IQR, 1.8–60.6] vs 1.06% [IQR, 0.6–1.9]; P=0.02) were mainly driven by outliers (Figure 4B). Accordingly, the Th17/Treg ratio was comparable in CHI and PHI at mucosal sites, regardless cART introduction (Figure 4C-F).
In the peripheral blood, at T0, we also found similar Th17 and Treg cells in the two groups; at T12, a significant increase of Treg was registered in PHI (15.7% [IQR, 7.2–35.2] vs 37.8% [25.5-60.6]; P=0.003; Figure 4H), resulting in higher levels than CHI (16.6% [IQR, 5–35.4]; P=0.03; Figure 4H) as well as a contraction of the Th17/Treg ratio 0.1% [IQR, 0.07–0.3] vs 0.06% [IQR, 0.06–0.1]; P=0.003) (Figure 4I).
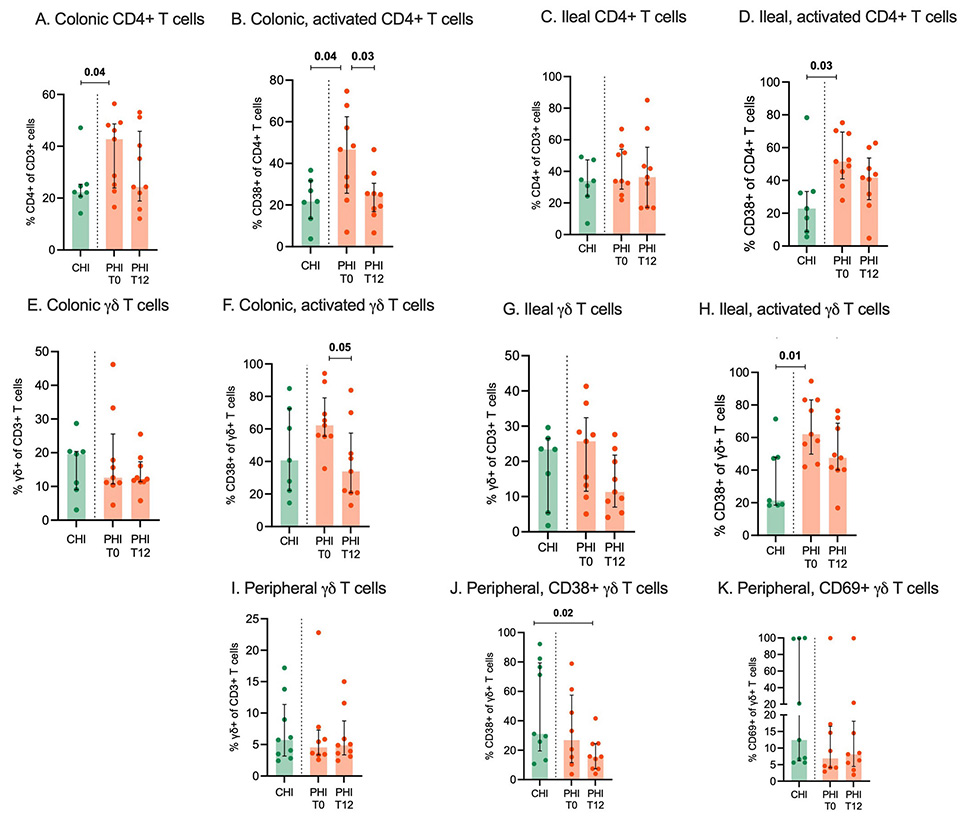
Figure 3. CD4+ and Υδ T cells in colon, ileum and peripheral blood. Total and activated CD4+ and Υδ T-cells were measured by flow cytometry in colonic (A-D) and ileal tissue biopsies (E-H) as well as peripheral blood (I-K) from individuals with chronic HIV infection (CHI, green) and primary HIV infection (PHI, orange) prior to (T0) and following 12-week cART (T12).
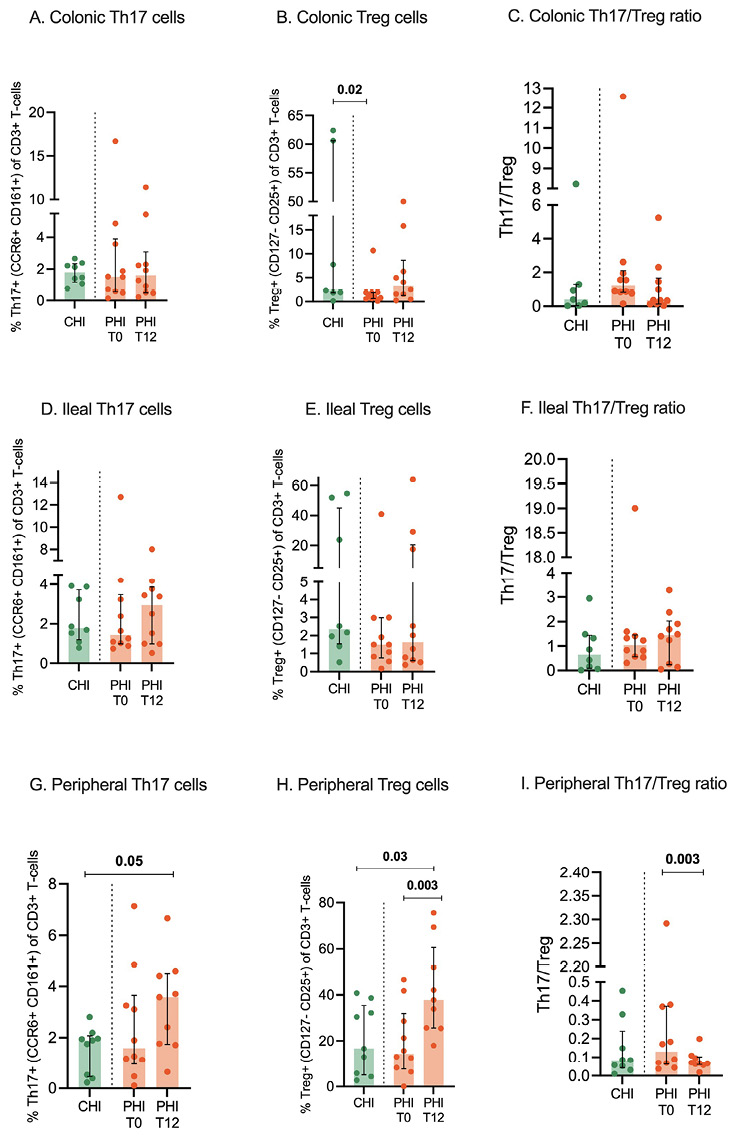
Figure 4. Th17, Treg cells, and Th17/Treg ratio in colon, ileum, and peripheral blood. Th17 and Treg cells were measured by flow cytometry in colonic (A-C) and ileal tissue biopsies (D-F) as well as peripheral blood (G-I) from individuals with chronic HIV infection (CHI, green) and primary HIV infection (PHI, orange) prior to (T0) and following 12-week cART (T12). Percentages of Th17 and Treg cells are expressed within the CD3+ T-cells.
No changes in peripheral inflammation and intestinal barrier integrity markers were observed during early cART in PHI
We observed similar levels of plasma E-cadherin, IL-6, and sCD14 in CHI and PHI at T0 (Figure 5A-C). In addition, cART exerted no major effect on such markers, except for a trend to lower IL-6 levels (2.3% [IQR, 1.3–3.3] vs 1.5% [IQR, 0.9–1.9]; P=0.07) (Figure 5B). Similarly, no statistical differences were noted following cART introduction in PHI in terms of additional markers of gut barrier damage and microbial translocation (ie, I-FABP, EndoCab, LBP, and 1,3-beta-D-glucan (Supplementary Figure 3).
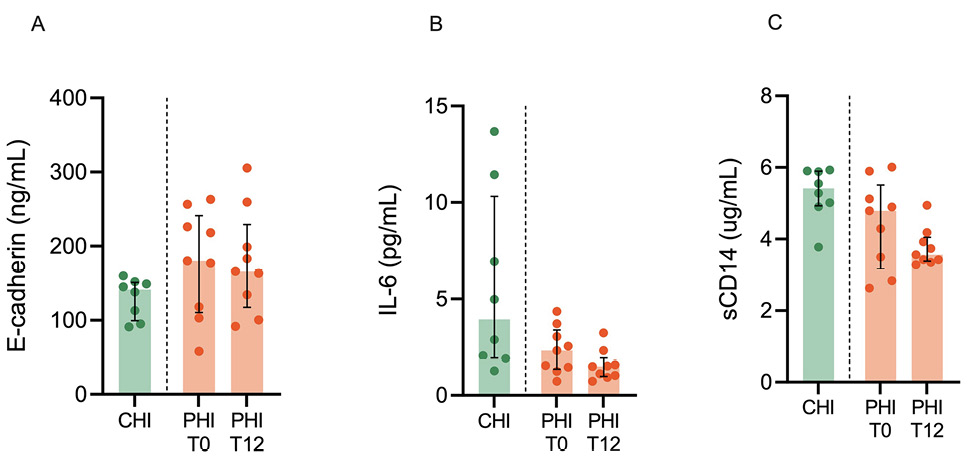
Figure 5. Peripheral inflammation and intestinal barrier integrity markers. Markers of intestinal barrier integrity (E-cadherin; A) inflammation (IL-6, interleukin-6; B), and immune activation (sCD14, soluble CD14; C) were measured in plasma from individuals with chronic HIV infection (CHI, green) and primary HIV infection (PHI, orange) prior to (T0) and following 12-week cART (T12).
To characterize the local microbiome in association with the mucosal tissue microenvironment, ileum and gut biopsies were analyzed.
For all taxonomic levels, α-diversity measures did not vary significantly among study groups at both mucosal sites (ileum and colon) (Figure 6A). The only exception was a significant decrease of α-diversity bacterial Order in the ileum (Simpson and InvSimpson, P=0.04) following treatment in PHI (Figure 6A).
In addition, β-diversity measures showed significantly different colonic bacterial community composition between PHI at T0 and CHI (generalized Unifrac: P=0.02; Unifrac: P=0.03; Jaccard: P=0.03) (Figure 6B); these differences were lost following cART treatment with PHI displaying, at T12, similar β-diversity indices to those observed in CHI (Figure 6B).
Relative abundance showed that bacterial composition tended to vary by study group (ie, CHI vs PHI), rather than sample site (Figure 7A). In the ileum, cART treatment in PHI led to significant increases of Ruminococcaceae-UBA1819 (P=0.01), Bluatia multi-affiliation cluster 154 (P=0.04), Eubacterium (P=0.03), Oscillobacter cluster 452 (P=0.03), Ruminococcus gnavus group (P=0.04), Lachnospiraceae multi-affiliation cluster 34 (P=0.03) and 699 (P=0.04), Megasphaera (P=0.03), and Ruthenibacterium lactatiformans (P=0.01) and decreases in Fuscsobacteriia (P=0.02), Fusobacterium (P=0.04), Fusobacteriales (P=0.02), Fusobacteriaceae (P=0.02), and Bacteroides dorei (P=0.03) (Figure 7B); in the colon, cART resulted in significant increases of Lachnospiraceae multi-affiliation cluster 34 (P=0.04) and Aeromondales (P=0.04) and decreases of Gammaproteobacteria (P=0.03), Helicobacter apodemus (P=0.02), Leuconostocaceae (P=0.03), Fusobacteriia (P=0.02), Fusobacterium (P=0.02), and Fusobacteriaceae (P=0.02) (Figure 7B).
Compared to PHI at T12, CHI maintained higher proportions of Oscillosporaceae cluster 319 (P=0.04), Subdoligranulum (P=0.04), and Ruminococcus in the ileum (P=0.04); Ruminococcus torques group (P=0.006), Oscillospiraceae (P=0.04), and Helicobacter apodemus (P=0.04) in the colon (Supplementary Figure 4).

Figure 6. Alpha and Beta diversity of microbial communities across samples. A) Alpha-diversity indices at the bacterial Order level in ileum (left panel for each measure) and colon (right panel for each measure) in study participants. B) Beta-diversity indices (Principal Coordinates Analysis, PCoA) in colon biopsies, comparing (top) CHI and PHI at T0; (bottom) CHI and PHI at T12 by Permanova (pseudo-F values).

Figure 7. Mucosal microbiome changes in PHI following cART in PHI. A) Relative abundance at the bacterial Order level in ileum (left) and colon (right) in study participants. B) Linear discriminant analysis Effect Size (LEfSe) analysis shows the taxonomic differences between PHI at T0 and T12. Representative plots of microbiome changes at the 2 time-points are also shown.
The profound alterations that occur within the gastrointestinal tract are major drivers of T-cell activation and microbial translocation in HIV infection [32]. While cART introduction in chronic HIV infection is known to have a scant effect on the gut mucosa [18–20], its impact when initiated in acute HIV infection is still unclear.
Mucosal barrier damage and fibrosis are among the root causes of HIV pathogenesis [33]. In line with prior data [22, 23], we show the early onset of junctional complex impairment and collagen deposition in the gut. These changes progressed at 12 weeks of follow-up, resembling those observed in advanced, untreated individuals, thus pointing to the limited effect of short-term antiretroviral treatment in preventing tissue injury in acutely-infected PLWH. Given the non-significant and subtle changes observed in monocytic and macrophagic populations, we cannot conclude a direct implication in gut barrier disruption or stromal remodeling, although we speculate that the mild increase in CD163+ cells in T12 samples could be linked to increased stromal fibrosis [29]. Our findings of stable plasma E-cadherin levels in PHI before and after treatment also suggest ongoing protein release from epithelial junctions in the gut. Furthermore, the accumulation of macrophages expressing CD14, the LPS co-receptor, within the intestinal crypts following acute infection indicates the potential for microbial translocation from the gut to the systemic circulation very early in the course of disease. Indeed, sCD14, a surrogate marker of microbial translocation, was detected in the peripheral blood of people with untreated PHI at levels comparable to those with CHI. Following cART treatment in acute infection, CD14+ macrophages increased in the subepithelial layer, yet sCD14 moderately decreased in the blood; together with the finding of a trending decrease in IL-6, these results show that early therapy in PHI does not extinguish gut-dependent systemic inflammation in the short term.
Mucosal T-cell populations play a major role in maintaining gut barrier function and are deeply affected by HIV infection [34]. CD4+ T cells represent the major target of HIV replication and are depleted in the gut and blood in all stages of disease [35]. In our study, PHI showed higher CD4+ T-cell frequencies than CHI in the colon, yet not in the ileum, suggesting a differential effect or kinetics of HIV-induced T-cell loss at the 2 sites. However, by showing stable CD4+ T-cell frequencies in the gut over time despite timely cART start in PHI, we confirm that cART had little/no effect on mucosal immune reconstitution [24, 36, 37].
In accordance with the role played by viral replication in the direct stimulation of T-cell activation [38], PHI displayed high frequencies of activated, intestinal CD4+CD38+ cells prior to treatment. Again, cART had a limited impact on mucosal immune activation, as it accounted for a significant decrease of activated CD4+ T-cells only in the colon and not the ileum. Furthermore, the frequencies of activated CD4+CD38+ cells in treated, acute infection at both GI sites were similar to those measured in advanced chronic infection, confirming the inability of treatment to fully turn off mucosal immune activation [24], which may fuel gut damage [39].
Tissue resident γδ T cells are key players in epithelial maintenance and repair [40]. In this respect, recent work in the animal model demonstrated a pathogenic link between intestinal Vδ2 T-cell dysfunction, gut barrier disruption, and a plasma inflammatory signature during early cART-treated, chronic SIV infection [41]. In the present work, we found that the frequencies of total and activated γδ T cells in the blood and gut of acutely-treated PHI were comparable to those of chronically, untreated CHI; these results suggest that cART introduction in acute or early chronic infection [41], has a minimal effect on γδ T cells, which may contribute to the establishment of a leaky gut and systemic inflammation.
Th17 and Treg cells have a significant role at mucosal surfaces by containing infection with pathogenic microorganisms [42] and exerting suppressive control over other cells [43], respectively. While cART introduction in acute SIV infection has a differential effect on Th17 and Treg imbalances in lymphoid tissues and the peripheral blood [44], in early Fiebig stages of HIV infection, it can restore mucosal Th17 frequencies and polyfunctionality [24]. Following prior data showing that intestinal Th17 numbers and function decrease by Fiebig stage [24], we show similar Th17 and Treg frequencies in the gut and blood in untreated PHI (the majority of whom were diagnosed in Fiebig stages IV-V) and CHI individuals. We also confirm that treatment of acute infection accounted for a rise in peripheral, yet not mucosal, Th17 and Treg cells, further highlighting the limited effect of cART on gastrointestinal immunity.
Lastly, cART introduction in PHI was linked to modifications of the gut microbiome, featuring comparable α- and b-diversity measures at T12 to those observed in CHI as well as changes in taxonomic composition in gut tissue. Longer follow-up is needed to understand whether these changes are linked to the progression of HIV-induced dysbiosis, possibly pointing to a limited effect of cART in restoring the microbiome tissue imbalance. Given that HIV-related dysbiosis contributes to the decreased production of short-chain fatty acids and peripheral inflammation [45], which may lead to the development of comorbidities [10] and increased mortality [45], our research may indicate the early onset of disease progression risk.
The present study has several limitations, including the relatively small sample size, short follow-up period, enrollment of PLWH with advanced Fiebig stages, flow cytometry data restricted to gut and peripheral CD4+ T-cells (due to limited sample size and PBCMs numbers), the lack of controls for peripheral/mucosal immunity and microbiome analyses, as well as treated, chronically infected PLWH. Further, the potential for biopsy sampling differences may also cause some uncertainty in the histology results.
Finally, later comparisons of GI structure and immune activation are needed to evaluate whether cART can slow disease progression in PHI and whether it differentially impacts the microbiome and mucosal immunity depending on the antiretroviral regimen. Despite these drawbacks, our findings confirm that acute HIV infection impairs gut mucosal structure, immunity, and microbiome and that early cART does not correct such alterations in the short term. Given the established role of gut integrity loss in driving systemic inflammation [46] as well as the failure of cART to prevent GI disruption and immune activation — both of which contribute to the ongoing increase in immune activation observed in treated CHI [18]—our results shed light on the mechanisms underlying the persistence of inflammatory markers in PLWH even when treated during acute infection [25, 47] and appeal for novel therapeutic strategies to preserve the gastrointestinal tract in the earliest stages of HIV.
Presented in part: HIV Drug Therapy, Glasgow 2022 (poster #114).
This study was funded by the Italian Ministry of Health, NET-2013-02355333.
The authors report no additional conflicts of interest.
Supplementary materials are available at the Pathogens and Immunity website. Supplementary data may be provided by the authors to benefit the reader. Supplementary data are not copyedited and are the sole responsibility of the authors. Questions or comments related to supplementary materials should be addressed to the corresponding author.
Supplementary Figures and Table
1. Group ISS, Lundgren JD, Babiker AG, Gordin F, Emery S, Grund B, Sharma S, Avihingsanon A, Cooper DA, Fatkenheuer G, Llibre JM, Molina JM, Munderi P, Schechter M, Wood R, Klingman KL, Collins S, Lane HC, Phillips AN, Neaton JD. Initiation of Antiretroviral Therapy in Early Asymptomatic HIV Infection. N Engl J Med. 2015;373(9):795-807. doi: 10.1056/NEJMoa1506816. PubMed PMID: 26192873; PMCID: PMC4569751.
2. Marcus JL, Leyden WA, Alexeeff SE, Anderson AN, Hechter RC, Hu H, Lam JO, Towner WJ, Yuan Q, Horberg MA, Silverberg MJ. Comparison of Overall and Comorbidity-Free Life Expectancy Between Insured Adults With and Without HIV Infection, 2000-2016. JAMA Netw Open. 2020;3(6):e207954. doi: 10.1001/jamanetworkopen.2020.7954. PubMed PMID: 32539152; PMCID: PMC7296391.
3. European Centre for Disease Prevention and Control/WHO Regional Office for Europe. HIV/AIDS surveillance in Europe 2023 – 2022 data. Stockholm: ECDC; 2023.
4. Mudd JC, Brenchley JM. Gut Mucosal Barrier Dysfunction, Microbial Dysbiosis, and Their Role in HIV-1 Disease Progression. J Infect Dis. 2016;214 Suppl 2(Suppl 2):S58-66. doi: 10.1093/infdis/jiw258. PubMed PMID: 27625432; PMCID: PMC5021240.
5. Tincati C, Douek DC, Marchetti G. Gut barrier structure, mucosal immunity and intestinal microbiota in the pathogenesis and treatment of HIV infection. AIDS Res Ther. 2016;13:19. doi: 10.1186/s12981-016-0103-1. PubMed PMID: 27073405; PMCID: PMC4828806.
6. Bono V, Augello M, Tincati C, Marchetti G. Failure of CD4+ T-cell Recovery upon Virally-Effective cART: an Enduring Gap in the Understanding of HIV+ Immunological non-Responders. New Microbiol. 2022;45(3):155-72. PubMed PMID: 35920870.
7. Hunt PW, Sinclair E, Rodriguez B, Shive C, Clagett B, Funderburg N, Robinson J, Huang Y, Epling L, Martin JN, Deeks SG, Meinert CL, Van Natta ML, Jabs DA, Lederman MM. Gut epithelial barrier dysfunction and innate immune activation predict mortality in treated HIV infection. J Infect Dis. 2014;210(8):1228-38. doi: 10.1093/infdis/jiu238. PubMed PMID: 24755434; PMCID: PMC4192038.
8. Tenorio AR, Zheng Y, Bosch RJ, Krishnan S, Rodriguez B, Hunt PW, Plants J, Seth A, Wilson CC, Deeks SG, Lederman MM, Landay AL. Soluble markers of inflammation and coagulation but not T-cell activation predict non-AIDS-defining morbid events during suppressive antiretroviral treatment. J Infect Dis. 2014;210(8):1248-59. doi: 10.1093/infdis/jiu254. PubMed PMID: 24795473; PMCID: PMC4192039.
9. Grund B, Baker JV, Deeks SG, Wolfson J, Wentworth D, Cozzi-Lepri A, Cohen CJ, Phillips A, Lundgren JD, Neaton JD, Group ISESS. Relevance of Interleukin-6 and D-Dimer for Serious Non-AIDS Morbidity and Death among HIV-Positive Adults on Suppressive Antiretroviral Therapy. PLoS One. 2016;11(5):e0155100. doi: 10.1371/journal.pone.0155100. PubMed PMID: 27171281; PMCID: PMC4865234.
10. Vujkovic-Cvijin I, Sortino O, Verheij E, Sklar J, Wit FW, Kootstra NA, Sellers B, Brenchley JM, Ananworanich J, Loeff MSV, Belkaid Y, Reiss P, Sereti I. HIV-associated gut dysbiosis is independent of sexual practice and correlates with noncommunicable diseases. Nat Commun. 2020;11(1):2448. doi: 10.1038/s41467-020-16222-8. PubMed PMID: 32415070; PMCID: PMC7228978.
11. Ancona G ME, Tincati C, Barassi A, Calcagno A, Augello M, Bono V, Bai F, Cannizzo ES, d’Arminio Monforte A, Marchetti G. Long-Term Suppressive cART Is Not Sufficient to Restore Intestinal Permeability and Gut Microbiota Compositional Changes. Frontiers in immunology2021.
12. Rhoades N, Mendoza N, Jankeel A, Sureshchandra S, Alvarez AD, Doratt B, Heidari O, Hagan R, Brown B, Scheibel S, Marbley T, Taylor J, Messaoudi I. Altered Immunity and Microbial Dysbiosis in Aged Individuals With Long-Term Controlled HIV Infection. Front Immunol. 2019;10:463. doi: 10.3389/fimmu.2019.00463. PubMed PMID: 30915086; PMCID: PMC6423162.
13. Nganou-Makamdop K, Talla A, Sharma AA, Darko S, Ransier A, Laboune F, Chipman JG, Beilman GJ, Hoskuldsson T, Fourati S, Schmidt TE, Arumugam S, Lima NS, Moon D, Callisto S, Schoephoerster J, Tomalka J, Mugyenyi P, Ssali F, Muloma P, Ssengendo P, Leda AR, Cheu RK, Flynn JK, Morou A, Brunet-Ratnasingham E, Rodriguez B, Lederman MM, Kaufmann DE, Klatt NR, Kityo C, Brenchley JM, Schacker TW, Sekaly RP, Douek DC. Translocated microbiome composition determines immunological outcome in treated HIV infection. Cell. 2021;184(15):3899-914 e16. doi: 10.1016/j.cell.2021.05.023. PubMed PMID: 34237254; PMCID: PMC8316372.
14. Serrano-Villar S, Sanchez-Carrillo S, Talavera-Rodriguez A, Lelouvier B, Gutierrez C, Vallejo A, Servant F, Bernadino JI, Estrada V, Madrid N, Gosalbes MJ, Bisbal O, de Lagarde M, Martinez-Sanz J, Ron R, Herrera S, Moreno S, Ferrer M. Blood Bacterial Profiles Associated With Human Immunodeficiency Virus Infection and Immune Recovery. J Infect Dis. 2021;223(3):471-81. doi: 10.1093/infdis/jiaa379. PubMed PMID: 32601702.
15. Ferrari B, Da Silva AC, Liu KH, Saidakova EV, Korolevskaya LB, Shmagel KV, Shive C, Pacheco Sanchez G, Retuerto M, Sharma AA, Ghneim K, Noel-Romas L, Rodriguez B, Ghannoum MA, Hunt PP, Deeks SG, Burgener AD, Jones DP, Dobre MA, Marconi VC, Sekaly RP, Younes SA. Gut-derived bacterial toxins impair memory CD4+ T-cell mitochondrial function in HIV-1 infection. J Clin Invest. 2022;132(9). doi: 10.1172/JCI149571. PubMed PMID: 35316209; PMCID: PMC9057623.
16. Nystrom S, Govender M, Yap SH, Kamarulzaman A, Rajasuriar R, Larsson M. HIV-Infected Individuals on ART With Impaired Immune Recovery Have Altered Plasma Metabolite Profiles. Open Forum Infect Dis. 2021;8(7):ofab288. doi: 10.1093/ofid/ofab288. PubMed PMID: 34258318; PMCID: PMC8271132.
17. Zhang W, Ruan L. Recent advances in poor HIV immune reconstitution: what will the future look like? Front Microbiol. 2023;14:1236460. doi: 10.3389/fmicb.2023.1236460. PubMed PMID: 37608956; PMCID: PMC10440441.
18. Tincati C, Merlini E, Braidotti P, Ancona G, Savi F, Tosi D, Borghi E, Callegari ML, Mangiavillano B, Barassi A, Bulfamante G, d’Arminio Monforte A, Romagnoli S, Chomont N, Marchetti G. Impaired gut junctional complexes feature late-treated individuals with suboptimal CD4+ T-cell recovery upon virologically suppressive combination antiretroviral therapy. AIDS. 2016;30(7):991-1003. doi: 10.1097/QAD.0000000000001015. PubMed PMID: 27028142.
19. Chung CY, Alden SL, Funderburg NT, Fu P, Levine AD. Progressive proximal-to-distal reduction in expression of the tight junction complex in colonic epithelium of virally-suppressed HIV+ individuals. PLoS Pathog. 2014;10(6):e1004198. doi: 10.1371/journal.ppat.1004198. PubMed PMID: 24968145; PMCID: PMC4072797.
20. Somsouk M, Estes JD, Deleage C, Dunham RM, Albright R, Inadomi JM, Martin JN, Deeks SG, McCune JM, Hunt PW. Gut epithelial barrier and systemic inflammation during chronic HIV infection. AIDS. 2015;29(1):43-51. doi: 10.1097/QAD.0000000000000511. PubMed PMID: 25387317; PMCID: PMC4444362.
21. Guillen Y, Noguera-Julian M, Rivera J, Casadella M, Zevin AS, Rocafort M, Parera M, Rodriguez C, Arumi M, Carrillo J, Mothe B, Estany C, Coll J, Bravo I, Herrero C, Saz J, Sirera G, Torrella A, Navarro J, Crespo M, Negredo E, Brander C, Blanco J, Calle ML, Klatt NR, Clotet B, Paredes R. Low nadir CD4+ T-cell counts predict gut dysbiosis in HIV-1 infection. Mucosal Immunol. 2019;12(1):232-46. doi: 10.1038/s41385-018-0083-7. PubMed PMID: 30171206.
22. Tincati C, Bono V, Cannizzo ES, Tosi D, Savi F, Falcinella C, Casabianca A, Orlandi C, Luigiano C, Augello M, Rusconi S, Muscatello A, Bandera A, Calcagno A, Gori A, Nozza S, Marchetti G, on behalf of the Italian Network of AHIVI. Primary HIV infection features colonic damage and neutrophil inflammation yet containment of microbial translocation. AIDS. 2024;38(5):623-32. doi: 10.1097/QAD.0000000000003799. PubMed PMID: 38016163; PMCID: PMC10942218.
23. Deleage C, Schuetz A, Alvord WG, Johnston L, Hao XP, Morcock DR, Rerknimitr R, Fletcher JL, Puttamaswin S, Phanuphak N, Dewar R, McCune JM, Sereti I, Robb M, Kim JH, Schacker TW, Hunt P, Lifson JD, Ananworanich J, Estes JD. Impact of early cART in the gut during acute HIV infection. JCI Insight. 2016;1(10). doi: 10.1172/jci.insight.87065. PubMed PMID: 27446990; PMCID: PMC4951101.
24. Schuetz A, Deleage C, Sereti I, Rerknimitr R, Phanuphak N, Phuang-Ngern Y, Estes JD, Sandler NG, Sukhumvittaya S, Marovich M, Jongrakthaitae S, Akapirat S, Fletscher JL, Kroon E, Dewar R, Trichavaroj R, Chomchey N, Douek DC, RJ OC, Ngauy V, Robb ML, Phanuphak P, Michael NL, Excler JL, Kim JH, de Souza MS, Ananworanich J, Rv254/Search, Groups RSS. Initiation of ART during early acute HIV infection preserves mucosal Th17 function and reverses HIV-related immune activation. PLoS Pathog. 2014;10(12):e1004543. doi: 10.1371/journal.ppat.1004543. PubMed PMID: 25503054; PMCID: PMC4263756.
25. Sereti I, Krebs SJ, Phanuphak N, Fletcher JL, Slike B, Pinyakorn S, O’Connell RJ, Rupert A, Chomont N, Valcour V, Kim JH, Robb ML, Michael NL, Douek DC, Ananworanich J, Utay NS, Rv254/Search RS, teams Sp. Persistent, Albeit Reduced, Chronic Inflammation in Persons Starting Antiretroviral Therapy in Acute HIV Infection. Clin Infect Dis. 2017;64(2):124-31. doi: 10.1093/cid/ciw683. PubMed PMID: 27737952; PMCID: PMC5215214.
26. Sortino O, Phanuphak N, Schuetz A, Ortiz AM, Chomchey N, Belkaid Y, Davis J, Mystakelis HA, Quinones M, Deleage C, Ingram B, Rerknimitr R, Pinyakorn S, Rupert A, Robb ML, Ananworanich J, Brenchley J, Sereti I, Group RSS. Impact of Acute HIV Infection and Early Antiretroviral Therapy on the Human Gut Microbiome. Open Forum Infect Dis. 2020;7(12):ofz367. doi: 10.1093/ofid/ofz367. PubMed PMID: 33324725; PMCID: PMC7724511.
27. Bruzzesi E, Gabrieli A, Bernasconi D, Marchetti G, Calcagno A, Ripamonti D, Antinori A, Squillace N, Cingolani A, Muscatello A, Bandera A, Gori A, Rusconi S, Nozza S, Group IS. HIV-DNA decrease during treatment in primary HIV-1 infection with three different drug regimens: Italian Network of Acute HIV Infection (INACTION) clinical trial. J Med Virol. 2023;95(9):e29114. doi: 10.1002/jmv.29114. PubMed PMID: 37752816.
28. McMichael AJ, Borrow P, Tomaras GD, Goonetilleke N, Haynes BF. The immune response during acute HIV-1 infection: clues for vaccine development. Nat Rev Immunol. 2010;10(1):11-23. doi: 10.1038/nri2674. PubMed PMID: 20010788; PMCID: PMC3119211.
29. Brantly A, Yeakle K, Bouchard MJ, Gaskill PJ, Nonnemacher MR. The role of liver macrophages in viral liver pathogenesis. J Leukoc Biol. 2025;117(9). doi: 10.1093/jleuko/qiaf088. PubMed PMID: 40561105; PMCID: PMC12400039.
30. Escudie F, Auer L, Bernard M, Mariadassou M, Cauquil L, Vidal K, Maman S, Hernandez-Raquet G, Combes S, Pascal G. FROGS: Find, Rapidly, OTUs with Galaxy Solution. Bioinformatics. 2018;34(8):1287-94. doi: 10.1093/bioinformatics/btx791. PubMed PMID: 29228191.
31. Anhe FF, Jensen BAH, Varin TV, Servant F, Van Blerk S, Richard D, Marceau S, Surette M, Biertho L, Lelouvier B, Schertzer JD, Tchernof A, Marette A. Type 2 diabetes influences bacterial tissue compartmentalisation in human obesity. Nat Metab. 2020;2(3):233-42. doi: 10.1038/s42255-020-0178-9. PubMed PMID: 32694777.
32. Klatt NR, Funderburg NT, Brenchley JM. Microbial translocation, immune activation, and HIV disease. Trends Microbiol. 2013;21(1):6-13. doi: 10.1016/j.tim.2012.09.001. PubMed PMID: 23062765; PMCID: PMC3534808.
33. Raehtz KD, Pandrea I, Apetrei C. It’s all in the gut: the central role of the gut and microbiome in preventing disease progression in simian immunodeficiency viruses infected African nonhuman primates. Curr Opin HIV AIDS. 2025;20(2):124-32. doi: 10.1097/COH.0000000000000911. PubMed PMID: 39774258; PMCID: PMC11802300.
34. Brenchley JM. Mucosal immunity in human and simian immunodeficiency lentivirus infections. Mucosal Immunol. 2013;6(4):657-65. doi: 10.1038/mi.2013.15. PubMed PMID: 23549448; PMCID: PMC4154146.
35. Le Hingrat Q, Sereti I, Landay AL, Pandrea I, Apetrei C. The Hitchhiker Guide to CD4(+) T-Cell Depletion in Lentiviral Infection. A Critical Review of the Dynamics of the CD4(+) T Cells in SIV and HIV Infection. Front Immunol. 2021;12:695674. doi: 10.3389/fimmu.2021.695674. PubMed PMID: 34367156; PMCID: PMC8336601.
36. Allers K, Puyskens A, Epple HJ, Schurmann D, Hofmann J, Moos V, Schneider T. The effect of timing of antiretroviral therapy on CD4+ T-cell reconstitution in the intestine of HIV-infected patients. Mucosal Immunol. 2016;9(1):265-74. doi: 10.1038/mi.2015.58. PubMed PMID: 26129649.
37. Sainz T, Serrano-Villar S, Mann S, Ma ZM, Utay NS, Thompson CG, Chun TW, Kashuba AD, Siewe B, Albanese A, Troia-Cancio P, Sinclair E, Somasunderam A, Yotter T, Moreno S, Pollard RB, Landay A, Miller CJ, Asmuth DM. Delayed gastrointestinal-associated lymphoid tissue reconstitution in duodenum compared with rectum in HIV-infected patients initiating antiretroviral therapy. AIDS. 2019;33(15):2289-98. doi: 10.1097/QAD.0000000000002361. PubMed PMID: 31764094; PMCID: PMC6905119.
38. Giorgi JV, Ho HN, Hirji K, Chou CC, Hultin LE, O’Rourke S, Park L, Margolick JB, Ferbas J, Phair JP. CD8+ lymphocyte activation at human immunodeficiency virus type 1 seroconversion: development of HLA-DR+ CD38- CD8+ cells is associated with subsequent stable CD4+ cell levels. The Multicenter AIDS Cohort Study Group. J Infect Dis. 1994;170(4):775-81. doi: 10.1093/infdis/170.4.775. PubMed PMID: 7930717.
39. Asmuth DM, Pinchuk IV, Wu J, Vargas G, Chen X, Mann S, Albanese A, Ma ZM, Saroufeem R, Melcher GP, Troia-Cancio P, Torok NJ, Miller CJ, Powell DW. Role of intestinal myofibroblasts in HIV-associated intestinal collagen deposition and immune reconstitution following combination antiretroviral therapy. AIDS. 2015;29(8):877-88. doi: 10.1097/QAD.0000000000000636. PubMed PMID: 25784439; PMCID: PMC4520701.
40. Nielsen MM, Witherden DA, Havran WL. gammadelta T cells in homeostasis and host defence of epithelial barrier tissues. Nat Rev Immunol. 2017;17(12):733-45. doi: 10.1038/nri.2017.101. PubMed PMID: 28920588; PMCID: PMC5771804.
41. Walker EM, Slisarenko N, Gerrets GL, Grasperge BF, Mattison JA, Kissinger PJ, Welsh DA, Veazey RS, Jazwinski SM, Rout N. Dysregulation of IL-17/IL-22 Effector Functions in Blood and Gut Mucosal Gamma Delta T Cells Correlates With Increase in Circulating Leaky Gut and Inflammatory Markers During cART-Treated Chronic SIV Infection in Macaques. Front Immunol. 2021;12:647398. doi: 10.3389/fimmu.2021.647398. PubMed PMID: 33717202; PMCID: PMC7946846.
42. Schnell A, Littman DR, Kuchroo VK. T(H)17 cell heterogeneity and its role in tissue inflammation. Nat Immunol. 2023;24(1):19-29. doi: 10.1038/s41590-022-01387-9. PubMed PMID: 36596896; PMCID: PMC10795475.
43. Belkaid Y, Rouse BT. Natural regulatory T cells in infectious disease. Nat Immunol. 2005;6(4):353-60. doi: 10.1038/ni1181. PubMed PMID: 15785761.
44. Yero A, Farnos O, Rabezanahary H, Racine G, Estaquier J, Jenabian MA. Differential Dynamics of Regulatory T-Cell and Th17 Cell Balance in Mesenteric Lymph Nodes and Blood following Early Antiretroviral Initiation during Acute Simian Immunodeficiency Virus Infection. J Virol. 2019;93(19). doi: 10.1128/JVI.00371-19. PubMed PMID: 31315987; PMCID: PMC6744245.
45. Sereti I, Verburgh ML, Gifford J, Lo A, Boyd A, Verheij E, Verhoeven A, Wit F, Schim van der Loeff MF, Giera M, Kootstra NA, Reiss P, Vujkovic-Cvijin I. Impaired gut microbiota-mediated short-chain fatty acid production precedes morbidity and mortality in people with HIV. Cell Rep. 2023;42(11):113336. doi: 10.1016/j.celrep.2023.113336. PubMed PMID: 37918403; PMCID: PMC10872975.
46. Apetrei C, Gaufin T, Brocca-Cofano E, Sivanandham R, Sette P, He T, Sivanandham S, Martinez Sosa N, Martin KJ, Raehtz KD, Kleinman AJ, Valentine A, Krampe N, Gautam R, Lackner AA, Landay AL, Ribeiro RM, Pandrea I. T cell activation is insufficient to drive SIV disease progression. JCI Insight. 2023;8(14). doi: 10.1172/jci.insight.161111. PubMed PMID: 37485874; PMCID: PMC10443804.
47. Schnittman SR, Deitchman AN, Beck-Engeser G, Ahn H, York VA, Hartig H, Hecht FM, Martin JN, Deeks SG, Aweeka FT, Hunt PW. Abnormal Levels of Some Biomarkers of Immune Activation Despite Very Early Treatment of Human Immunodeficiency Virus. J Infect Dis. 2021;223(9):1621-30. doi: 10.1093/infdis/jiaa580. PubMed PMID: 32915986; PMCID: PMC8136975.
Submitted July 7, 2025 | Accepted October 7, 2025 | Published Nobember 13, 2025
Copyright © 2025 The Authors. This is an open-access article distributed under the terms of the Creative Commons Attribution 4.0 International License.