Mary E. Sehl1,2ŧ, Tammy M. Rickabaugh3ŧ, Roger Shih3, Otoniel Martinez-Maza4, Steve Horvath5,6, Christina M Ramirez6, Beth D. Jamieson1
1 Department of Medicine, Division of Hematology-Oncology, David Geffen School of Medicine, UCLA
2 Department of Computational Medicine, David Geffen School of Medicine, UCLA
3 Department of Pediatrics, Division of Hematology-Oncology, David Geffen School of Medicine, UCLA
4 Department of Obstetrics and Gynecology, David Geffen School of Medicine, UCLA
5 Department of Human Genetics, David Geffen School of Medicine, UCLA
6 Department of Biostatistics, Jonathan and Karin Fielding School of Public Health, UCLA
ŧ These authors contributed equally to this work.
Beth D. Jamieson
Division of Hematology-Oncology
Department of Medicine
David Geffen School of Medicine
700 Tiverton
Factor Building 12-240
Los Angeles, CA 90095-1745
E: bjamieso@ucla.edu
10.20411/pai.v5i1.376
Sehl ME, Rickabaugh TM, Shih R, Martinez-Maza O, Horvath S, Ramirez CM, Jamieson BD. The Effects of Anti-retroviral Therapy on Epigenetic Age Acceleration Observed in HIV-1-infected Adults. Pathogens and Immunity. 2020;5(1):ppx-ppy. PubMed PMID. doi: 10.20411/pai.v5i1.376
Background: HIV-1 infection is associated with acceleration of age-related methylation patterns in peripheral blood and brain of infected individuals although the relative contributions of HIV-1 infection versus its treatment to the observed accelerations in biological aging have not yet been investigated. Methods: In this longitudinal study of the effects of antiretroviral therapy (ART) on epigenetic aging patterns, we extracted DNA from peripheral blood mononuclear cells from 15 HIV-1-infected individuals infected at three time points: 6 months-1year pre-ART, 6-12 months post-initiation of ART, and 18-24 months after initiating ART. We compared these trajectories with those of 15 age-matched uninfected control participants at three time points with similar intervals. Methylation studies were performed using the Infinium methylation 450 arrays. We examined four epigenetic clock measurements: Age acceleration residual (AAR), Extrinsic (EEAA), Phenotypic (PEAA), and Grim (GEAA) epigenetic age acceleration. Weighted correlation network (WGCNA) analysis was used to identify clusters of highly co-methylated CpGs. Results: We found that prior to the initiation of ART all four epigenetic measures were significantly higher in HIV-1-infected individuals compared with uninfected individuals (P<0.001 for AAR, P=0.008 for EEAA, P=0.012 for GEAA, P<0.001 for PEAA using Wilcoxon rank sum tests between serostatus groups). These effects persisted after the initiation of ART, although the magnitude of these differences diminished. At 18-24 months post-ART initiation (time point 3), PEAA and GEAA were no longer significantly different between HIV-1-infected and uninfected individuals (P=0.059 for PEAA, P=0.11 for GEAA), while AAR and EEAA remained significantly higher in HIV-1-infected individuals compared with uninfected individuals. We further examined for global patterns of methylation differences between HIV-1-infected and uninfected at each time point, and found 14 groups of co-methylated CpGs that were significantly different between groups at baseline, and remained different after the initiation of ART. Conclusion: We confirm that epigenetic age acceleration associated with HIV-1 infection is most dramatic before ART initiation, and this observation is consistent across four epigenetic clock measurements, as well as in additional groups of co-methylated CpGs identified using WGCNA. Following initiation of ART, there is a partial reduction in age acceleration in all measures, with loss of any significant difference in PEAA and GEAA between serostatus groups. Our findings support the need for future studies examining for a link between epigenetic age acceleration and clinical outcomes in HIV-1-infected individuals.
Keywords HIV, aging, methylation, epigenetics, epigenetic clock
Despite dramatic improvements in lifespans for treated virologically suppressed HIV-infected adults, these individuals continue to experience a reduced healthspan compared to their uninfected peers. Treated HIV-infected adults experience earlier decreases in physical functions such as gait-speed [1] and grip strength [2], as well as increased rates of cardiovascular disease, diabetes, osteoporosis, renal failure, liver cancer and neurological dysfunction [3, 4], often a decade earlier than expected.
The mechanisms underlying this shortened healthspan are unclear and no study has yet untangled the effects of HIV infection versus ART [5]. While several studies have confirmed accelerations in age-associated methylation patterns in the peripheral blood of individuals infected with HIV-1 [6-9], previous studies have included only cross-sectional investigations comparing HIV-1-infected and uninfected populations [6], as well as investigations of infected individuals receiving therapy [8].
It is critical to determine whether the epigenetic changes observed in HIV-1-infected individuals are caused by the virus or by antiretroviral therapy, or even both. In the current study, using stored, viably-preserved, peripheral blood samples from the Multicenter AIDS Longitudinal Cohort Study (MACS), we examined longitudinal changes in global methylation patterns of a cohort of men infected with HIV-1, with measurements taken for each participant prior to the initiation of ART by 6 months to 1 year (Visit 1), 6-12 months after initiating ART (Visit 2), and 18-24 months after the initiation of ART (Visit 3). We compared these longitudinal measurements to those of uninfected age-matched control participants at three time points spaced at similar intervals and taken during similar calendar years. By examining multiple epigenetic clocks, as well as groups of co-methylated CpGs associated with both advancing age and HIV-1 infection, we confirm that HIV-1 infection accelerates epigenetic aging, and we observe that ART does not fully restore epigenetic aging to patterns consistent with chronologic age by two years post-ART initiation.
This study was approved by the University of California, Los Angeles Medical Institutional Review Board and each participant was provided written, informed consent per the approved protocol-IRB# 10-001677.
Viably cryopreserved peripheral blood mononuclear cell (PBMC) samples were selected from 30 participants enrolled in the Multicenter AIDS Cohort Study (MACS), a study of the natural and treated history of HIV-1 infection in men who have sex with men [10]. There were two groups of participants: 15 HIV-infected individuals (HIV+), 39-48 years of age, who initiated ART while enrolled in the MACS. ART initiation was self-reported, but verified by observed reductions of viral load to less than 50 copies of viral RNA per ml of plasma in all visits selected post ART initiation. Fifteen uninfected individuals (HIV-), age-matched to the HIV+ men, 39-48 years of age, were also matched to the HIV+ men for visit date, history of smoking, and ethnicity. For the HIV+ individuals, we obtained samples 6-12 months pre-ART, 6-12 months post-ART, and 18-24 months post-ART, and corresponding samples from the same visit dates were selected from the HIV- men for a total of 90 samples.
Cryopreserved human peripheral blood mononuclear cells, obtained from the UCLA Multi-Center AIDS Cohort Study (MACS) repository were thawed and assayed for viability using trypan blue. The mean viability of the samples was 88%. A total of 1x10⁶ viable PBMC were used for genomic DNA isolation using Qiagen DNeasy blood and tissue mini spin columns. The quality of DNA samples was assessed using nanodrop measurements and accurate DNA concentrations were measured using a Qubit assay kit (Life Technology).
Methylation levels at more than 450K CpGs were measured using the Illumina Infinium Human Methylation 450 arrays. These arrays interrogate methylation sites covering 99% of RefSeq genes with an average of 17 CpG sites throughout the promoter 5’ and 3’ UTRs and coding regions of each gene. In addition, the arrays cover CpG islands, island shores, and other sites distributed throughout the genome. Genomic DNA was prepared as described above. Each DNA sample from an HIV+ individual had a matched sample from an HIV- control individual that was placed on the same chip. Within each chip, the samples were arranged so that HIV+ samples were not placed in adjacent spots with their matched HIV- controls and one of each type of sample on the chip occupied each corner.
Bisulfite conversion was performed by the UCLA Neuroscience Genomics Core facilities. 500 ng of genomic DNA was bisulfate converted using the EZ-methylation kit (Zymo Research, Orange, CA, USA) followed by microarray hybridization of the Human Infinium methylation 450 arrays (Illumina, San Diego, CA), and scanning (iScan, Illumina), according to the manufacturer’s protocols by applying standard settings. DNA methylation levels (β values) were determined by calculating the ratio of intensities between methylated (signal A) and unmethylated (signal B) sites. Specifically, the β value was calculated from the intensity of the methylated (M corresponding to signal A) and unmethylated (U corresponding to signal B) sites, as the ratio of fluorescent signals β=Max(M,0)/[Max(M,0) + Max(U,0) + 100]. Thus, β values range from 0 (completely unmethylated) to 1 (completely methylated). To impute missing β values, we used a Euclidean metric to find k-nearest neighbors and impute the missing elements by averaging non-missing elements of its neighbors, using the impute.knn function in R [11]. Quantile normalization was applied to the raw data, in order to detect and remove outliers, and with the goal of making data comparable to the training data of the epigenetic clock.
To examine for global methylation changes associated with age, HIV, and ART initiation, we used weighted correlation network analysis (WGCNA) [12]. We used a signed weighted correlation network leading to groups of co-methylated CpGs comprised of positively related CpGs, based on prior work showing that CpGs with a positive age relationship have a different biological interpretation than negatively correlated CpGs [13]. We defined co-methylated CpG groups using average linkage hierarchical clustering [14, 15], and the dynamic hybrid branch cutting approach implemented in the R package dynamicTreeCut [12]. Because each co-methylated CpG group brings together highly correlated methylation profiles, it is useful to summarize the profiles in each GpG group using a single representative profile. We calculated a representative of each co-methylated CpG group (co-methylated CpG group eigenvector), correlated co-methylated CpG group eigenvectors with HIV-1 infection status and ART, and defined a continuous measure of co-methylated CpG group membership (kME, the correlation of the methylation profile with the co-methylated CpG group eigenvector) in the consensus co-methylated GpG group. Defining co-methylated GpG group membership as correlation allows one to easily calculate the statistical significance (P-value) and efficiently annotate all 450,000 CpGs on the Infinium methylation 450 arrays with respect to co-methylated GpG group membership [16].
Here we use the epigenetic clock method (based on the DNAm levels of 353 CpGs) [17]. The method applies to three commercially standardized methylation platforms: the Illumina 850K (EPIC), 450K and 27K arrays. The epigenetic clock method is an attractive biomarker of aging because (1) it applies to most human tissues; and (2) its accurate measurement of chronological age is unprecedented [17]. Furthermore, it is accelerated in disease states and is predictive of all-cause mortality after adjusting for known risk factors [18]. Predicted age, referred to as DNAm age, correlates with chronological age in sorted cell types (CD4 T cells, monocytes, B cells, glial cells, neurons) and tissues and organs including whole blood, brain, breast, kidney, liver, lung, and saliva [17]. An online age calculator can be found at our webpage (https://dnamage.genetics.ucla.edu/new).
We examined four measures of epigenetic age acceleration: Age acceleration residual (AAR) based on 353 CpGs of Horvath [17], Extrinsic epigenetic age acceleration (EEAA) based on 71 CpGs of Hannum [19], Phenotypic epigenetic age acceleration (PEAA) based on 513 CpGs of Levine [20], and Grim epigenetic age acceleration (GEAA) based on 1030 CpGs of Lu [21]. Briefly, AAR is a multi-tissue clock that captures epigenetic age acceleration and is valid for a wide range of tissue types. It is highly correlated with chronological age and accelerated in disease states. While both PEAA and GEAA predict lifespan (time-to-death and all-cause mortality), PEAA was developed by regressing a phenotypic measure of mortality risk on CpGs, whereas GEAA is formed by regressing time-to-death on DNAm-based surrogate biomarkers of smoking pack-years and a selection of plasma proteins previously associated with mortality or morbidity [20, 21]. Note that here we do not examine intrinsic epigenetic age acceleration, which is based on the Horvath clock with adjustment for cell composition, because HIV is known to affect cell composition. By construction, EEAA is positively correlated with senescent T lymphocytes and negatively correlated with naïve T lymphocytes.
DNA methylation (DNAm) age was estimated using the online epigenetic clock software (http://dnamage.genetics.ucla.edu) which calculates Horvath’s pan tissue clock, Grim Age, Phenotypic Age, blood cell counts and many additional DNAm based biomarkers [17]. The epigenetic “age acceleration residual” (AAR, defined as the residual regressing DNAm age on chronologic age) was compared between HIV-infected and uninfected individuals, using the Wilcoxon rank sum test, a non-parametric group comparison test, at each of three visits (one prior to, and two following the initiation of antiretroviral therapy). By definition, chronological age is not correlated (r=0) with our measures of epigenetic age acceleration (AAR, EEAA, PEAA, GEAA).
We examined between group differences in means for AAR, EEAA, PEAA, and GEAA in HIV-infected compared with HIV-uninfected individuals using the non-parametric Wilcoxon rank-sum test at all three time points studied. In order to test for within-group differences from Visit 1 to Visit 2, from Visit 1 to Visit 3, and Visit 2 to Visit 3, we examined the Paired Samples Wilcoxon signed-rank test. All tests were two-sided.
While the epigenetic clock is a robust and highly revealing measurement of DNAm age, it is restricted to the 353 CpG sites previously shown to be tightly correlated with chronologic age across multiple cell and tissue types [17]. Similarly, the EEAA, PEAA, and GEAA measures are restricted to the 71, 513, 1,030 CpGs, respectively, from which they are constructed. Variables such as age and HIV-1 infection will also influence thousands of other CpG sites throughout the genome [6]. The wider influence of these variables on the epigenome can be explored through the application of weighted gene co-expression network analysis (WGCNA) [12].
A signed weighted correlation network analysis was used to identify co-methylated CpG groups comprised of positively related CpGs. After identifying these co-methylated CpG groups, we calculated a representative of each co-methylated CpG group (co-methylated CpG group eigenvector), and examined whether each co-methylated CpG group eigenvector was associated with HIV infection or antiretroviral therapy use, using the Kruskal Wallis non-parametric multi group comparison test.
For co-methylated CpG groups identified as significantly associated with either HIV infection or antiretroviral therapy use, we examined between group differences in mean co-methylated CpG group eigenvector methylation in HIV-infected compared with HIV-uninfected individuals using the non-parametric Wilcoxon rank-sum test at all three study Visits. In order to test for within group differences from Visit 1 to Visit 2, from Visit 1 to Visit 3, and Visit 2 to Visit 3, we examined the Paired Samples Wilcoxon signed-rank test.
Table 1 describes the clinical characteristics of subjects at study visits. ART initiation occurred in HIV-1-infected subjects between Visit 1 and Visit 2. The average age±SD at ART initiation was 43.7±٣.٣ years. In order to examine whether epigenetic age is accelerated in the setting of HIV-1 infection in the absence of therapy, and whether this acceleration persists after the introduction of therapy, we examined four measures of DNA methylation (AAR, EEAA, PEAA, and GEAA) at three time points: 6 months to 1 year pre-ART (Visit 1), 6-12 months after the initiation of ART (Visit 2), and 18-24 months after the initiation of ART (Visit 3). When we compare HIV-1-infected seropositive men at their pre-ART visit with seronegative men, we find that untreated HIV-1-infected men had a DNAm age that was approximately 8.4 years “older” than their chronologic age and significantly more advanced than their uninfected peers (P=<0.001) (see Figure 1A). Despite ART initiation and successful suppression of HIV-1-RNA to less than 50 copies per ml of plasma, at approximately 2 years post-ART initiation, the HIV+ men demonstrated a DNAm age that was approximately 6.8 years “older” than their chronologic age and these men remained significantly “older” than their uninfected peers (P=0.017), documenting that by 2 years post-ART initiation ART was unable to fully restore their DNAm age to patterns consistent with their chronologic age. Also of interest, is our finding that the HIV- men also appear to be slightly older by DNAm age than their chronologic age by an average of 2 years at baseline (range: -4.3, 9.5, P=0.06 by the signed rank test), although this is within the range of normal variation of this measure [17].
Table 1. Characteristics of subjects at study visits.
|
|
|
|||||
|
Characteristics at Visit |
|
|
|
|
|
|
|
Age (years), Mean ± SD |
42.9 ± 3.3 |
44.7 ± 3.4 |
45.7 ± 3.3 |
42.6 ± 3.5 |
44.9 ± 3.4 |
45.8 ± 3.3 |
|
CD4 T cells (cells/mL), Mean ± SD |
353 ± 190 |
480 ± 221 |
535 ± 245 |
970 ± 331 |
960 ± 338 |
966 ± 395 |
|
CD8 T cells (cells/mL), Mean ± SD |
1,124 ± 598 |
1,069 ± 457 |
995 ± 556 |
492 ± 131 |
498 ± 162 |
435 ± 157 |
|
HIV viral load (copies/mL)a, Mean ± SD |
41,456 ± 67,317 |
<50 ± 0 |
<50 ± 0 |
|||
a ART initiation in HIV-1-infected subjects occurred between Visit 1 and Visit 2
Figure 1A. Epigenetic age acceleration for HIV- and HIV+ before and after initiation of ART. Box plots of Methylation Age minus Chronological Age (Figure A), age acceleration residual (Figure B), and Extrinsic age acceleration (Figure C), in years of two groups, HIV- and HIV+ individuals (n=15 per group). Reported p values are a result of Wilcoxon rank sum tests between the two serostatus groups at the 3 Visits.
Figure 1B.
Figure 1C.
AAR, calculated using the residuals obtained when regressing DNAm age on chronologic age, was significantly higher in HIV-1-infected individuals compared with matched HIV- controls (P<0.001 using a nonparametric Wilcoxon rank sum test comparing median values). AAR was significantly higher in HIV-1-infected HIV+ compared with controls at both 6-12 months (P=0.003) and 18 months to 2 years (P=0.019) post-ART initiation (see Figure 1B) despite successful viral suppression.
Extrinsic age is based on 71 CpGs [19] and is positively, and negatively, correlated with senescent and naïve cytotoxic T cells, respectively. Figure 1C reveals EEAA for HIV- and HIV+ individuals at each visit. This measure is significantly higher in HIV+ individuals compared with HIV- individuals (P<0.001 using the Wilcoxon rank sum test) at Visit 1. The mean difference in EEAA between HIV- and HIV+ groups decreases after initiation of ART but the HIV+ group exhibits significantly higher degrees of acceleration at both 6-12 months post-ART and 18-24 months post-ART (P=0.003).
In order to assess acceleration in epigenetic measures of healthspan, morbidity, and mortality risk, we examined both PEAA and GEAA. Both Phenotypic age, based on 513 CpGs [20], and Grim age [21], based on 1030 CpGs, are highly predictive of lifespan and healthspan. In addition, Grim age is associated with clinical biomarkers and age-related medical conditions [21]. We set out to examine whether these measures were also accelerated in HIV-1 infection. Figure 2 reveals GEAA (Panel 2A) and PEAA (Panel 2B) for HIV- and HIV+ individuals before and after the initiation of ART therapy. With these two clocks, we detect the largest mean difference between HIV- and HIV+ groups prior to the initiation of ART (P=0.012 for GEAA, P<0.001 for PEAA). At 18-24 months after the initiation of ART, there is no significant difference between HIV- and HIV+ in both GEAA (P=0.11) and PEAA (P=0.059).
Figure 2A. Grim Age Acceleration (Panel A) and Phenotypic Age Acceleration (Panel B) for HIV- and HIV+ individuals before and after the initiation of ART. Data are shown for HIV- and HIV+ groups (n=15 per group) at the 3 Visits. Reported p values are a result of Wilcoxon rank sum tests between the two serostatus groups at the 3 time points.
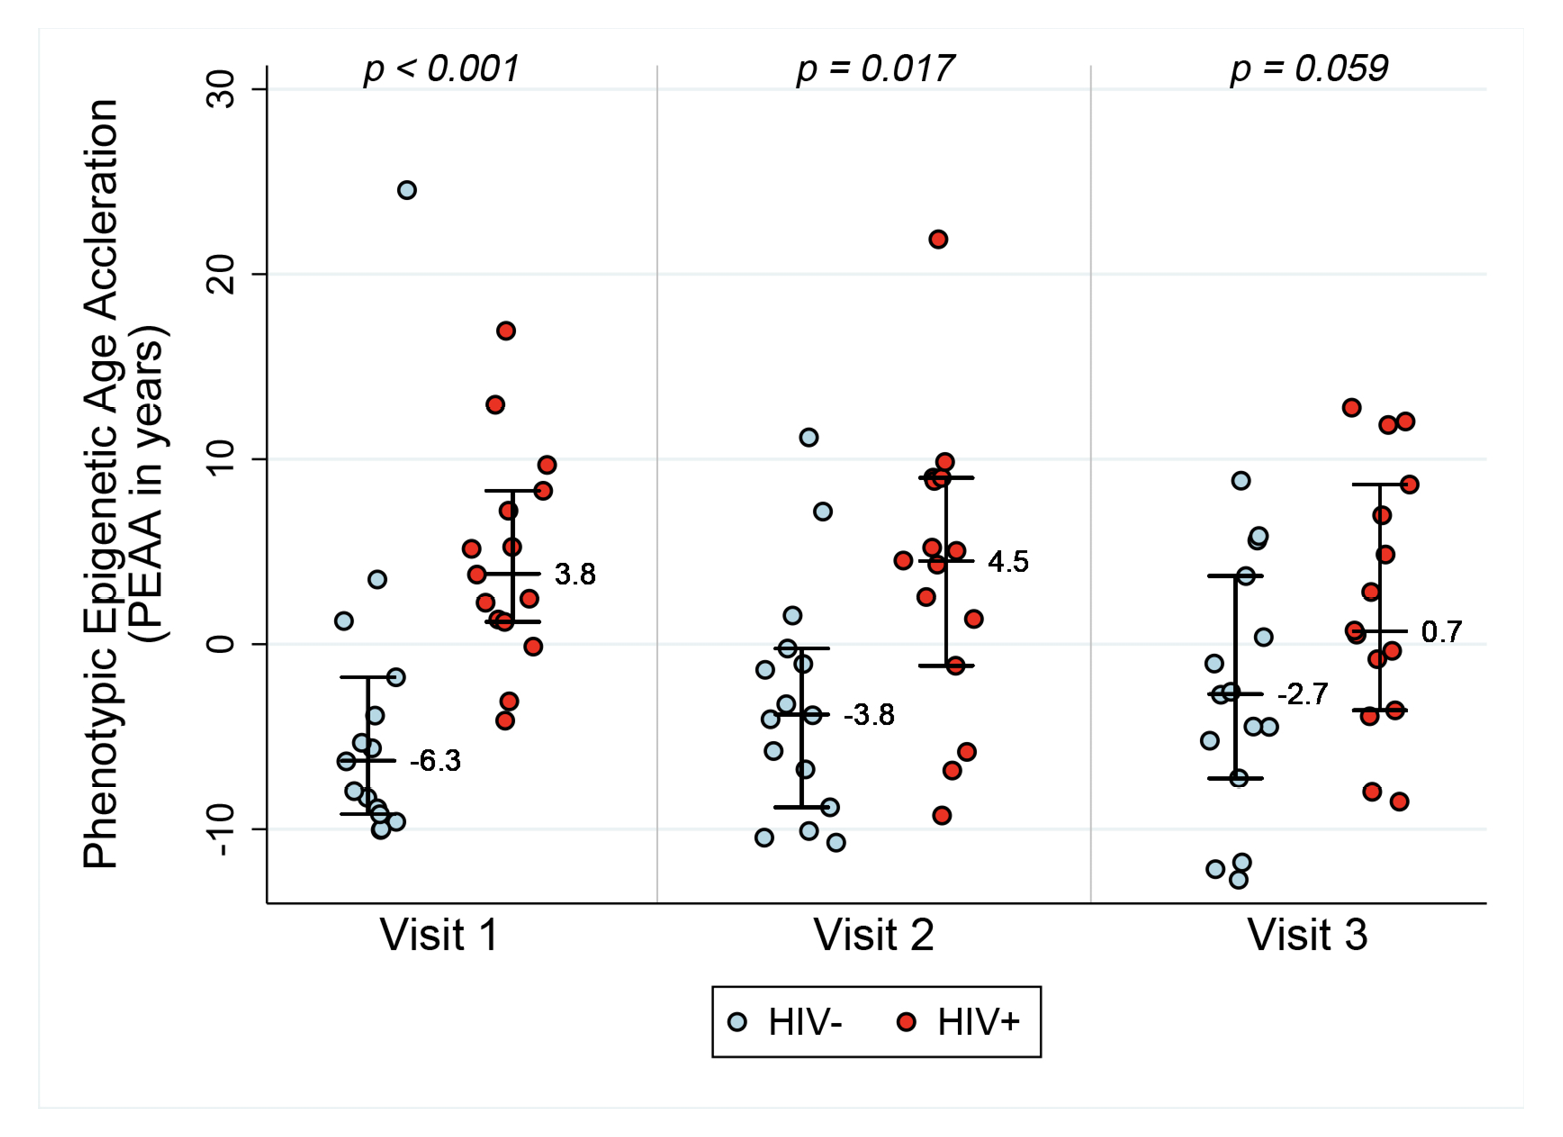
Figure 2B.
We applied WGCNA to explore the effects of HIV-1 infection and ART on changes in the degree of methylation at CpG sites throughout the more than 450,000 CpG sites assessed in the methylation array. We identified 83 clusters of CpGs whose methylation levels were highly correlated in our analysis compared with a single reference co-methylated CpG group. Of these,14 co-methylated CpG group eigenvectors were significantly associated with HIV-1 infection status, using a Bonferroni correction of 0.05/83=0.0006.
In order to examine whether global methylation differences between HIV- and HIV+ individuals change with ART, we compared mean methylation for each co-methylated CpG group eigenvector (CCG) at each time point. CCG4, our largest co-methylated CpG group with 41,384 CpG sites, is a representative example of a co-methylated CpG group associated with HIV-infection, and this association did not appear to be influenced by the initiation of ART (Figure 3). Other co-methylated CpG groups showed similar patterns, consistent with a lack of global ART-induced changes in HIV-1-induced methylation patterns.

Figure 3. Co-methylated CpG groups are associated with HIV status before and after the initiation of ART. This figure shows boxplots for co-methylated CpG group 4 identified from Weighted Gene Correlation Network Analysis (WGCNA). P values shown were calculated using the Wilcoxon rank sum tests between the two serostatus groups at the 3 time points
Co-methylated CpG group 4 (CCG4) was the largest of the 14 co-methylated CpG groups. Using the online functional annotation tool David (https://david-d.ncifcrf.gov/), we analyzed the CpGs contained within CCG4 for their gene ontology revealing that within CCG4 41,384 CgG sites were associated with 30,682 genes. To better analyze the data, we pared the CpG sites down to those 2,581 CpG that had a kME of >0.85. Those sites were then grouped by DAVID into 997 gene clusters, only 273 of which met the Benjamini cutoff of P>0.05. Supplementary Table 1 lists the Top 49 gene pathways that these 273 genes fall into.
The co-methylation CpG group identified in our global analysis (CCG4) is enriched for CpGs
that fall within genes associated with the polycomb group target (PCGT) pathway, which is involved in stem cell self-renewal, and has shown to be altered in aging, dysplasia, and carcinogenesis. This analysis was performed to search for pathways, in addition to those within the Horvath, Hannum, Grim, and Phenotypic epigenetic aging clocks, that could be associated with aging, HIV, and ART initiation.
Polycomb Group Target Genes (PcGT) are involved in the regulation of development, maintenance of progenitor cell identity, and cancer [22]. We previously reported that the co-methylated CpG group most highly correlated with both untreated HIV-1 status and aging, co-methylation CpG group 3 (CCG3, previously published under the term “module eigenvector 3”), had 14 PcGT that fell among the 990 genes with a strong co-methylated CpG group membership as defined by a kME of >0.85 [6]. In the study reported herein, all but one of those PcGT genes (FBX039) were also found in CCG4, demonstrating overlap of gene clusters between our current CCG4 and our previously reported CCG3 [6]. As in our previous study [6], these genes had multiple CpGs that fell within CCG4, suggesting strong suppression of those genes in response to HIV-1 infection and minimal to no change with ART initiation. The presence of these genes is associated with development, stemness, and cancer, and the presence of multiple CpG sites for each gene within CCG4 suggests this co-methylated CpG group captures genes with a functional relationship with aging. The overlap of these genes between two separate studies demonstrates the reproducibility of our results across disparate samples and datasets.
We have confirmed that age-associated methylation patterns are accelerated in HIV-1-infected men, and this accleration is present before the start of antirretroviral therapy. We find that four measures of biological age-acceleration: AAR, EEAA, PEAA, and GEAA are elevated in HIV-1 infection prior to the initiation of ART, clearly demonstrating the role of HIV infection in biologic age acceleration. We further show that ART partially reduces the degree of acceleration of all of these measures of biological aging, but not to the baseline uninfected levels for AAR and EEAA. Even in the setting of adequate therapy there is still an ongoing acceleration of epigenetic aging according to all four epigenetic clocks.
While the magnitude of the mean difference in epigenetic age acceleration decreases for each of the four clocks from pre- to post-treatment, we find that for two measures based on Horvath’s pan tissue clock (AAR and intrinsic epigenetic age acceleration) there is a persistently significant difference between HIV- and HIV+ individuals at all visits. By contrast, for GEAA and PEAA, the difference between HIV- and HIV+ individuals is not significantly different at Visit 3 (18-24 months after the initiation of ART), which probably reflects the normalization of blood-cell counts following successful treatment. Unlike the Horvath pan tissue clock, Grim age, Phenotypic age, and the Hannum age estimators exhibit substantially stronger correlations with blood-cell counts. This finding suggests that epigenetic measures that are highly predictive of lifespan and healthspan (Grim age and Phenotypic age) improve with ART earlier than epigenetic clocks that are more reflective of properties of hematopietic stem cells (such as the Horvath pan tissue clock). These observations are consistent with the observation that even several years after the initiation of ART, HIV-1-infected adults experience increased morbidity from age-related illnesses compared with HIV-1-uninfected individuals, as well as increased frailty, geriatric syndromes, and non-AIDS related cancers including lung cancer [4, 23-25].
Our findings raise the question of whether epigenetic aging mediates age-related diseases such as those found in treated HIV-infected individuals. They further raise the question of whether accelerated biologic aging can be reversed and how fast we might expect possible reversal of epigenetic aging to affect the progression of these processes.
Also of interest is the relationship between immune system composition, well documented to change during aging and HIV infection, and epigenetics. We hypothesize that immunosenescence represents at least one mechanism through which accelerated epigenetic aging may contribute to mortality in HIV infection. Immunosenescence has been shown to be associated with both faster HIV-1 disease progression, [26] dysregulated immunity, and chronic diseases in HIV-1-infected adults [27], leading others to conclude that immunosenescence is a contributor to accelerated aging in HIV-infected adults [28]. We previously documented a strong association between accelerated epigenetic age, as measured by the epigenetic clock, and activated and senescent CD8+ T-cells [6]. Those results were again found in this study (data not shown). Future studies could be directed towards identifying individuals at risk for early onset of age-related illnesses, and consideration of senolytic therapies as potential prevention for age-related illnesses in older individuals living with HIV. Focused interventions and preventive strategies, such as exercise interventions, could be directed towards those individuals identified, using the epigenetic clock, to exhibit a high degree of accelerated biological aging and at higher risk of earlier onset of age-related illnesses.
The CpG groups identified in the global analysis are enriched for CpGs that fall within genes associated with the polycomb group target (PCGT) pathway, which is involved in stem cell self-renewal, and has shown to be altered in aging, dysplasia, and carcinogenesis. This analysis was performed to search for pathways, in addition to those within the Horvath, Hannum, Grim, and Phenotypic epigenetic aging clocks, that could be associated with aging, HIV, and ART initiation. While the pan-tissue Horvath clock, Phenotypic, and Grim aging clocks are associated with PCGT protein target sites, the Grim and Phenotypic aging clocks are further enriched for markers of inflammation. These include pathways involved in pro-inflammatory signaling, multiple toll-like receptor signaling, the JAK-STAT cascade, TNF-mediated signaling, and NFκB transcription factor activity. In addition, acceleration of the Phenotypic age clock is inversely associated with expression of genes associated with DNA damage recognition and repair.
There are several limitations with this study, the first being the small sample size. Larger samples sizes will be needed to confirm that the GEAA and PEAA are restored faster than the AAR and EEAA. While our HIV-1-infected and uninfected participants were matched on age, we were unable to adjust our analyses for additional covariates because of our limited sample size. Future larger studies are needed to examine the effects of ART on epigenetic aging, with adjustment for key demographic and clinical covariates including ethnicity, body mass index, and coexisting illnesses. Another limitation is that we did not rigorously investigate the introduction of new epigenetic changes by ART, which could affect the “restoration” of the different clocks. This will also be important to assess for future studies that may wish to explore associations between post-ART epigenetic patterns and future clinical outcomes.
We find that, at 18-24 months after ART initiation, there is no significant difference between epigenetic age acceleration, as measured by PhenoAge and GrimAge, between HIV-1-infected and uninfected individuals. Because HIV-1-infected adults experience increased earlier morbidity from age-related illnesses compared with HIV-1 uninfected adults after initiation of ART, we would expect epigenetic age acceleration to persist in all measures, particularly those most closely related to morbidity and mortality. However, we do note that AAR and EEAA remain persistently different long after ART initiation, suggesting that the epigenetic mechanisms captured by these clocks may drive HIV-associated age-related morbidity that continues after treatment. Larger studies are needed to assess whether acceleration in epigenetic aging is associated with outcomes such as age-related illnesses and frailty.
S.H. is listed as inventor of several patent applications surrounding epigenetic biomarkers of aging. All other authors declare that there are no competing interests in this study.
We thank all the study participants for their contribution to this work. The cryopreserved samples were obtained from the University of California Los Angeles site of the Multi-Center AIDS Cohort Study (MACS) (PIs Roger Detels, Otoniel Martínez-Maza). We would also like to thank Kevin Barrett for his assistance in sample selection, John Oishi for his oversight of the UCLA MACS site, and Najib Aziz for preparing and providing the samples. The methylation data was produced with the assistance of the Neuroscience Genomics Core at UCLA. We’d also like to thank Marianne Chow for her technical assistance and Dr. Elizabeth Breen for her careful reading and editing of the manuscript.
This work was supported by grants AG052340-01 and AG030327 from the National Institute on Aging/National Institutes of Health to B.D. Jamieson, PhD, and by the Susan G. Komen Career Catalyst Award CCR16380478 to M.E. Sehl. Data in this manuscript were collected by the Multicenter AIDS Cohort Study (MACS), now the MACS/WIHS Combined Cohort Study (MWCCS). The contents of this publication are solely the responsibility of the authors and do not represent the official views of the National Institutes of Health (NIH), and MWCCS (Principal Investigator) for Los Angeles CRS (Roger Detels), U01-HL146333. The MWCCS is funded primarily by the National Heart, Lung, and Blood Institute (NHLBI), with additional co-funding from the Eunice Kennedy Shriver National Institute of Child Health & Human Development (NICHD), the National Institute on Aging (NIA), the National Institute of Dental & Craniofacial Research (NIDCR), the National Institute of Allergy and Infectious Diseases (NIAID), the National Institute of Neurological Disorders and Stroke (NINDS), the National Institute of Mental Health (NIMH), the National Institute on Drug Abuse (NIDA), the National Institute of Nursing Research (NINR), the National Cancer Institute (NCI), the National Institute on Alcohol Abuse and Alcoholism (NIAAA), the National Institute on Deafness and Other Communication Disorders (NIDCD), the National Institute of Diabetes and Digestive and Kidney Diseases (NIDDK), and the National Institute on Minority Health and Health Disparities (NIMHD), and in coordination and alignment with the research priorities of the National Institutes of Health, Office of AIDS Research (OAR).
1. Schrack JA, Althoff KN, Jacobson LP, Erlandson KM, Jamieson BD, Koletar SL, Phair J, Ferrucci L, Brown TT, Margolick JB, Multicenter ACS. Accelerated Longitudinal Gait Speed Decline in HIV-Infected Older Men. J Acquir Immune Defic Syndr. 2015;70(4):370-6. Epub 2015/06/24. doi: 10.1097/QAI.0000000000000731. PubMed PMID: 26102450; PMCID: PMC4624470.
2. Schrack JA, Jacobson LP, Althoff KN, Erlandson KM, Jamieson BD, Koletar SL, Phair J, Brown TT, Margolick JB, Multicenter ACS. Effect of HIV-infection and cumulative viral load on age-related decline in grip strength. AIDS. 2016;30(17):2645-52. Epub 2016/10/27. doi: 10.1097/QAD.0000000000001245. PubMed PMID: 27603294; PMCID: PMC5083134.
3. Cole JH, Underwood J, Caan MW, De Francesco D, van Zoest RA, Leech R, Wit FW, Portegies P, Geurtsen GJ, Schmand BA, Schim van der Loeff MF, Franceschi C, Sabin CA, Majoie CB, Winston A, Reiss P, Sharp DJ, collaboration C. Increased brain-predicted aging in treated HIV disease. Neurology. 2017;88(14):1349-57. Epub 2017/03/05. doi: 10.1212/WNL.0000000000003790. PubMed PMID: 28258081; PMCID: PMC5379929.
4. High KP, Brennan-Ing M, Clifford DB, Cohen MH, Currier J, Deeks SG, Deren S, Effros RB, Gebo K, Goronzy JJ, Justice AC, Landay A, Levin J, Miotti PG, Munk RJ, Nass H, Rinaldo CR, Jr., Shlipak MG, Tracy R, Valcour V, Vance DE, Walston JD, Volberding P, HIV OARWGo, Aging. HIV and aging: state of knowledge and areas of critical need for research. A report to the NIH Office of AIDS Research by the HIV and Aging Working Group. J Acquir Immune Defic Syndr. 2012;60 Suppl 1(Suppl 1):S1-18. Epub 2012/08/08. doi: 10.1097/QAI.0b013e31825a3668. PubMed PMID: 22688010; PMCID: PMC3413877.
5. Smith RL, de Boer R, Brul S, Budovskaya Y, van Spek H. Premature and accelerated aging: HIV or HAART? Front Genet. 2012;3:328. Epub 2013/02/02. doi: 10.3389/fgene.2012.00328. PubMed PMID: 23372574; PMCID: PMC3556597.
6. Rickabaugh TM, Baxter RM, Sehl M, Sinsheimer JS, Hultin PM, Hultin LE, Quach A, Martinez-Maza O, Horvath S, Vilain E, Jamieson BD. Acceleration of age-associated methylation patterns in HIV-1-infected adults. PLoS One. 2015;10(3):e0119201. Epub 2015/03/26. doi: 10.1371/journal.pone.0119201. PubMed PMID: 25807146; PMCID: PMC4373843.
7. Horvath S, Levine AJ. HIV-1 Infection Accelerates Age According to the Epigenetic Clock. J Infect Dis. 2015;212(10):1563-73. Epub 2015/05/15. doi: 10.1093/infdis/jiv277. PubMed PMID: 25969563; PMCID: PMC4621253.
8. Gross AM, Jaeger PA, Kreisberg JF, Licon K, Jepsen KL, Khosroheidari M, Morsey BM, Swindells S, Shen H, Ng CT, Flagg K, Chen D, Zhang K, Fox HS, Ideker T. Methylome-wide Analysis of Chronic HIV Infection Reveals Five-Year Increase in Biological Age and Epigenetic Targeting of HLA. Mol Cell. 2016;62(2):157-68. Epub 2016/04/23. doi: 10.1016/j.molcel.2016.03.019. PubMed PMID: 27105112; PMCID: PMC4995115.
9. Horvath S, Stein DJ, Phillips N, Heany SJ, Kobor MS, Lin DTS, Myer L, Zar HJ, Levine AJ, Hoare J. Perinatally acquired HIV infection accelerates epigenetic aging in South African adolescents. AIDS. 2018;32(11):1465-74. Epub 2018/05/11. doi: 10.1097/QAD.0000000000001854. PubMed PMID: 29746298; PMCID: PMC6026068.
10. Kaslow RA, Ostrow DG, Detels R, Phair JP, Polk BF, Rinaldo CR, Jr. The Multicenter AIDS Cohort Study: rationale, organization, and selected characteristics of the participants. Am J Epidemiol. 1987;126(2):310-8. Epub 1987/08/01. doi: 10.1093/aje/126.2.310. PubMed PMID: 3300281.
11. Troyanskaya O, Cantor M, Sherlock G, Brown P, Hastie T, Tibshirani R, Botstein D, Altman RB. Missing value estimation methods for DNA microarrays. Bioinformatics. 2001;17(6):520-5. Epub 2001/06/08. doi: 10.1093/bioinformatics/17.6.520. PubMed PMID: 11395428.
12. Langfelder P, Horvath S. WGCNA: an R package for weighted correlation network analysis. BMC Bioinformatics. 2008;9:559. Epub 2008/12/31. doi: 10.1186/1471-2105-9-559. PubMed PMID: 19114008; PMCID: PMC2631488.
13. van Eijk KR, de Jong S, Boks MP, Langeveld T, Colas F, Veldink JH, de Kovel CG, Janson E, Strengman E, Langfelder P, Kahn RS, van den Berg LH, Horvath S, Ophoff RA. Genetic analysis of DNA methylation and gene expression levels in whole blood of healthy human subjects. BMC Genomics. 2012;13:636. Epub 2012/11/20. doi: 10.1186/1471-2164-13-636. PubMed PMID: 23157493; PMCID: PMC3583143.
14. Yip AM, Horvath S. Gene network interconnectedness and the generalized topological overlap measure. BMC Bioinformatics. 2007;8:22. Epub 2007/01/26. doi: 10.1186/1471-2105-8-22. PubMed PMID: 17250769; PMCID: PMC1797055.
15. Song L, Langfelder P, Horvath S. Comparison of co-expression measures: mutual information, correlation, and model based indices. BMC Bioinformatics. 2012;13:328. Epub 2012/12/12. doi: 10.1186/1471-2105-13-328. PubMed PMID: 23217028; PMCID: PMC3586947.
16. Horvath S, Dong J. Geometric interpretation of gene coexpression network analysis. PLoS Comput Biol. 2008;4(8):e1000117. Epub 2008/08/16. doi: 10.1371/journal.pcbi.1000117. PubMed PMID: 18704157; PMCID: PMC2446438.
17. Horvath S. DNA methylation age of human tissues and cell types. Genome Biol. 2013;14(10):R115. Epub 2013/10/22. doi: 10.1186/gb-2013-14-10-r115. PubMed PMID: 24138928; PMCID: PMC4015143.
18. Chen BH, Marioni RE, Colicino E, Peters MJ, Ward-Caviness CK, Tsai PC, Roetker NS, Just AC, Demerath EW, Guan W, Bressler J, Fornage M, Studenski S, Vandiver AR, Moore AZ, Tanaka T, Kiel DP, Liang L, Vokonas P, Schwartz J, Lunetta KL, Murabito JM, Bandinelli S, Hernandez DG, Melzer D, Nalls M, Pilling LC, Price TR, Singleton AB, Gieger C, Holle R, Kretschmer A, Kronenberg F, Kunze S, Linseisen J, Meisinger C, Rathmann W, Waldenberger M, Visscher PM, Shah S, Wray NR, McRae AF, Franco OH, Hofman A, Uitterlinden AG, Absher D, Assimes T, Levine ME, Lu AT, Tsao PS, Hou L, Manson JE, Carty CL, LaCroix AZ, Reiner AP, Spector TD, Feinberg AP, Levy D, Baccarelli A, van Meurs J, Bell JT, Peters A, Deary IJ, Pankow JS, Ferrucci L, Horvath S. DNA methylation-based measures of biological age: meta-analysis predicting time to death. Aging (Albany NY). 2016;8(9):1844-65. Epub 2016/10/01. doi: 10.18632/aging.101020. PubMed PMID: 27690265; PMCID: PMC5076441.
19. Hannum G, Guinney J, Zhao L, Zhang L, Hughes G, Sadda S, Klotzle B, Bibikova M, Fan JB, Gao Y, Deconde R, Chen M, Rajapakse I, Friend S, Ideker T, Zhang K. Genome-wide methylation profiles reveal quantitative views of human aging rates. Mol Cell. 2013;49(2):359-67. Epub 2012/11/28. doi: 10.1016/j.molcel.2012.10.016. PubMed PMID: 23177740; PMCID: PMC3780611.
20. Levine ME, Lu AT, Quach A, Chen BH, Assimes TL, Bandinelli S, Hou L, Baccarelli AA, Stewart JD, Li Y, Whitsel EA, Wilson JG, Reiner AP, Aviv A, Lohman K, Liu Y, Ferrucci L, Horvath S. An epigenetic biomarker of aging for lifespan and healthspan. Aging (Albany NY). 2018;10(4):573-91. Epub 2018/04/21. doi: 10.18632/aging.101414. PubMed PMID: 29676998; PMCID: PMC5940111.
21. Lu AT, Quach A, Wilson JG, Reiner AP, Aviv A, Raj K, Hou L, Baccarelli AA, Li Y, Stewart JD, Whitsel EA, Assimes TL, Ferrucci L, Horvath S. DNA methylation GrimAge strongly predicts lifespan and healthspan. Aging (Albany NY). 2019;11(2):303-27. Epub 2019/01/23. doi: 10.18632/aging.101684. PubMed PMID: 30669119; PMCID: PMC6366976.
22. Aloia L, Di Stefano B, Di Croce L. Polycomb complexes in stem cells and embryonic development. Development. 2013;140(12):2525-34. Epub 2013/05/30. doi: 10.1242/dev.091553. PubMed PMID: 23715546.
23. Guaraldi G, De Francesco D, Milic J, Franconi I, Mussini C, Falutz J, Cesari M. The Interplay Between Age and Frailty in People Living With HIV: Results From an 11-Year Follow-up Observational Study. Open Forum Infect Dis. 2019;6(5):ofz199. Epub 2019/05/28. doi: 10.1093/ofid/ofz199. PubMed PMID: 31123697; PMCID: PMC6524826.
24. Guaraldi G, Orlando G, Zona S, Menozzi M, Carli F, Garlassi E, Berti A, Rossi E, Roverato A, Palella F. Premature age-related comorbidities among HIV-infected persons compared with the general population. Clin Infect Dis. 2011;53(11):1120-6. Epub 2011/10/15. doi: 10.1093/cid/cir627. PubMed PMID: 21998278.
25. Greene M, Covinsky KE, Valcour V, Miao Y, Madamba J, Lampiris H, Cenzer IS, Martin J, Deeks SG. Geriatric Syndromes in Older HIV-Infected Adults. J Acquir Immune Defic Syndr. 2015;69(2):161-7. Epub 2015/05/27. doi: 10.1097/QAI.0000000000000556. PubMed PMID: 26009828; PMCID: PMC4445476.
26. Cao W, Jamieson BD, Hultin LE, Hultin PM, Effros RB, Detels R. Premature aging of T cells is associated with faster HIV-1 disease progression. J Acquir Immune Defic Syndr. 2009;50(2):137-47. Epub 2009/01/10. doi: 10.1097/QAI.0b013e3181926c28. PubMed PMID: 19131896; PMCID: PMC2767229.
27. Dock JN, Effros RB. Role of CD8 T Cell Replicative Senescence in Human Aging and in HIV-mediated Immunosenescence. Aging Dis. 2011;2(5):382-97. Epub 2012/02/07. PubMed PMID: 22308228; PMCID: PMC3269814.
28. Cohen J, Torres C. HIV-associated cellular senescence: A contributor to accelerated aging. Ageing Res Rev. 2017;36:117-24. Epub 2016/12/27. doi: 10.1016/j.arr.2016.12.004. PubMed PMID: 28017881; PMCID: PMC5584608.
Submitted April 24, 2020 | Accepted May 8, 2020 | Published October 22, 2020
Copyright © 2020 Pathogens and Immunity. This is an open-access article distributed under the terms of the Creative Commons Attribution 4.0 International License.
Supplementary Table 1.
|
Term |
|
|
|
|
Developmental protein |
|
|
|
|
Homeobox, conserved site |
|
|
|
|
Homeobox |
|
|
|
|
Homeodomain |
|
|
|
|
DNA-binding region:Homeobox |
|
|
|
|
HOX |
|
|
|
|
Homeodomain-like |
|
|
|
|
Homeodomain, metazoa |
|
|
|
|
Sequence-specific DNA Binding |
|
|
|
|
Cell adhesion |
|
|
|
|
DNA-binding |
|
|
|
|
Glycoprotein |
|
|
|
|
Glycosylation site:N-linked (GlcNAc...) |
|
|
|
|
Positive regulation of transcription from RNA polymerase II promoter |
|
|
|
|
Domain:Cadherin 5 |
|
|
|
|
Cadherin |
|
|
|
|
Transcription regulation |
|
|
|
|
Cadherin conserved site |
|
|
|
|
Cadherin-like |
|
|
|
|
Domain:Cadherin 1 |
|
|
|
|
Domain:Cadherin 2 |
|
|
|
|
Transcription |
|
|
|
|
Homophilic cell adhesion via plasma membrane adhesion molecules |
|
|
|
|
Domain:Cadherin 3 |
|
|
|
|
Domain:Cadherin 4 |
|
|
|
|
Topological domain:Cytoplasmic |
|
|
|
|
Calcium |
|
|
|
|
Negative regulation of transcription from RNA polymerase II promoter |
|
|
|
|
Cell adhesion |
|
|
|
|
Transcriptional activator activity, RNA polymerase II core promoter proximal region sequence-specific binding |
|
|
|
|
transcription factor activity, sequence-specific DNA binding |
|
|
|
|
CA |
|
|
|
|
Domain:Cadherin 6 |
|
|
|
|
Cadherin, N-terminal |
|
|
|
|
Alternative splicing |
|
|
|
|
Signal peptide |
|
|
|
|
Topological domain:Extracellular |
|
|
|
|
RNA polymerase II core promoter proximal region sequence-specific DNA binding |
|
|
|
|
Neurogenesis |
|
|
|
|
Cell junction |
|
|
|
|
Transcription from RNA polymerase II promoter |
|
|
|
|
Synapse |
|
|
|
|
Compositionally biased region:Poly-Ala |
|
|
|
|
Calcium ion binding |
|
|
|
|
Anterior/posterior pattern specification |
|
|
|
|
Signal |
|
|
|
|
Nervous system development |
|
|
|
|
Cell membrane |
|
|
|
|
Synapse |
|
|
|
Supplementary Table 2.
|
|
|
|
|
cg13122498 |
0.774737673 |
BTBD9;BTBD9;BTBD9 |
|
cg08418670 |
0.760519061 |
SH3GL1 |
|
cg07141605 |
0.732497633 |
|
|
cg08782022 |
0.72872463 |
MGRN1;MGRN1;MGRN1;MGRN1 |
|
cg15401418 |
0.72387172 |
SEPT9;SEPT9;SEPT9;SEPT9 |
|
cg07804973 |
0.692108311 |
TFDP1;TFDP1 |
|
cg01785719 |
0.67539606 |
TSNARE1 |
|
cg02097604 |
0.666707573 |
TOM1L2;TOM1L2 |
|
cg19628469 |
0.666440823 |
ELANE |
|
cg10953317 |
0.662354955 |
CD300A |
|
cg07159958 |
0.660151102 |
ATL1;ATL1;ATL1 |
|
cg24138325 |
0.643920669 |
ARHGEF10 |
|
cg03071500 |
0.643656651 |
|
|
cg14191616 |
0.635103246 |
SH3RF3 |
|
cg10979567 |
0.632899349 |
COL6A3;COL6A3;COL6A3 |
|
cg01528913 |
0.624226268 |
|
|
cg13492600 |
0.622277247 |
RFX2;RFX2 |
|
cg18769421 |
0.613724466 |
COBRA1 |
|
cg20102280 |
0.61211928 |
HTR2A;HTR2A |
|
cg03773198 |
0.611724352 |
FHAD1 |
|
cg03916490 |
0.609177299 |
C7orf50;C7orf50;C7orf50 |
|
cg24079038 |
0.608562626 |
KCNQ1 |
|
cg10317778 |
0.601817618 |
|
|
cg00499781 |
0.601026822 |
A2BP1;A2BP1;A2BP1;A2BP1;A2BP1;A2BP1 |
|
cg02893779 |
0.595505185 |
SETD3;SETD3 |
|
cg24591969 |
0.595489187 |
KCNAB2;KCNAB2 |
|
cg23476885 |
0.591684881 |
MCCC1 |
|
cg27554875 |
0.591113665 |
ZCCHC5 |
|
cg23096377 |
0.587538299 |
C7orf50;C7orf50;C7orf50 |
|
cg26058778 |
0.585351093 |
|
|
cg12059309 |
0.58505386 |
CNOT2 |
|
cg10258241 |
0.575100154 |
|
|
cg15464485 |
0.574893617 |
C7orf50;C7orf50;C7orf50 |
|
cg11282828 |
0.574560752 |
|
|
cg08702344 |
0.568745676 |
CLDN12 |
|
cg23238058 |
0.561738011 |
|
|
cg18709570 |
0.556136406 |
|
|
cg03978067 |
0.550097998 |
EEF1D;EEF1D;EEF1D;EEF1D;EEF1D;EEF1D;EEF1D |
|
cg05315334 |
0.549314772 |
MCF2L;MCF2L |
|
cg07083806 |
0.547327562 |
MYCN;MYCNOS |
|
cg00124375 |
0.543421721 |
DDAH2 |
|
cg03848483 |
0.541210415 |
|
|
cg09329826 |
0.538461625 |
PDZD4 |
|
cg24536250 |
0.534971915 |
|
|
cg01620164 |
0.534936861 |
FIGN |
|
cg17360854 |
0.534425664 |
RBMS1;RBMS1 |
|
cg14249520 |
0.532872377 |
CPT1A;CPT1A |
|
cg09422696 |
0.532780782 |
|
|
cg20409752 |
0.531258247 |
CAMTA1 |
|
cg24697097 |
0.530702267 |
|
|
cg22708738 |
0.529329286 |
FUZ |
|
cg05648303 |
0.518800369 |
SCOC;SCOC;SCOC;SCOC;SCOC |
|
cg03075605 |
0.514322979 |
JRKL;JRKL;CCDC82 |
|
cg00236832 |
0.49687569 |
RARA;RARA |
|
cg14181940 |
0.487635848 |
CD300A |
|
cg26988138 |
0.485510319 |
GNG7 |
|
cg03130891 |
0.483769664 |
|
|
cg13989519 |
0.483267333 |
TSPAN18 |
|
cg04910877 |
0.477383373 |
CBFA2T3;CBFA2T3 |
|
cg23052855 |
0.475060162 |
ZDHHC19 |
|
cg04705659 |
0.469605512 |
PLEKHA6 |
|
cg26802063 |
0.463863482 |
ARSB;ARSB;ARSB |
|
cg23889772 |
0.463786601 |
COL5A3 |
|
cg25875683 |
0.452337816 |
PLXNB3;PLXNB3;PLXNB3;PLXNB3 |
|
cg05513908 |
0.438472341 |
C22orf36;GGT1 |
|
cg06873401 |
0.432684492 |
LHFPL2 |
|
cg05656566 |
0.432667807 |
ADAMTS2;ADAMTS2 |
|
cg19544767 |
0.43188012 |
|
|
cg22504140 |
0.424587486 |
|
|
cg21786191 |
0.423815267 |
ZADH2 |
|
cg06654691 |
0.423231877 |
PLEKHH3 |
|
cg05085169 |
0.41836259 |
OGFR |
|
cg03079733 |
0.415564378 |
RIPK4 |
|
cg00186529 |
0.415220033 |
|
|
cg19092368 |
0.383563039 |
CTPS |
|
cg05105330 |
0.363560798 |
KIAA0513 |
|
cg25013753 |
0.360060327 |
ARHGAP22 |
|
cg14781919 |
0.355498045 |
ITGAE;GSG2 |
|
cg23664926 |
0.354744948 |
|
|
cg03589751 |
0.327483304 |
KIAA1199;MIR549 |
|
cg10772532 |
0.319667132 |
C14orf145;C14orf145 |
|
cg18553732 |
0.305635755 |
CHKA;CHKA |