1Anjana Yadav, 3Andrew V. Kossenkov, 1Vincent R. Knecht, 3Louise C. Showe, 2Sarah J. Ratcliffe, 3Luis J. Montaner, 1Pablo Tebas, 1Ronald G. Collman
1
Department of Medicine; University of Pennsylvania Perelman School of
Medicine; Philadelphia, Pennsylvania
2
Department of Biostatistics and Epidemiology; University of Pennsylvania
Perelman School of Medicine; Philadelphia, Pennsylvania
3
The Wistar Institute; Philadelphia, Pennsylvania
Ronald Collman
522 Johnson Pavilion
3610 Hamilton Walk
University of Pennsylvania School of Medicine
Philadelphia, PA 19104
collmanr@pennmedicine.upenn.edu
215-898-0913
Background: People living with HIV on antiretroviral therapy (HIV/ART) experience excess non-AIDS comorbidities, and also remain at increased risk for certain infections and viral malignancies. Monocytes/macrophages are central to many of these comorbidities, and elevated plasma cytokines and immune activation during untreated infection are often incompletely reversed by ART and are also associated with comorbidities.
Methods: We investigated monocyte surface markers, gene expression, and plasma cytokines in 11 HIV-infected older individuals (median 53 years) who started therapy with low CD4 counts (median 129 cells/μl), with elevated hsCRP (≥ 2mg/L) despite long-term ART (median 7.4 years), along with matched controls.
Results: Frequency of monocyte subsets (based on CD14/CD16/CD163), were not different from controls, but surface expression of CD163 was increased (P = 0.021) while PD1 was decreased (P = 0.013) along with a trend for higher tissue factor (P = 0.096). As a group, HIV/ART participants had elevated plasma CCL2 (MCP-1; P = 0.0001), CXCL9 (MIG; P = 0.04), and sIL2R (P = 0.015), which were correlated, while sCD14 was not elevated. Principal component analysis of soluble markers revealed that 6/11 HIV/ART participants clustered with controls, while 5 formed a distinct group, driven by IL-10, CCL11, CXCL10, CCL2, CXCL9, and sIL2R. These individuals were significantly older than those clustering with controls. Transcriptomic analysis revealed multiple genes linked to immune functions including inflammation, immune cell development, and cell-cell signaling that were downregulated in HIV/ART monocytes and distinct from patterns in untreated subjects.
Conclusions: Long-term ART-treated individuals normalize monocyte subsets but exhibit immune dysregulation involving both aberrant inflammation and monocyte dysfunction, as well as inter-individual heterogeneity, suggesting complex mechanisms linking monocytes and HIV/ART comorbidities.
Keywords: HIV/AIDS; Antiretroviral therapy; Monocyte; Gene expression; Cytokine; Inflammation
Antiretroviral therapy (ART) can suppress virus replication, extend lifespan, and improve quality of life for people living with HIV but does not completely eliminate chronic immune activation and inflammation [1, 2]. The principal causes of morbidity and death for people with HIV in the US has now shifted from AIDS-related opportunistic infections to chronic diseases and non-AIDS complications, including HIV-associated neurocognitive disorders (HAND), cardiovascular disease (CVD), non-AIDS cancers, and bone and metabolic disorders, among others. These serious non-AIDS events (SNAEs) in HIV/ART individuals are associated with, and are believed to be driven in large part by persistent chronic inflammation [3]. At the same time, these individuals remain at elevated risk for certain infections such as tuberculosis and for virally-induced cancers [4-6].
Monocytes and macrophages are key components of chronic inflammation in ART-treated HIV infection, and both cellular and soluble myeloid-associated markers have been linked to development of HAND, CVD, and other SNAEs [7-10]. In HAND, persistent neuroinflammation is linked to the accumulation of activated macrophages in the CNS, which results from emigration of monocytes trafficking from the blood [11, 12]. This mechanism is supported by elevated levels of IL-6, IL-8, IFN-γ, and sCD14 in plasma, and of CCL2 (MCP-1) and CXCL10 in the CNS. The latter chemokines have been shown to be involved in monocyte chemotaxis in ART-treated HIV infected individuals with HAND [13, 14]. Similarly, a monocyte/macrophage role in CVD is supported by biomarker data in ART-treated individuals, including elevated sCD14, CCL2, IL-6, and other plasma biomarkers [13, 15-17]. The impact of ART treatment on monocyte CD16+ populations is less clear, with some studies reporting persistent elevated expression, but others reporting normalization [18-22]. Importantly, both residual inflammation and comorbidities such as HAND are most common in those who begin ART at low CD4+ T counts and in older individuals [23, 24]
To better understand the nature of residual monocyte dysfunction and its relationship to persistent immune activation in ART-suppressed individuals, we investigated monocyte surface marker phenotypes, monocyte gene expression patterns, and plasma biomarkers in HIV/ART subjects. We selected aviremic HIV+ individuals without clinical neurocognitive, cardiovascular, or inflammatory diseases, but with elevated hsCRP (≥ 2 mg/L) as a marker of inflammation despite long-term ART treatment (median 7.4 years). To study the group most at risk for SNAEs, we recruited subjects who began ART with advanced disease (median CD4 of 129 cells/μl at time of ART initiation) and a median age of 53. Healthy controls were matched for age, race, gender, and smoking status. Results of this study highlight the continued dysregulation of myeloid cells, and have implication for immune activation, inflammation, and suboptimal recovery of immune function.
HIV+ ART-treated participants (Table 1) were recruited based on nadir CD4 count ≤ 350 cells/μl, HIV-1 RNA ≤ 200 copies/ml for ≥ 6 months, and plasma hsCRP ≥ 2mg/L. Participants were required to be on a stable ART regimen for at least 4 weeks before enrollment, and were excluded based on any known inflammatory conditions, hepatitis C infection, clinical cardiovascular or coronary artery disease, hyperlipidemia or use of statin drugs, use of any prescription anti-inflammatory drugs, or non-steroidal anti-inflammatory drug use on a regular basis. Healthy HIV-negative controls with the same exclusion criteria were matched for race, gender, age (+/- 5 years), and smoking status. All participants provided written informed consent under protocol #815512 approved by the University of Pennsylvania Institutional Review Board.
Table 1. Subjects enrolled in the study.
|
|
|
|
|
|
|
|
|
|
|
|
|
|
|
|
|
|
|
|
|
|
|
|
|
|
|
|
|
|
|
|
|
|
|
|
|
|
|
|
|
|
|
|
|
|
|
|
|
|
|
|
|
|
|
|
|
|
|
|
|
|
|
|
|
|
|
|
|
|
|
|
|
|
|
|
|
|
|
|
|
|
|
|
|
|
|
|
|
|
|
|
|
|
|
|
|
|
|
|
|
|
|
|
|
|
|
|
|
|
|
|
|
|
|
|
|
|
|
|
|
|
|
|
|
|
|
|
|
|
|
|
|
|
|
|
|
|
|
|
|
|
|
|
|
|
|
|
|
|
|
|
|
|
|
|
|
|
|
|
|
|
|
|
|
|
|
|
|
|
|
|
|
|
|
|
|
|
|
|
|
|
|
|
|
|
|
|
|
|
|
|
|
|
|
|
|
|
|
|
|
|
|
|
|
|
|
|
|
|
|
|
|
|
|
|
|
|
|
|
|
|
|
|
|
|
|
|
|
|
|
|
|
|
|
|
|
|
|
|
|
|
|
|
|
|
|
|
|
|
|
|
|
Blood was collected in EDTA tubes and processed within 3 hrs. Plasma was separated and stored at -80oC for ELISA and bead-based multiplex assays. PBMCs were separated by Ficoll-gradient centrifugation followed by purification of CD14+ monocytes by negative selection with antibody-conjugated magnetic beads according to the manufacturer’s instructions (Miltenyi Biotech).
For analysis of cell surface antigens, fresh whole blood was stained with a cocktail of antibodies that included CD14-Pacific Blue, CD16-Apc-Cy7, CD163-PerCpCy5-5, CD3-BV570, CD4-PeCy5, CD8-PeTexRed, CX3CR1-FITC, CCR2-Pe, CD38-PeCy7, CD142-Pe, PD1-PeCy7, and PD-L1-APC. Briefly, the antibody cocktail was added to 100μl of whole blood, vortexed gently, and incubated in the dark at room temperature for 20 minutes. Next, 2ml of RBC lysing buffer was added, vortexed, and incubated for 10 minutes in the dark at room temperature. Cells were centrifuged at 500g for 5 minutes to remove the supernatant, washed twice in 2ml of FACS buffer, and suspended in 2% paraformaldehyde and stored at 4oC until acquisition. FACS data were acquired on a modified LSRII (BD Immunocytometry Systems) and analyzed using FlowJo (TreeStar) software. For each stain, an FMO (fluorescence-minus-one) tube was included as a control to establish gating. Gating strategy is shown in Supplementary Figure 1.
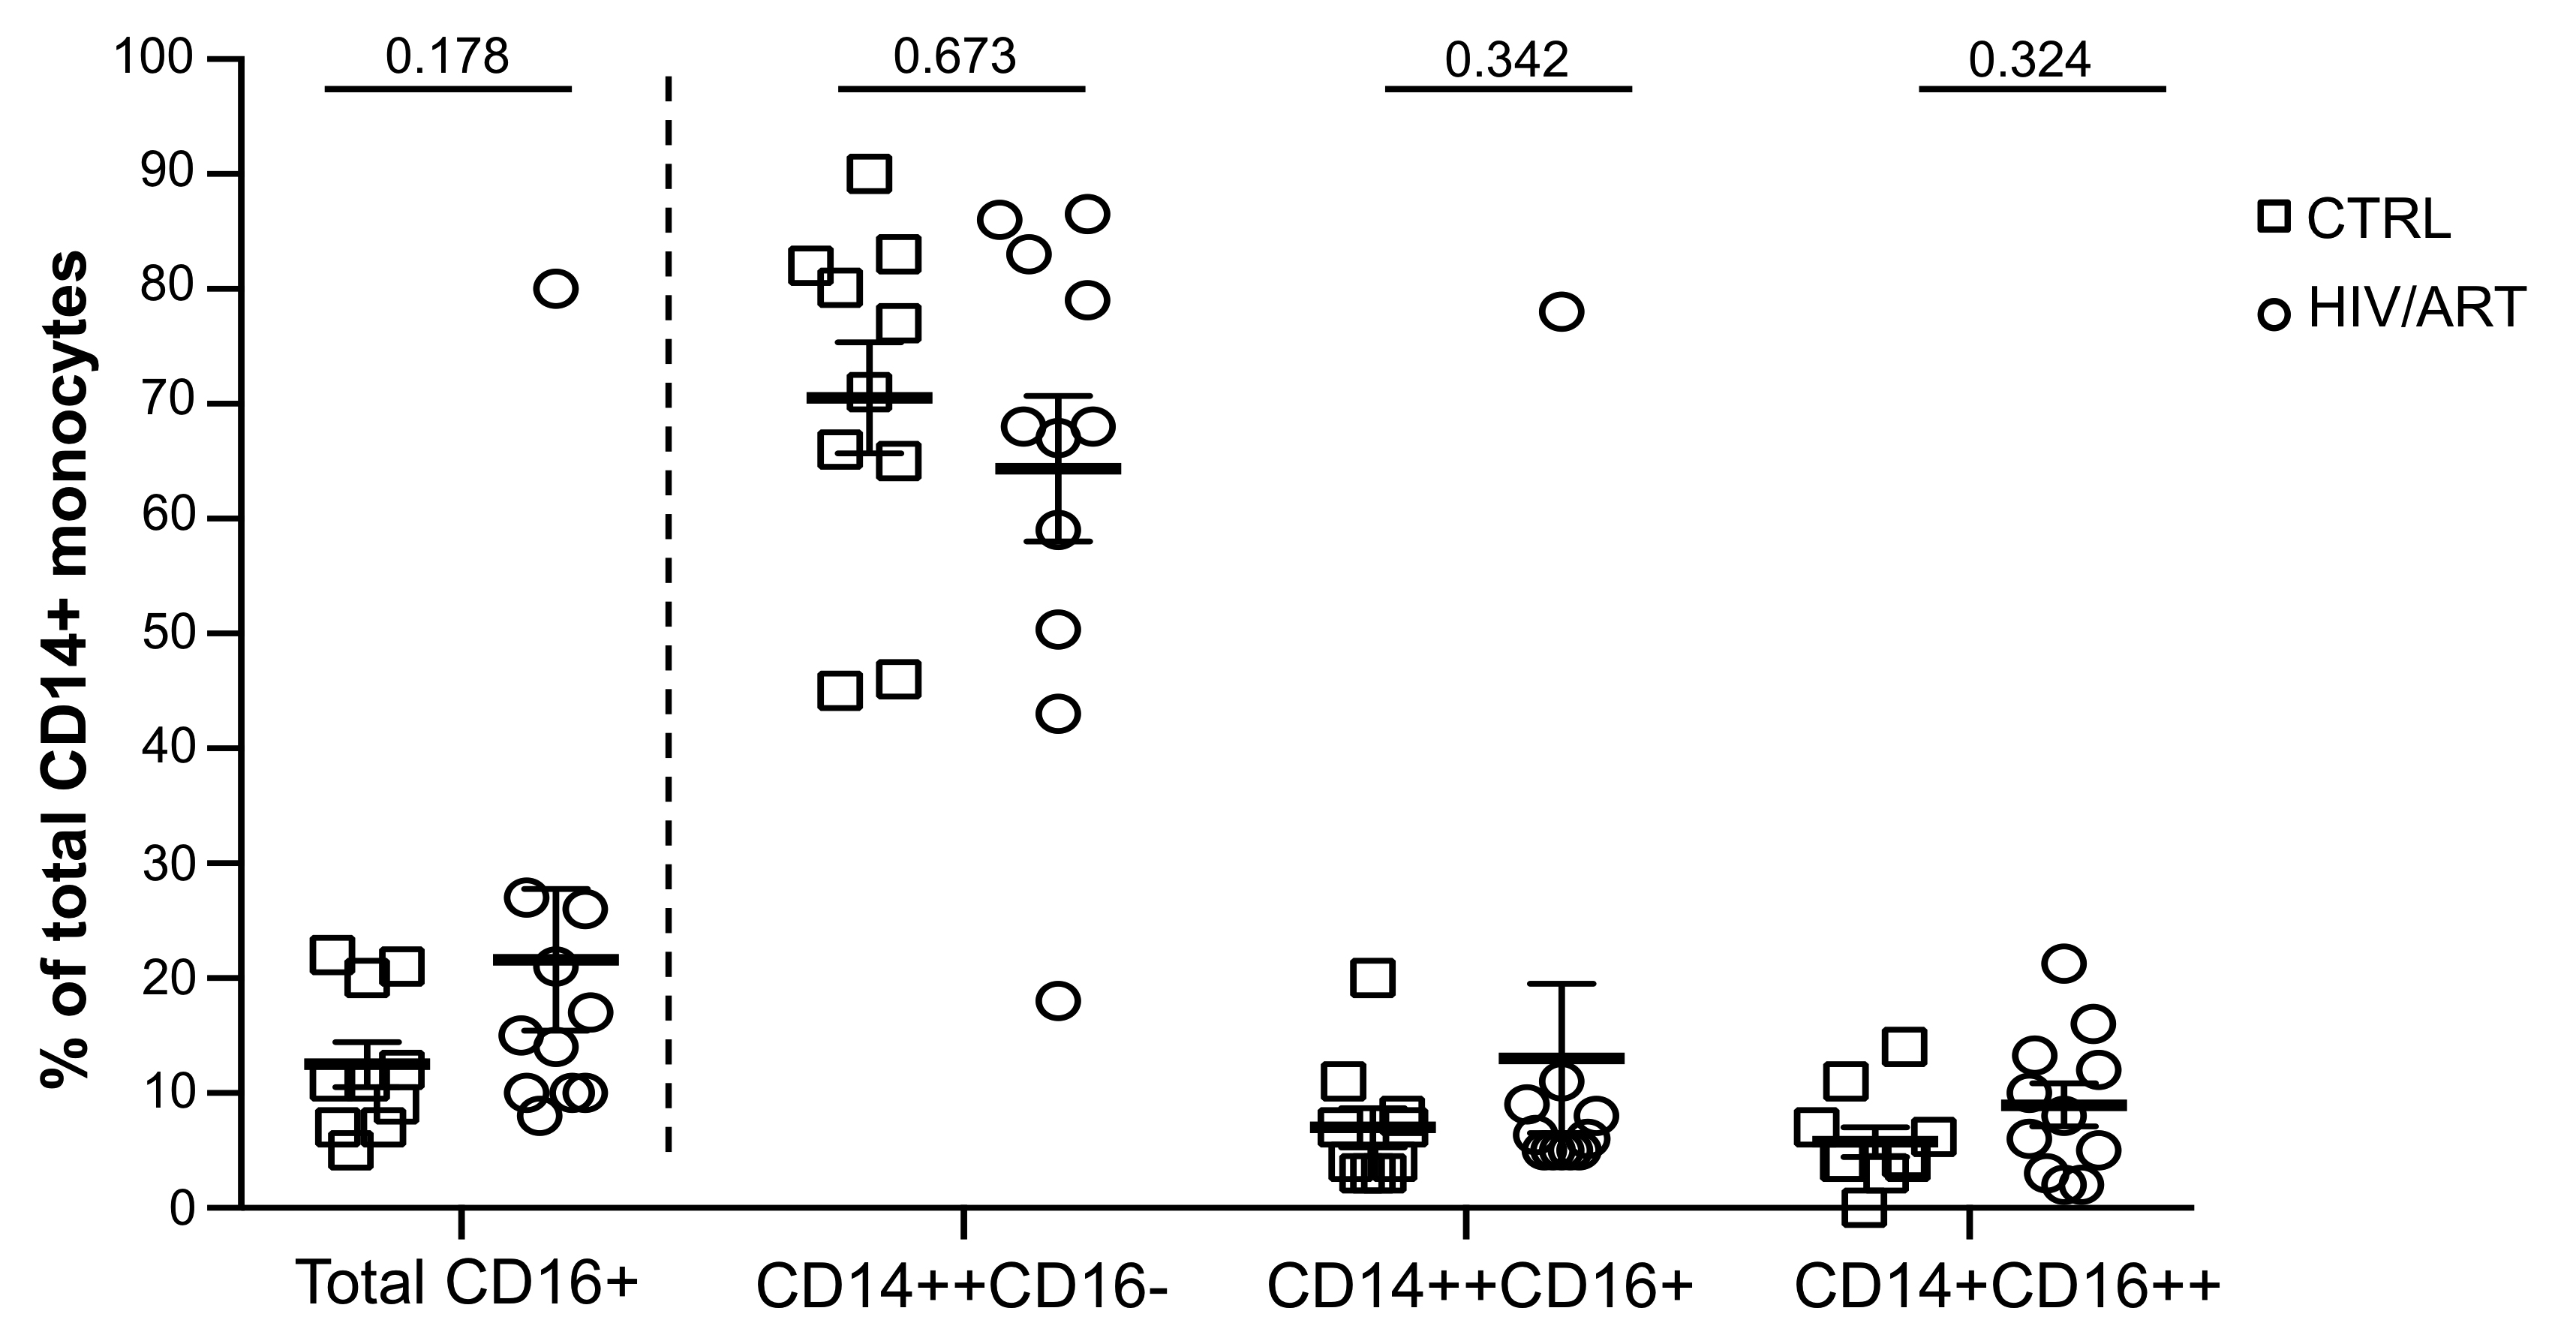
Figure 1. Proportion of monocyte subsets in HIV/ART individuals is similar to HIV-negative controls. Freshly isolated PBMCs from HIV+ and HIV- individuals were stained for monocyte surface markers and analyzed by flow cytometry. Monocyte subsets based on CD14 and CD16 surface marker expression in HIV/ART versus matched HIV-negative control individuals is shown. Results are expressed as mean ± SE; P value calculated using unpaired Mann Whitney U-test.
Levels of sCD14 and sCD163 were measured in plasma by ELISA (R&D). Plasma LBP (LPS binding protein) was also measured by ELISA (Cell Sciences). All other cytokines and chemokines were measured using the Luminex multiplex human cytokine assay kit (catalog no: LHC0009, Invitrogen).
Total RNA was isolated from purified monocytes using the Qiagen DNA/RNA mini kit (catalog no. 80204). RNA quality was assayed by Eukaryote total RNA nano Bioanalyzer (Agilent) assay, and all RNA used had an RNA Integrity number (RIN) > 7. RNA (100ng) was amplified with Epicentre TargetAmp Nano-g Biotin-aRNA Labeling Kit to generate biotinylated amplified RNA. Biotin labeled aRNA (750ng) was hybridized to the Illumina HumanHT-12V4 expression Beadchip following the manufacturer’s instructions. Illumina GenomeStudio software was used to export expression levels and determination of P-values for each probe of each sample. Signal intensity data was quantile normalized, and probes that showed non-significant detection P-value (P > 0.05) in all samples were removed from further analysis, resulting in a set of 29,208 probes (20,464 unique genes). Microarray data is available on GEO (https://www.ncbi.nlm.nih.gov/geo) using accession GSE137438.
Gene expression levels between the HIV/ART and control groups were compared using two sample SAM test [25]. FDR<20% was used as a significance threshold for general enrichment analysis, and FDR < 10% with fold > 1.5 enrichment threshold was used to report the most significantly changed genes. Gene set enrichment analysis for biological functions and pathways was done using Ingenuity Pathway Analysis (IPA) software (Qiagen) using “Canonical Pathways” and “Disease and Functions” options. Results that passed the P < 0.01 threshold with significant predicted activation state (Z-score of at least 2) were reported. Database for Annotation Visualization and Integrated Discovery (DAVID) analysis was performed to find genes having known HIV interaction [26]. Additional enrichment analysis was done using GSEA [27] on genes pre-ranked by SAM significance estimation without using direction of change and using 1000 permutations to find significantly associated pathways (MSigDB set C2) with FDR < 25% used for significance threshold.
Quantitative real-time PCR was carried out for selected genes from microarray data based on fold change. Monocyte RNA was purified using the RNeasy Plus Mini Kit (Qiagen) following the manufacturers’ instructions. cDNA was prepared using the High-Capacity cDNA Reverse Transcription Kit (Applied Biosystems). Real-time PCR was carried out on an ABI 7500 Fast Real-Time PCR system using SYBR Select Master Mix (Applied Biosystems). Gene targets and primers used were: CD247 5'-TGCTGGATGGAATCCTCTTC-3' and 3'-CCGCCATCTTATCTTTCTGC-5'; IL2RB 5'-GCTGATCAACTGCAGGAACA-3' and 3'-TGTCCCTCTTCCAGCACTTCT-5'; KIR3DL1 5'-CAAGCTCCAAATCTGGTAACCC-3' and 3'-CCAACTGTGCGTATGTCACC-5'; KIR3DL2 5'-AGGGCCCCTGCTGAAATC-3' and 3'-GCTCAAACATGACATCTGACCAA-5'; and housekeeping gene targets: IPO8 5'-GCTCTGATAACTGTGCAG-3' and 3'-CAGTGTGTACACCTCCTG-5'; GAPDH 5'-GGTGGTCTCCTCTGACTTCAACA-3' and 3'-CCAGCCACATACCAGGAAATG-5'. Each PCR reaction was performed using 2.5μl of cDNA and forward and reverse primers each at 200nm final concentration, 20μl reaction volumes. No-template and no-RT controls were run in parallel for each gene and each sample. Cycling parameters were: 50oC for 2 minutes, 95oC for 10 minutes, then 40 cycles of 94oC for 30 seconds, 58oC for 30 seconds, and 72oC for 45 seconds, and one cycle at 72oC for 3 minutes. Melt curve analysis steps were 95oC for 15 seconds, 60oC for 20 seconds and 95oC for 15 seconds. Gene expression was calculated by the 2-∆CT method [28] based on relative expression compared to internal control IPO8.
Statistical evaluations of monocyte surface and plasma markers were carried out using the non-parametric-unpaired Mann-Whitney test, and a P value of < 0.05 was considered to be significant. Results are expressed as mean ± standard error of mean (SEM). Correlation analysis was carried out using the Spearman correlation test. Principal component analysis (PCA) of plasma cytokines and chemokines was carried out using R-Studio statistical software.
Eleven ART-suppressed HIV+ participants (HIV/ART) and 11 HIV- controls matched for age (± 5 years), race, sex, and smoking status were enrolled (Table 1). In each group, 73% of the subjects were male and 91% were African American. Participants had a median age of 53 years and 51 years in the HIV+ and control groups, respectively. To focus on individuals at high risk of SNAEs, HIV+ participants were required to have nadir CD4 counts < 350 cells/μl (median 129 cells/μl; range, 24-233), and at enrollment they had a median CD4 count of 529 cells/μl (range, 342-1062). Participants were on ART for a mean of 7.4 years and virally suppressed with all HIV-1 viral load levels < 200 for 6 months prior to entry and below the lower level of quantitation (< 20 copies/ml) at enrollment. One-fifth of the participants in each group were smokers.
There are conflicting reports regarding the impact ART on monocytes [20, 22, 29]. Therefore, weinvestigated the proportion of monocyte subsets in these long-term-treated but high-SNAE-risk individuals based on CD14 and CD16 surface expression (Figure 1), as CD16+ monocytes have been most frequently associated with inflammatory conditions such as HAND and CVS disease [22, 30]. We compared the classical (CD14++CD16-), intermediate (CD14++CD16+) and non-classical (CD14+CD16++) monocyte subsets [31, 32] in freshly drawn whole blood (Figure 1 and Supplementary Figure 1). The proportion of total CD16+ monocytes was modestly but not significantly higher in HIV/ART than in control subjects (P = 0.178). There were no significant differences in the proportion of CD14++CD16+, CD14+CD16++, or CD14++CD16- monocyte subsets.
We then examined expression of monocyte surface molecules that have been reported to be elevated in HIV infection, particularly CD163, CD16+CD163+ co-expression, and CCR2, the receptor for CCL2/MCP-1 that plays a central role in monocyte recruitment into tissues [33]. We also examined tissue factor (TF), CX3CR1, PDL1, PD1, and CD38, which have also been reported to be dysregulated in monocytes [20, 22, 34-36]. As shown in Figure 2A, HIV/ART participants and healthy controls were not significantly different in the proportions of monocytes expressing these markers. We then investigated expression levels based on mean fluorescence intensity (Figure 2B). Although the proportion of CD163+ monocytes was not different between groups (Figure 2A), CD163 expression based on MFI was significantly greater in HIV/ART participants (P = 0.02). TF was also expressed at a modestly higher level on HIV+ compared to control monocytes, although this did not reach significance (P = 0.096). By contrast, expression of PD1 was significantly lower on HIV/ART monocytes (P = 0.013). The percent TF+ monocytes showed an inverse association with nadir CD4 count that was borderline significant (P = 0.057: Spearman correlation), whereas no other monocyte markers were associated with clinical or demographic features (data not shown).
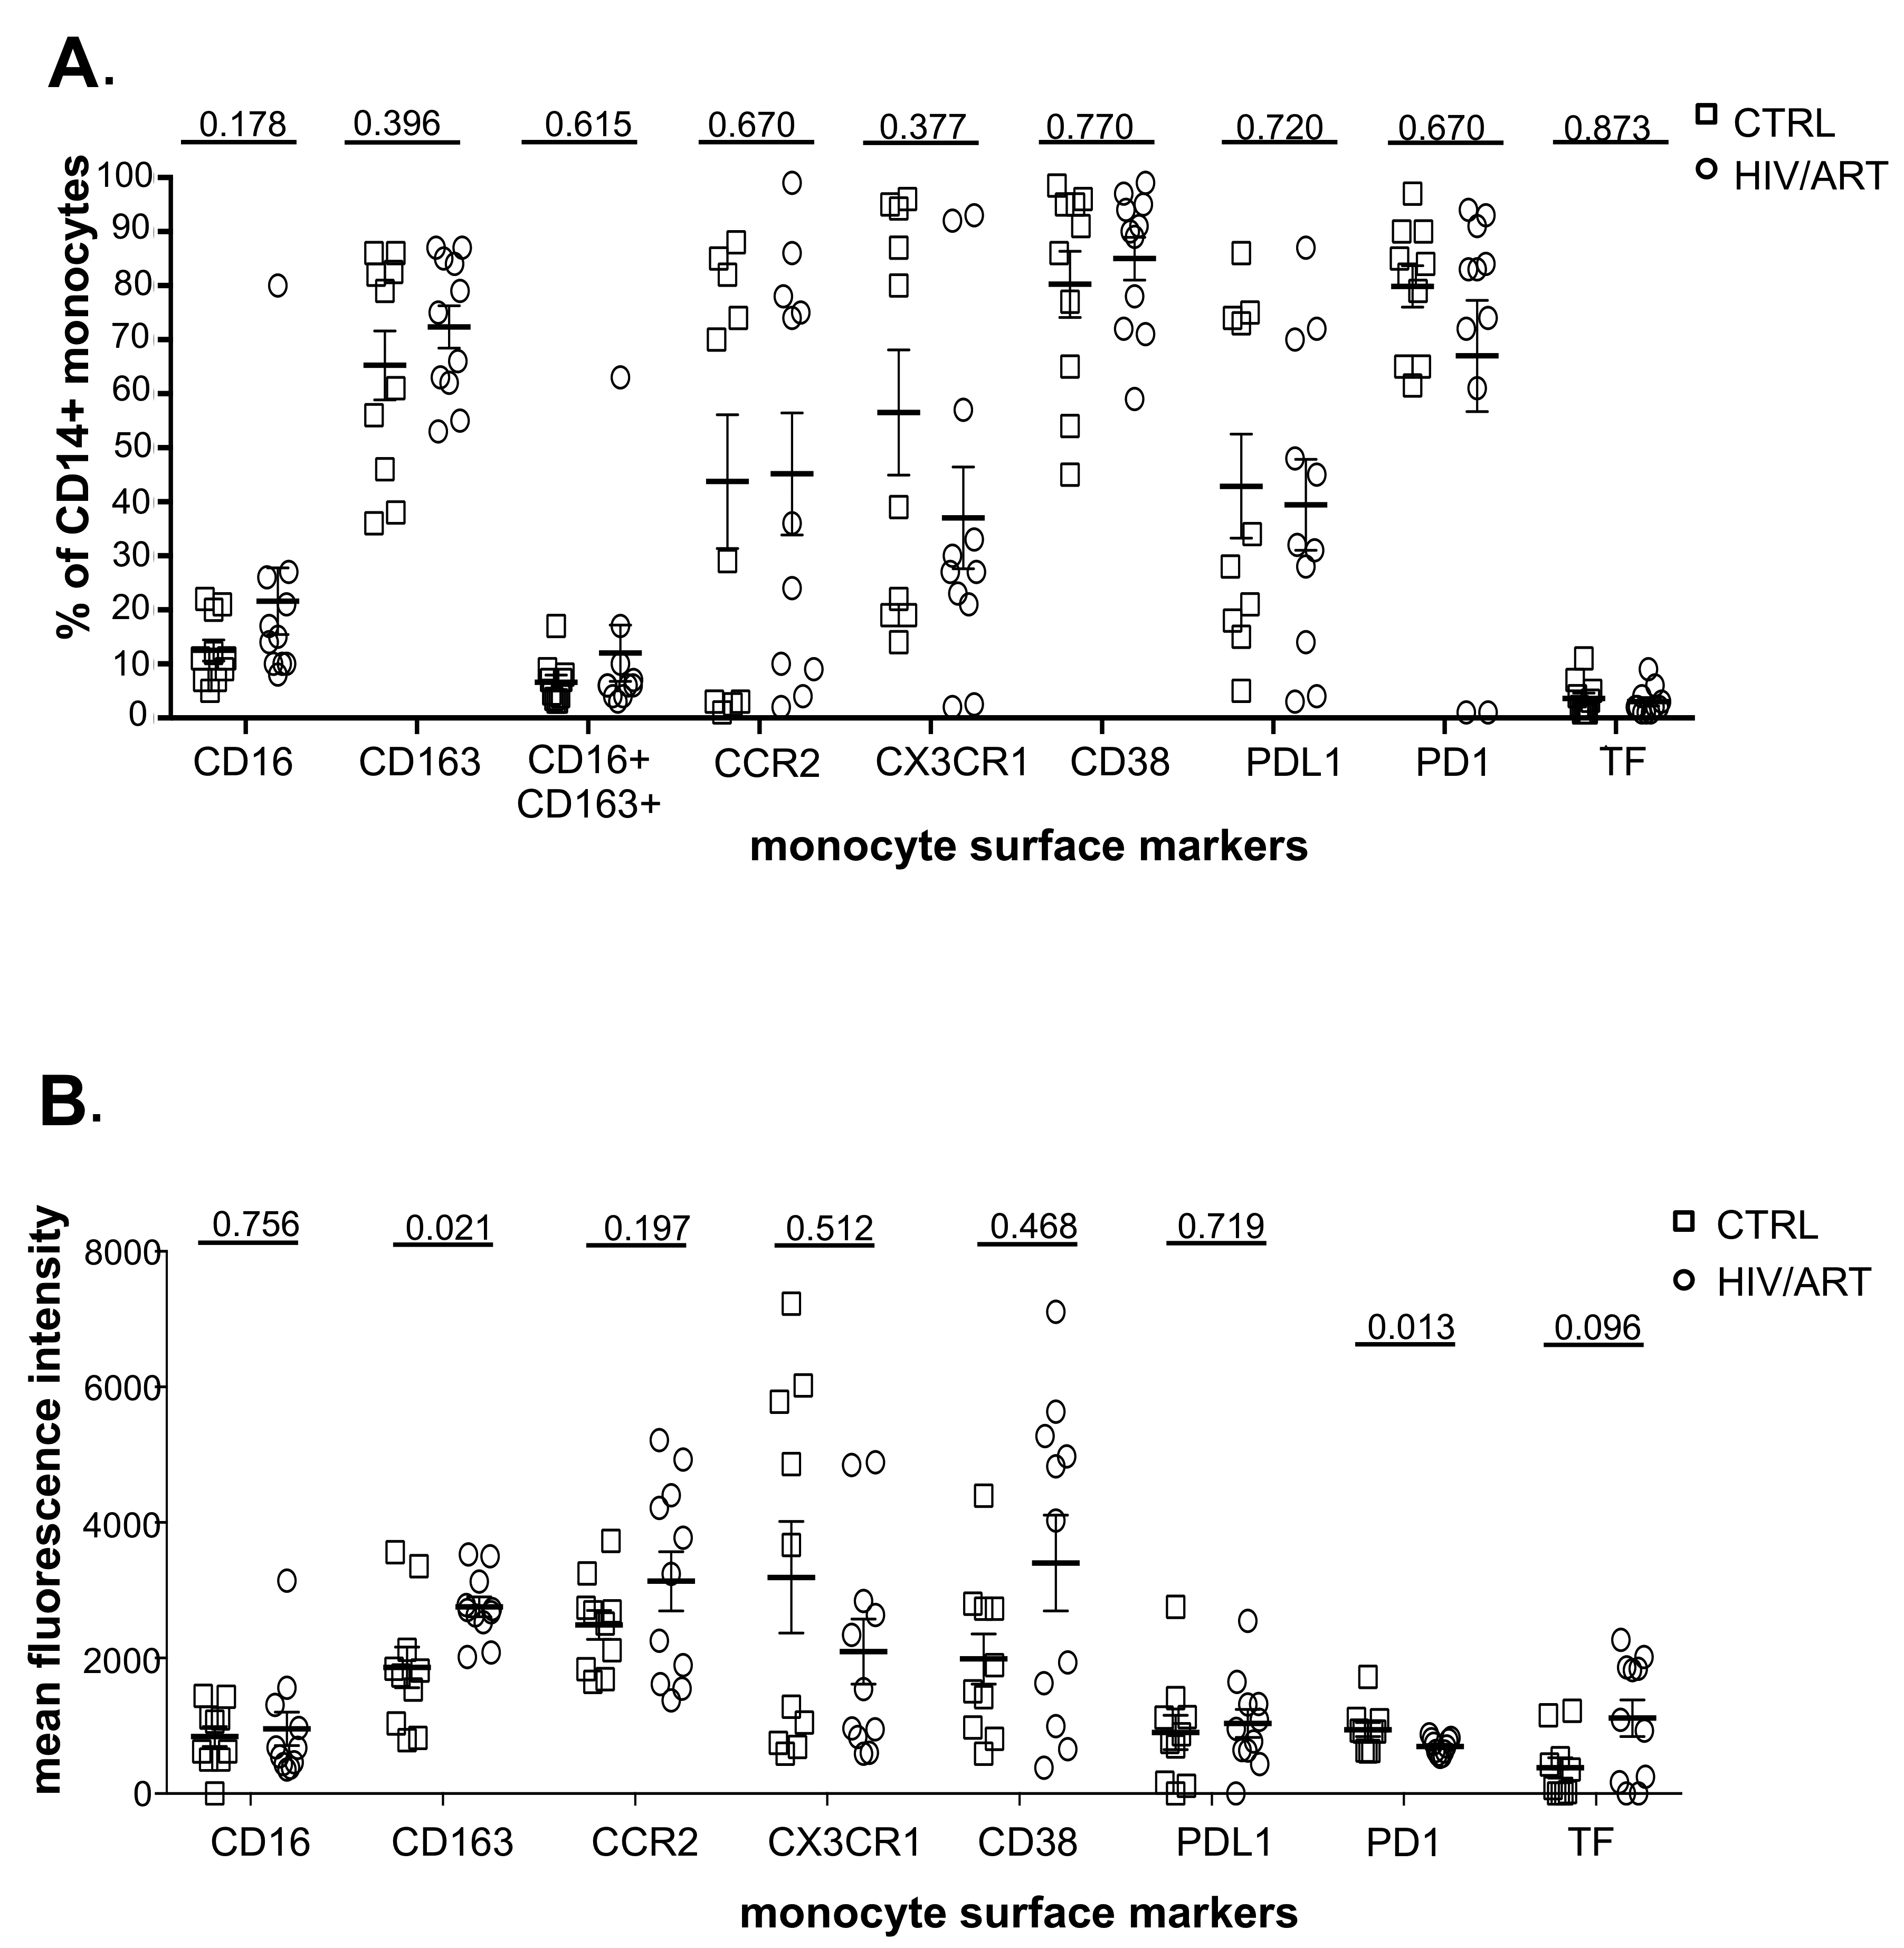
Figure 2. Proportion and density (MFI) of monocytes expressing surface markers associated with immune activation. (A) Percentage of CD14+ monocytes expressing monocyte activation-associated markers and (B) Mean fluorescence intensity of marker expression in freshly isolated monocytes from virally suppressed HIV/ART participants and matched HIV-negative controls. Results are expressed as mean ± SE. P value is calculated using unpaired Mann Whitney U-test.
We then asked whether surface marker expression might differ between HIV/ART and control participants specifically within individual monocyte subsets (Supplementary Figures 3 and 4). While there was no difference in the proportion expressing any of the tested markers in monocytes as a whole (Figure 2A), there was a trend toward decreased CX3CR1+ monocytes in HIV/ART classical and intermediate subsets (P = 0.074 and 0.08, respectively; Supplementary Figure 3). There were also reductions in the HIV/ART group in CD38+ and PD1+ non-classical monocytes (P = 0.058 and P = 0.045, respectively), though not in the classical and intermediate subsets. For level of expression based on MFI, which showed significantly greater CD163 and lower PD1 and a trend toward higher TF in the HIV/ART monocytes as a whole (Figure 2B), we saw that these differences were particularly pronounced in specific monocyte subsets (Supplementary Figure 4). CD163 expression was increased only in intermediate and non-classical monocytes (P = 0.0008 and 0.006, respectively), a trend toward higher TF expression was seen particularly in the classical monocytes (P = 0.07), whereas PD1 showed a trend toward lower expression mainly in the intermediate and non-classical monocytes (P = 0.072 for both subsets). In addition, there was significantly lower CD38 expression in HIV/ART monocytes only in the non-classical monocyte subset (P = 0.034).
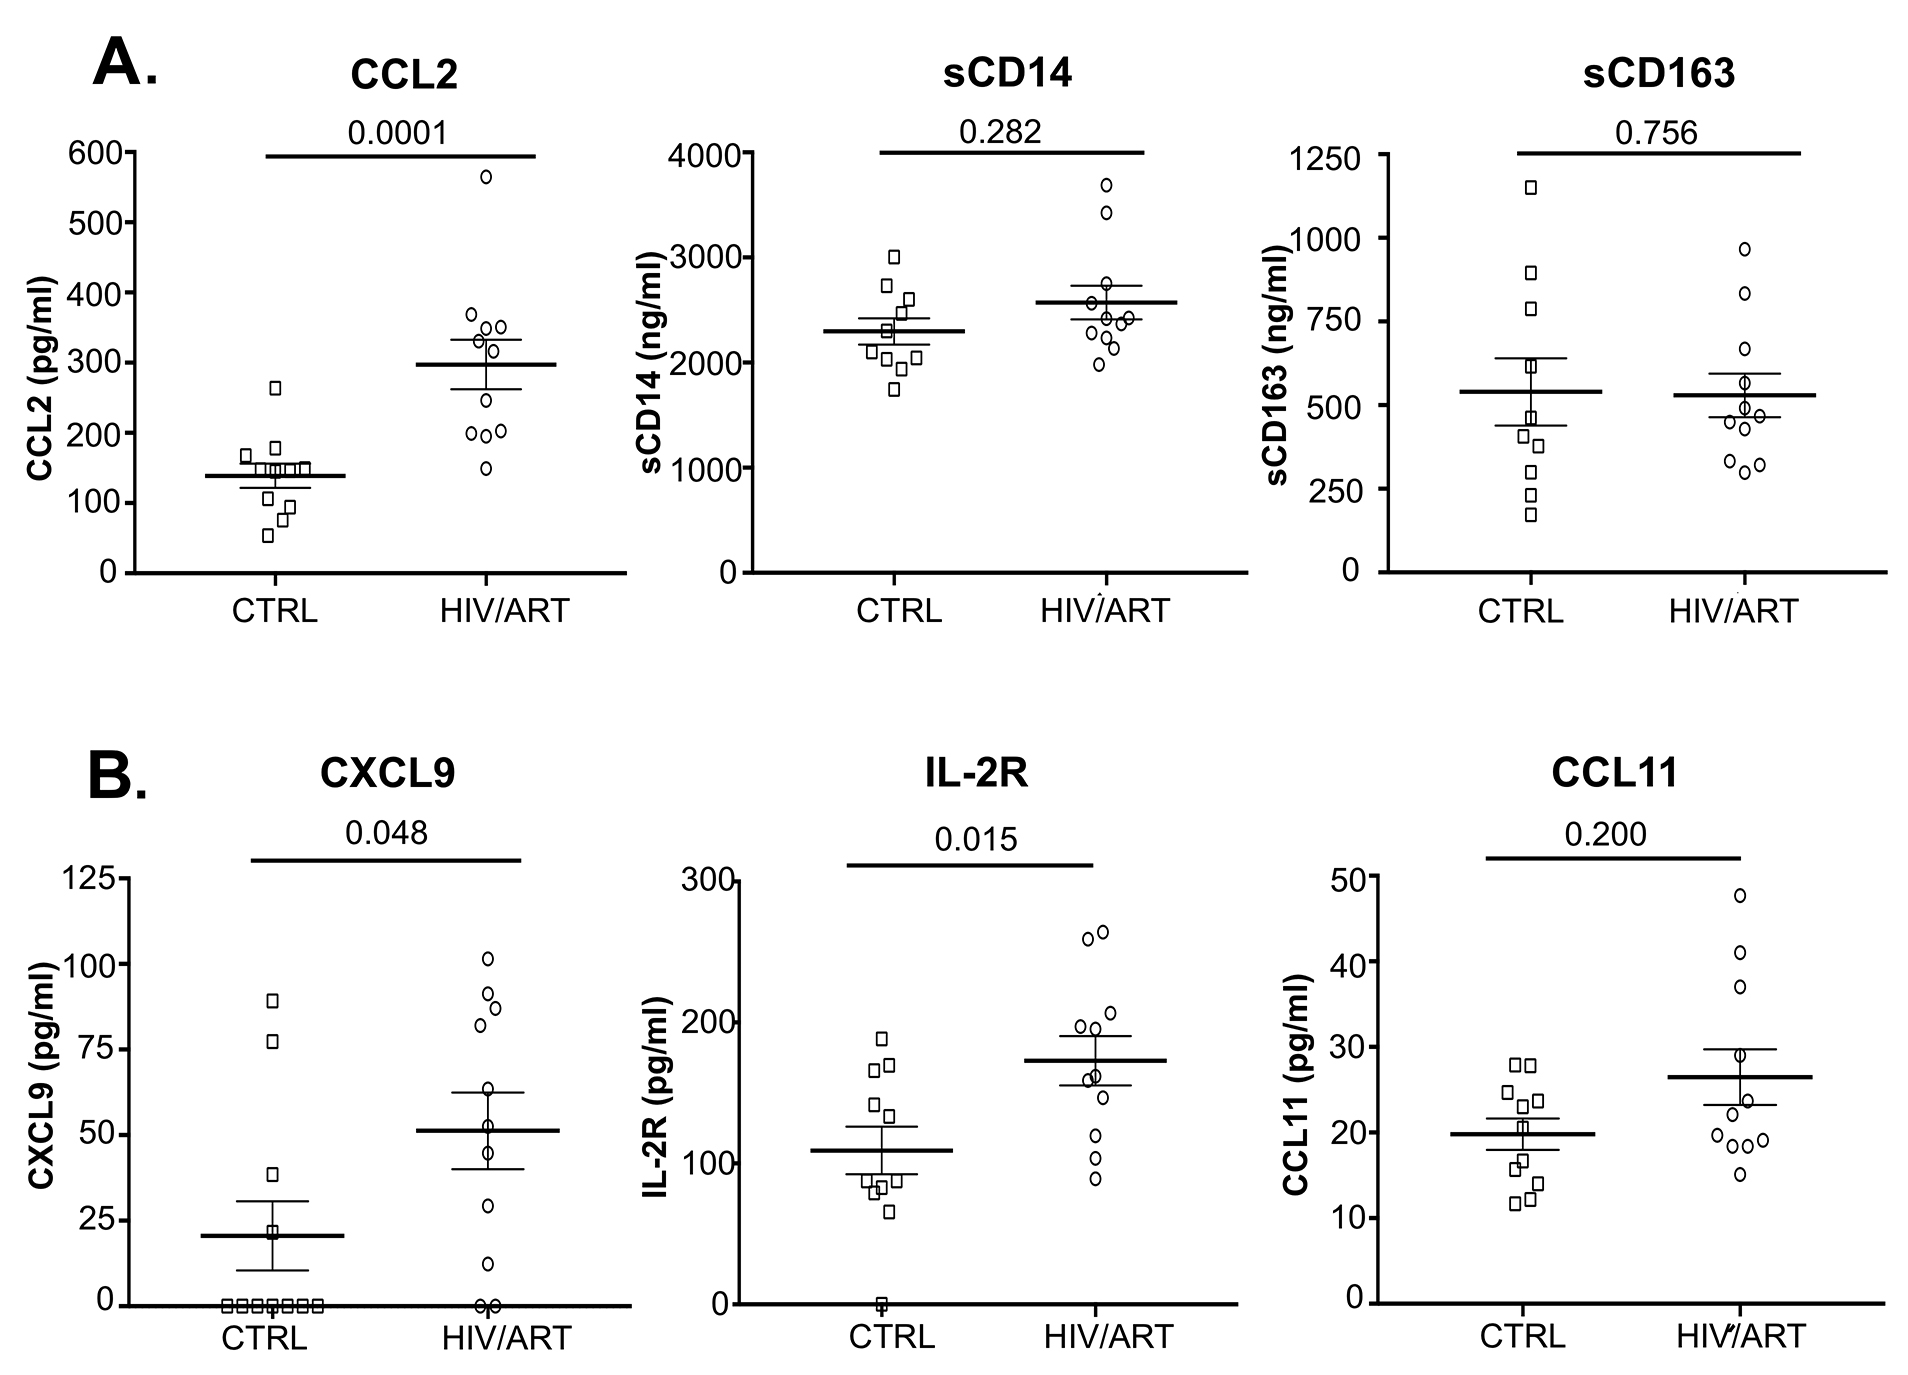
Figure 3. Elevated levels of several plasma biomarkers in HIV-suppressed individuals compared with matched HIV-negative controls. (A) Plasma CCL2 (MCP1), sCD14, and sCD163 quantitated by Luminex and ELISA in HIV/ART and uninfected controls (P values calculated using unpaired Mann Whitney U-test). (B) Plasma CXCL9 (MIG), IL-2R (sIL-2R), and CCL11 (eotaxin) quantitated by Luminex (P values calculated using non-parametric unpaired Mann Whitney U-test).
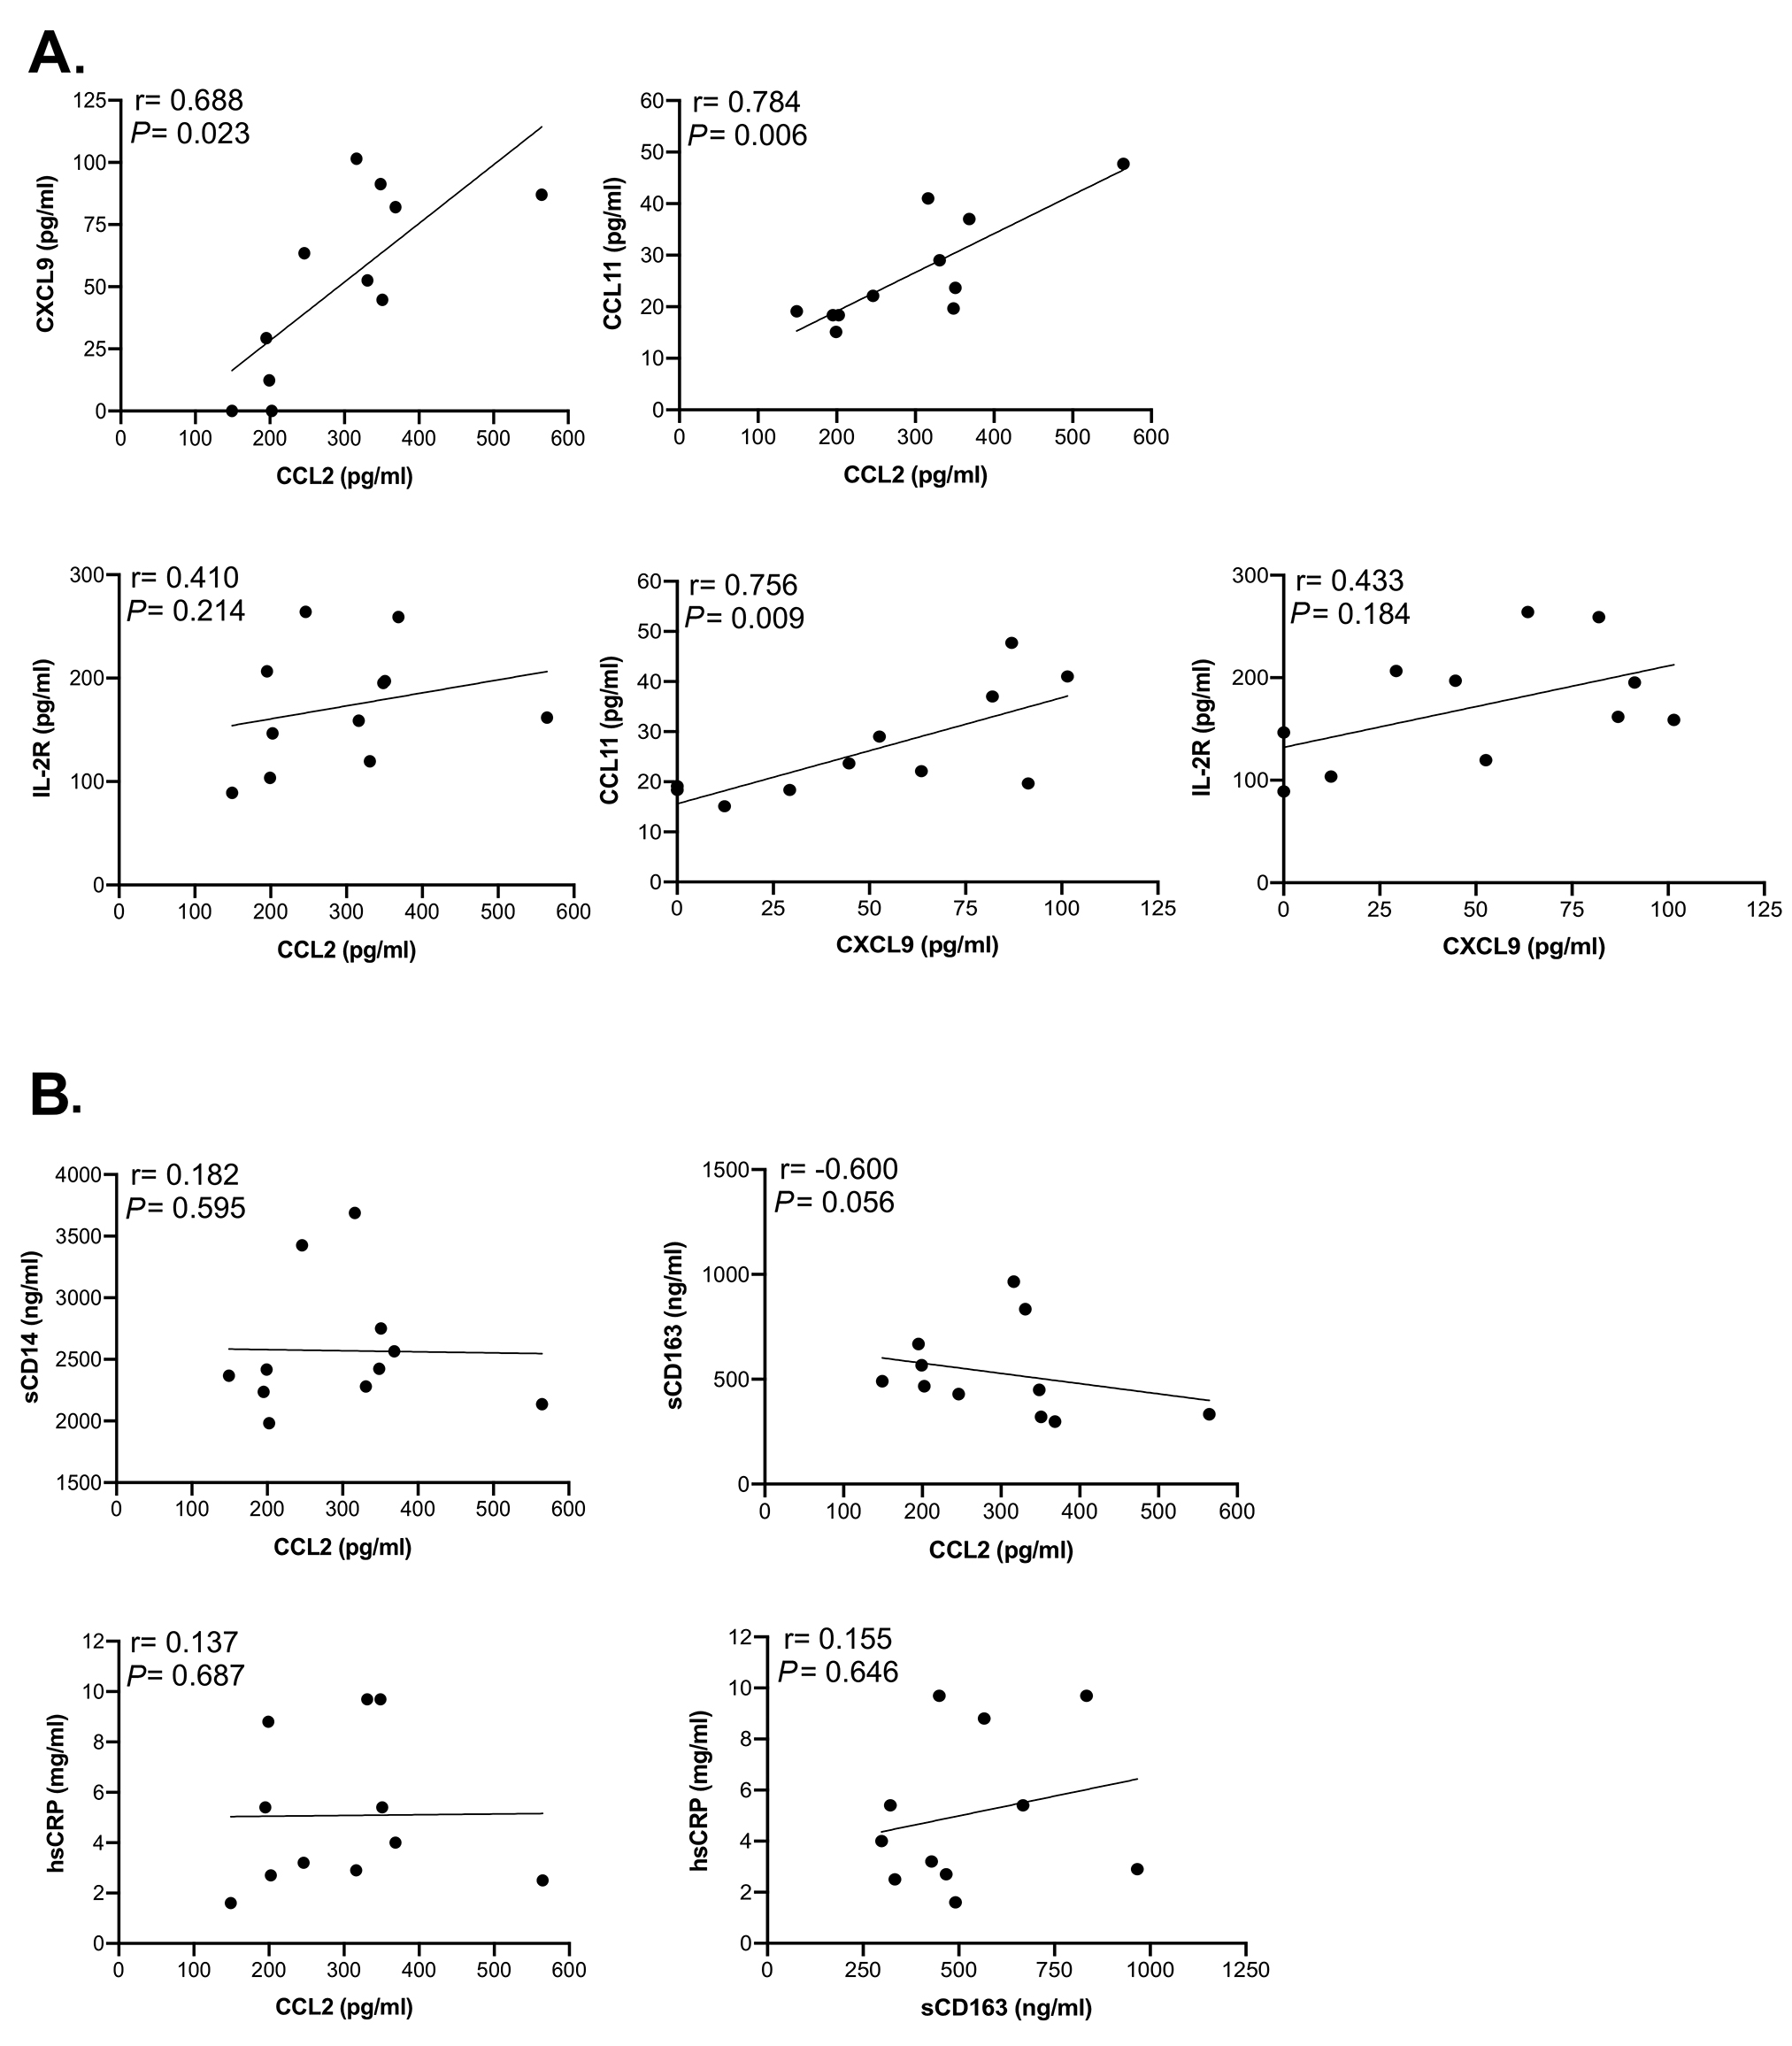
Figure 4. Correlation analysis between soluble markers in HIV/ART participants shows significant associations. Spearman correlation test was used to assess the relationship between the measured parameters in HIV/ART subjects. (A) Correlations between CXCL9, CCL2, CCL11, and IL-2R (sIL-2R). (B) Correlations between sCD14, CCL2, sCD163 and hsCRP. The correlation coefficient and significance values for each comparison are shown over each graph.
Together, these observations suggest that long-term ART-treated HIV-infected participants have largely normalized monocyte subsets, but display modest abnormalities of selective markers consistent with subtle dysregulation.
We then investigated plasma soluble factors in these participants (Figure 3 and Table 2). We were particularly interested in CCL2 (MCP-1), because that is associated with monocyte emigration into the CNS in HAND and vascular tissues in cardiovascular complications [9, 37]. We also examined sCD14 and sCD163 as indicators of monocyte activation that are elevated in untreated infection and persist despite ART suppression in some studies [38-40]. As shown in Figure 3A, HIV/ART subjects had CCL2 levels that were twice that of healthy controls (P < 0.0001). In contrast, sCD14 and sCD163 were not different between the groups.
Table 2. Plasma cytokines and inflammatory markers in HIV/ART individuals and matched HIV- controls.
|
|
|
|
|
|
|
|
|
|
|
|
|
|
|
|
|
|
|
|
|
|
|
|
|
|
|
|
|
|
|
|
|
|
|
|
|
|
|
|
|
|
|
|
|
|
|
|
|
|
|
|
|
|
|
|
|
|
|
|
|
|
|
|
|
|
|
|
|
|
|
|
|
|
|
|
|
|
|
|
|
|
|
|
|
|
|
|
|
|
|
|
|
|
|
|
|
|
|
|
|
|
|
|
|
|
|
|
|
|
|
|
|
|
|
|
|
|
|
|
|
|
|
|
- |
|
|
|
|
|
|
|
|
|
|
|
|
|
|
|
|
|
|
|
|
We then examined an extended panel of cytokines, chemokines, and other markers (Figure 3B and Table 2). Soluble IL-2R (sIL2R) and CXCL9 (MIG) were significantly elevated in HIV/ART participants (P = 0.015 and P = 0.048, respectively). CCL11 (eotaxin-1) was modestly but non-significantly elevated (P = 0.200). Of interest, LBP (LPS binding protein) was not elevated in HIV/ART compared to control.
To identify relationships between soluble factors, we analyzed the correlation between molecules that were elevated in HIV+ participants (Figure 4A). CCL2 was strongly correlated with CXCL9 (P = 0.023) and CCL11 (P = 0.006) but not with sIL-2R (P = 0.214). CXCL9 also correlated with CCL11 (P = 0.009) but not sIL-2R (P = 0.184). In contrast, sCD14, and hsCRP did not correlate with CCL2, nor did sCD163 with hsCRP, whereas sCD163 and CCL2 showed a modest, although non-significant correlation (P = 0.056) (Figure 4B). When correlations between these markers were assessed by considering both HIV/ART and HIV-negative controls (Supplementary Figure 2), the relationships were even more significant between CXCL9 and CCL2 (P = 0.003), sIL-2R and CCL2 (P = 0.005), and CCL11 and CXCL9 (P = 0.008). In addition, relationships between CCL11 and CCL2, sIL-2R and CXCL9, and hsCRP and CCL2 were also significant (P = 0.048, P = 0.01 and P = 0.027, respectively). Together, these observations identify CCL2, CXCL9, CCL11, and sIL2R as reflecting persistent HIV/ART immune dysregulation.
We then applied principal component analysis (PCA) as an unsupervised data reduction tool to visualize the soluble biomarkers and, in addition, identify whether groupings were evident within the HIV/ART participants (Figure 5). As expected, PCA analysis confirmed that the profile of soluble biomarkers differed in HIV/ART participants and HIV-negative controls. The differences were driven largely by CCL2 (MCP-1), CXCL9 (MIG), CCL11 (eotaxin-1), sIL-2R, IL-10, CXCL10 (IP-10), and IL-6. Of these, CCL2, CXCL9, and sIL-2R were identified as significantly increased in HIV/ART versus HIV-negative controls, whereas the remaining biomarkers showed non-significant increases in HIV/ART group (Table 2).
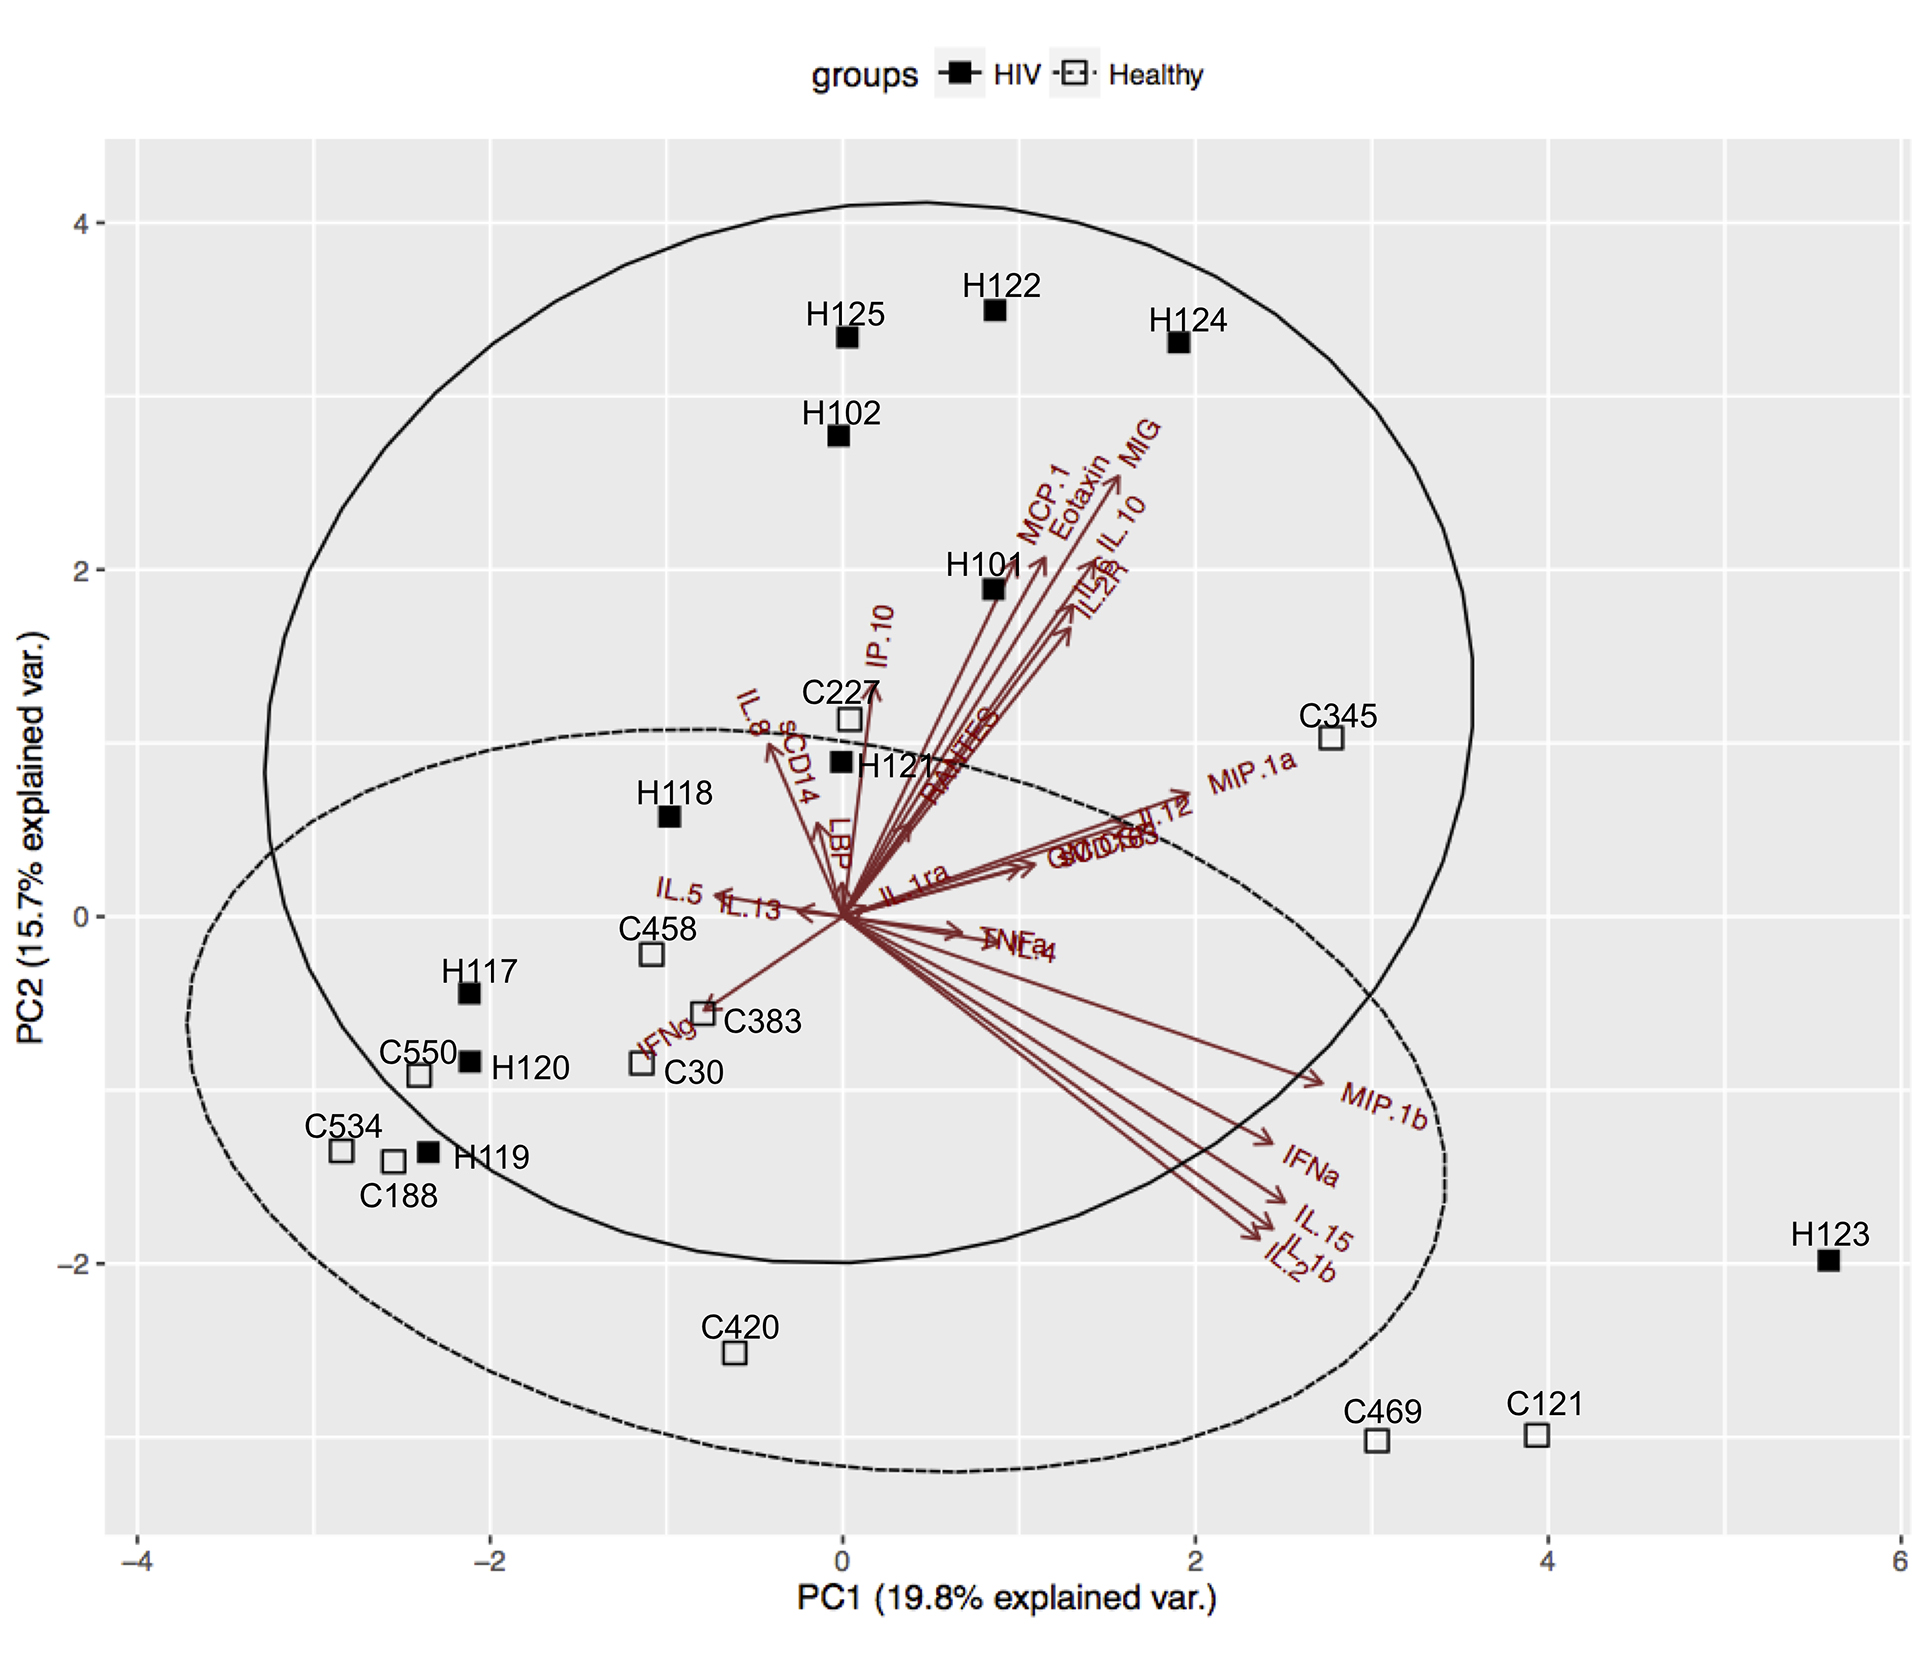
Figure 5. Principal Component Analysis (PCA) of soluble factors identifies subgroups within HIV/ART group. PCA of all cytokines and chemokines (Table 2) identified a subgroup of HIV/ART participants(H101, H102, H122, H124, H125) based on increased levels of CCL2 (MCP1), CCL11 (Eotaxin), CXCL9 (MIG), IL-2R, IL-10, IL-6, and CXCL10 (IP-10) and were separated from the other HIV/ART participants (H117, H118, H119, H120, H121), who clustered with HIV-negative controls.
The PCA analysis demonstrated that the distinct HIV/ART profile resulted mainly from a subgroup of 5 HIV/ART participants, while 6 others clustered with controls. These 5 HIV/ART participants (H122, H124, H125, H101, H102) were significantly older than the HIV/ART participants that grouped with the controls (mean ± SE: 57.6 ± 1.6 years versus 36.4 ± 2.4 years respectively; P = 0.012, Mann-Whitney test). There were no other differences between the two HIV/ART subgroups with regard to CD4 nadir, current CD4 count, CD4/CD8 ratio, D-dimer, or other factors. Thus, these observations suggest that age is an important factor driving the inflammatory cytokine profile, and that older HIV/ART participants show a pattern that is distinct from both younger HIV/ART participants and HIV-negative controls of the same age group.
We analyzed gene expression patterns of purified monocytes from HIV/ART participants and matched controls using Illumina microarrays. Comparisons between the two groups identified 303 significantly differentially expressed probes (FDR < 20%). Unexpectedly, the great majority of these were downregulated in HIV+/ART participants (Figure 6A). Ingenuity Pathway Analysis (IPA) of the significantly differentially expressed probes identified functions (Figure 6B) and pathways (Figure 6C) significantly affected in HIV/ART participants, all of which were predicted to be inhibited, based on the direction of change of involved genes. Affected functions included cellular activation, cell-to-cell interaction and migration, cell development, and immune response of cells, while pathways included NFAT regulation of immune response and NF-κβ signaling, among others.
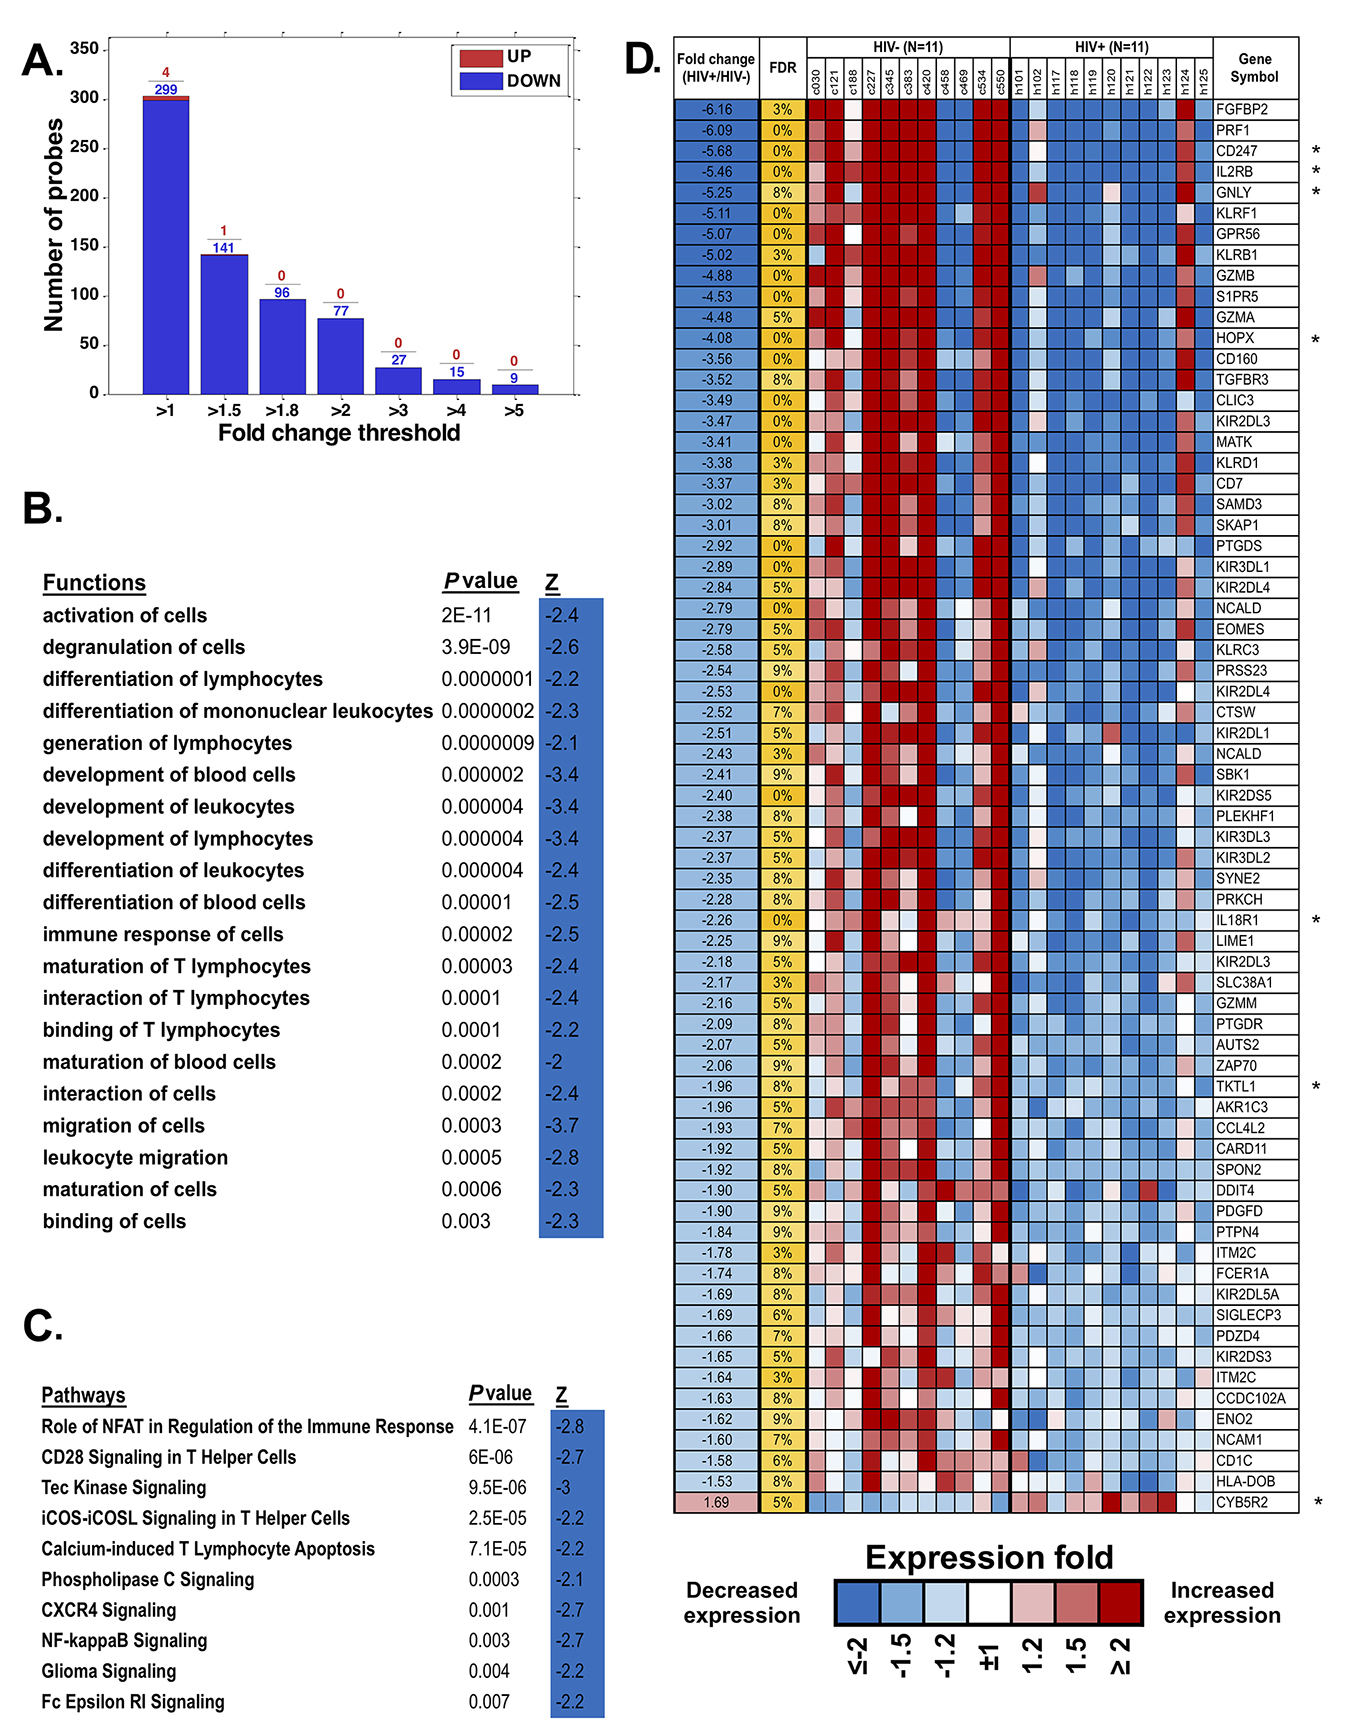
Figure 6. Monocyte gene expression dysregulation in HIV/ART. (A) Fold change of differentially expressed monocyte genes (FDR < 20%) in HIV/ART versus HIV- controls. Most of the significant genes are downregulated in HIV/ART group (blue). (B, C) Functions (B) and pathways (C) that are significantly enriched (P < 0.01) among genes changed in HIV+/ART individuals compared with those in healthy controls, with predicted activation Z score calculated by IPA indicating inhibition of functions and pathways in HIV/ART subjects. (D) Heat map of top differentially expressed genes in HIV/ART versus HIV-control monocytes (FDR < 10%; fold change > 1.5). Expression levels are shown as fold change in HIV/ART compared with average across samples and sorted by fold change between HIV+/control. Range of colors (blue to red) reflects range of expression for each sample (low to high) and corresponds to log2 ratio vs average across all samples. FDR: false discovery rate; Z: z-score; P-value: nominal P value of the enrichment; Gene symbols with * indicate genes in the HIV interaction database.
We then focused on the top 76 probes, representing 68 differentially expressed genes (DEGs), that were significant at FDR < 10% and changed 1.5-fold (Figure 6D) or more. Of these DEGs, 67 were downregulated and only one was upregulated in HIV/ART participants relative to controls. Overlap of these genes with significantly enriched functions (Figure 6B) was broadly categorized into groups related to inflammatory response, immune cell trafficking, cellular development and cell-to-cell signaling and interaction Table 3). Several of the DEGs (Table 3, in bold) are associated with multiple functional categories.
Table 3. Functional classification of differentially expressed monocyte genes in HIV/ART participants compared with HIV- controls.
|
Inflammatory response
|
CD247, CARD11, IL18R1, KLRB1, KLRF1, FCER1A, PTGDS, PRF1, CD7, NCAM1, IL15, PTGDR, PRSS23, PTPN4 |
|
Cellular movement, immune cell trafficking
|
SKAP1, CD247, EOMES, FCER1A, PRF1, IL2RB, ZAP70, PTGDS, PTGDR, GNLY, SPON2, SIPR5, NCAM1, GZMB, TGFBR3, MATK, PDGFD, SYNE2, IL15 |
|
Cellular Development
|
CD247, EOMES, IL15, IL2RB, ZAP70, CARD11, PRKCH, GNLY, IL18R1, RPA1 |
|
Cell-to-Cell Signaling and Interaction
|
CD7, CD247, FCER1A, PRF1, IL2RB, ZAP70, CARD11, KLRB1, KLRD1, KLRF1, GNLY, SIPR5, NCAM1, GZMB, GZMA, TGFBR3, DDIT4, IL18R1, KIR3DL1, SPON2, CD1C, IL15, SKAP1 |
We then used the Database for Annotation, Visualization and Integrated Discovery (DAVID) to identify DEGs overlapping with genes in the HIV Interaction Database [41, 42]. Seven of these 68 DEGs (10%; identified with * in Figure 6D) are also identified in the HIV interaction database (PRF1, CD247, IL2RB, GZMA, PRKCH, ZAP70, and HLA-DOB) as having protein-protein interactions. Thus, HIV/ART monocyte dysregulation also included genes that are involved in host-virus interactions. Because the proportion of monocytes actually infectedin vivo is very small [43], this observation likely suggests indirect rather than direct effects of HIV infection on these genes.
Next, we specifically queried expression in purified monocytes of an a priori set of genes for surface or secreted molecules that have been associated with persistent immune activation in HIV/ART subjects (Figure 7) [9, 13], recognizing that soluble factors might be produced by multiple other cell types as well as monocytes. Results showed heterogeneity between participants, both in the HIV/ART and control groups. However, HIV/ART monocytes generally showed elevated expression of CXCL10, CCL2, CCR2, and CXCL9, and decreased CD16 and IL-8, compared with control participants. While these genes did not reach the FDR<10% threshold criteria for broader gene analysis, CXCL10, CCL2, IL-1B, CXCL9, IL-8, and CD16 showed >1.5-fold differences and had nominal P-values <0.01.
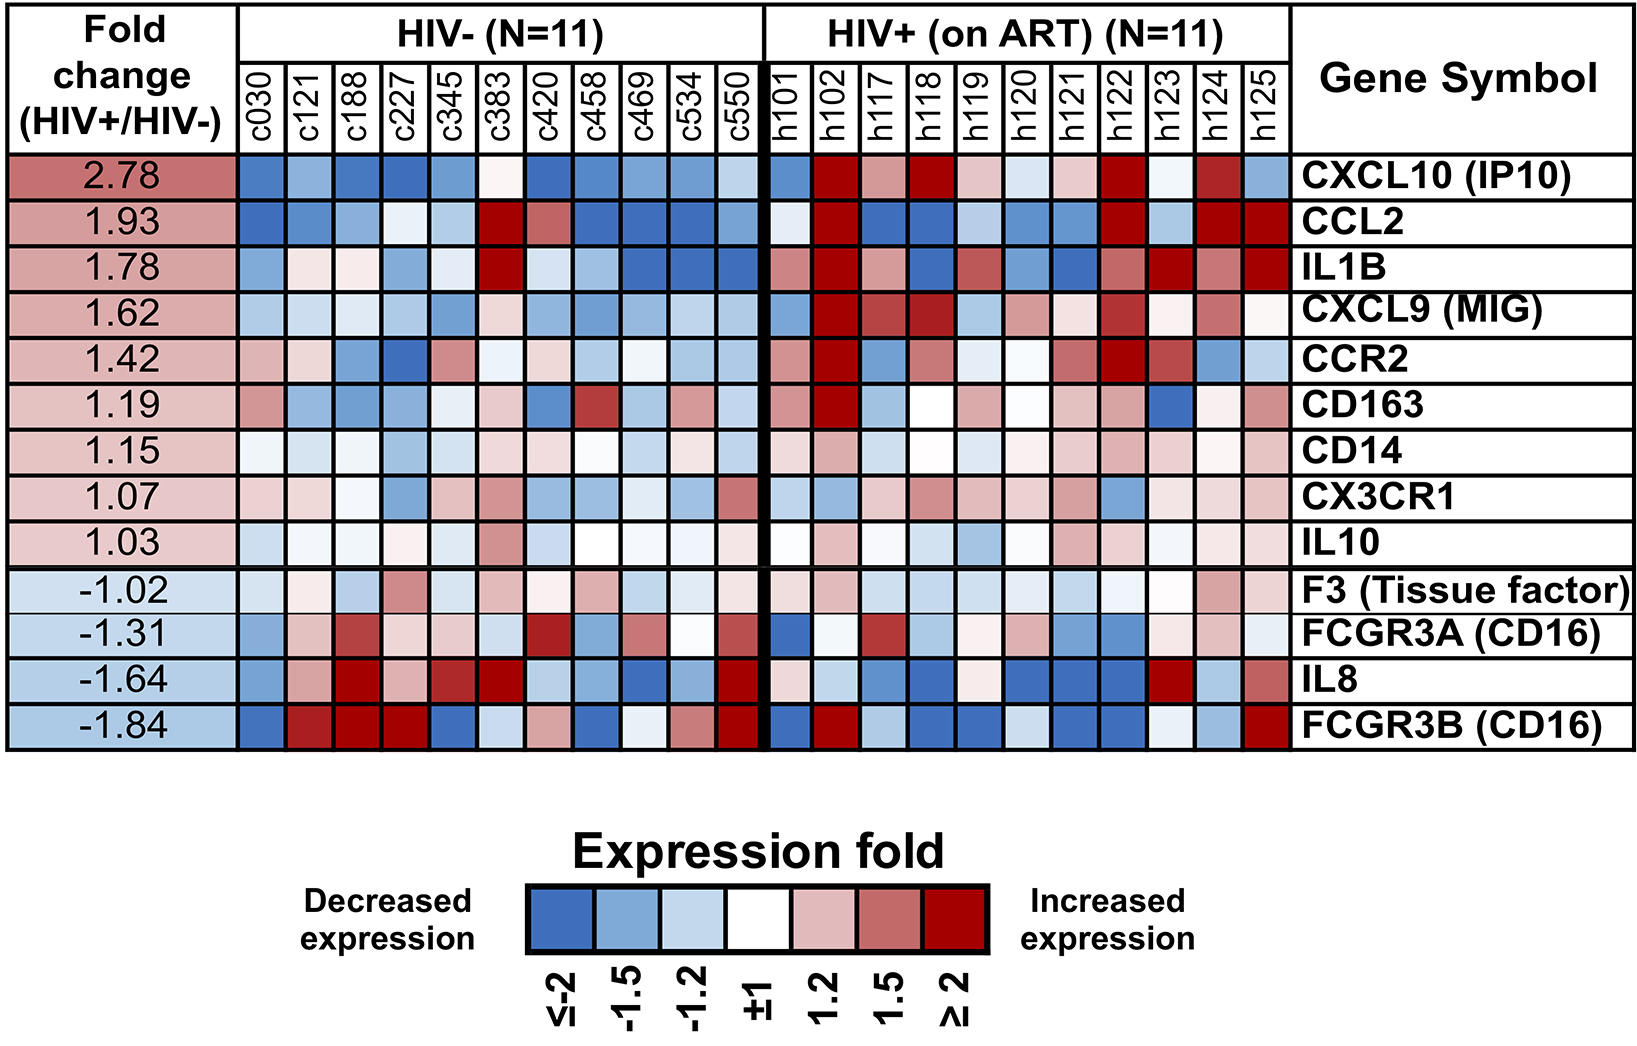
Figure 7. Differential expression of monocyte genes associated with immune activation in people with HIV based on a priori knowledge. Heat map display of the microarray gene expression data showing genes coding for monocyte surface receptors and soluble factors in HIV/ART participants versus matched HIV-negative controls. Expression levels are shown as fold change in HIV/ART compared to control arranged in descending order of expression. Range of colors (blue to red) shows range of expression (low to high). Genes showing >1.5-fold change had nominal P value <0.01.
While enrichment by IPA provided a set of functions and pathways affected in HIV+/ART participants, it was focused only on statistically significant genes and ignored more subtle differences between the groups. To obtain a more comprehensive picture of the affected pathways and functions, we used Gene Set Enrichment Analysis (GSEA), which employs the whole gene expression dataset ranked in order of difference between the groups, rather than individual genes identified using a pre-specified threshold. Of the categories from KEGG, BioCarta, PID, and REACTOME databases, there were 107 gene sets that were significantly enriched at a nominal P<0.05 and 43 gene sets at P<0.01. A total of 16 gene set pathways were significant at FDR <25%, most of which were immune-related pathways (Table 4).
Table 4. Enriched pathways in monocytes of HIV/ART individuals by GSEA.
|
|
|
|
|
|
|
KEGG GRAFT VERSUS HOST DISEASE |
|
|
|
PRF1, GZMB, KLRD1, KIR2DL3, KIR2DL1, KIR3DL2, KIR3DL1, HLA-DOB, KIR2DL5A, FASLG, KIR2DL2, IFNγ, IL1B, HLA-DOA, HLA-DMB, KLRC1, CD28 |
|
PID CD8 TCR DOWNSTREAM PATHWAY |
|
|
|
IL2RB, PRF1, CD247, GZMB, EOMES, STAT4, FASLG, PTPN7, CD3E, PRKCQ, IFNγ, CD8A, FOS, CD3G, JUN, EGR1, BRAF, IL2RG, CD8B, IFNAR1 |
|
BIOCARTA DC PATHWAY |
|
|
|
CD7, CD2, TLR7, TLR4, CD5, IFNγ, TLR2, CD40, TLR9 |
|
BIOCARTA IL12 PATHWAY |
|
|
|
IL18R1, CD247, STAT4, CXCR3, CD3E, IFNγ, CD3G, JUN, JAK2 |
|
PID IL12 STAT4 PATHWAY |
|
|
|
IL18R1, PRF1, CD247, STAT4, CD3E, IFNγ, FOS, CD3G, JUN, CD28, IL18RAP, STAT3, CD3D, TBX21 |
|
PID IL12 2PATHWAY |
|
|
|
IL18R1, IL2RB, CD247, GZMB, CCL3, EOMES, GZMA, STAT4, FASLG, CD3E, IFNγ, STAT1, CD8A, IL1B, FOS, CD3G, null, JAK2, IL2RG, IL18RAP, CD8B, STAT3, NFKB2, ATF2, CD3D, TBX21 |
|
BIOCARTA NO2IL12 PATHWAY |
|
|
|
CD247, STAT4, CXCR3, CD2, CD3E, IFNγ, CD3G, JAK2 |
|
BIOCARTA TOB1 PATHWAY |
|
|
|
CD247, TGFBR3, CD3E, IFNγ, CD3G, TGFB3, CD28, TOB1, SMAD4, CD3D |
|
BIOCARTA STATHMIN PATHWAY |
|
|
|
CD247, CD2, PRKAR2A, CD3E, CD3G, MAPK13, CAMK4, CAMK2B, CD3D |
|
REACTOME IMMUNOREGULATORY INTERACTIONS BETWEEN A LYMPHOID AND A NON LYMPHOID CELL |
|
|
|
CD160, CD247, KLRD1, KIR2DL3, KIR2DL4, KIR2DL1, KIR3DL2, KIR3DL1, CD81, CD96, KIR2DL2, CD3E, CD8A, CD200R1, CD3G, CD40, KLRC1, KIR2DS1, KLRK1, CD8B, ITGAL |
|
REACTOME HS GAG BIOSYNTHESIS |
|
|
|
EXT1, GPC4, NDST2, HS3ST1, GLCE, HS6ST1, NDST1, SDC2, AGRN, EXT2 |
|
REACTOME DEFENSINS |
|
|
|
TLR2, DEFA3, DEFA4, DEFA1, DEFB103B, CCR6, TLR1, CCR2, DEFA1B |
|
KEGG ANTIGEN PROCESSING AND PRESENTATION |
|
|
|
KIR2DS5, KLRD1, KIR2DL3, KIR2DL4, KLRC3, KIR2DL1, KIR3DL2, KIR3DL1, HLA-DOB, KIR2DL5A, KIR2DL2, CD8A, HLA-DOA, HLA-DMB, CTSS, TAP1, KLRC1, KIR2DS1, CD8B, CIITA, LTA, KLRC4, HLA-DQA1 |
|
KEGG ETHER LIPID METABOLISM |
|
|
|
PAFAH1B2, PAFAH1B3, PPAP2B, PLA2G4A, LPCAT4, PLA2G7, AGPS, PLA2G6, LPCAT1, PLA2G4B, PLD1, PAFAH1B1, PLA2G12B, PAFAH2, PLA2G2F |
|
KEGG O GLYCAN BIOSYNTHESIS |
|
|
|
GCNT1, GALNT11, C1GALT1, ST3GAL2, C1GALT1C1, GALNT1, B4GALT5, GALNT3, GALNTL1, GALNT7, GALNT10, B3GNT6, GCNT3 |
|
REACTOME HOMOLOGOUS RECOMBINATION REPAIR OF INDEPENDENT DOUBLE STRANDED BREAKS |
|
|
|
RAD50, LIG1, MDC1, BRIP1, NBN, RPA3, RPA1 |
GS size: Gene set size (number of genes); NOM p-value: nominal P
-value; FDR: false discovery rate. Shown are processes enriched at FDR
<25%.
Gene Symbols enriched in HIV/ART compared with controls are shown; genes in
bold are enriched in more than one category. All genes listed are
downregulated in HIV/ART individuals.
Since monocytes are key antigen-presenting cells, one of the enriched pathways of interest is the Antigen Processing and Presentation pathway (Table 4). This pathway was earlier reported to be upregulated in monocytes of HIV+ viremic individuals compared with HIV/ART-suppressed individuals [44]. Our data suggest that in participants who have chronic ART-suppressed HIV/, several genes in this pathway continue to be dysregulated. Strikingly, however, the core-enriched genes in this pathway are mostly downregulated compared with control participants (Figure 8). A similar pattern was seen in two other pathways identified (graft-versus-host disease [GVHD]; Immunoregulatory Interactions Between a Lymphoid and a Non-Lymphoid cell) (Table 4; Figure 8), which have in common with the Antigen Presentation Pathway several of the enriched genes. Finally, as shown in Table 5, several biological processes and functions were observed to be downregulated in the HIV/ART group. Notable among them are the genes associated with the gene ontology terms cellular defense response, cytokine secretion, and JAK-STAT cascade.
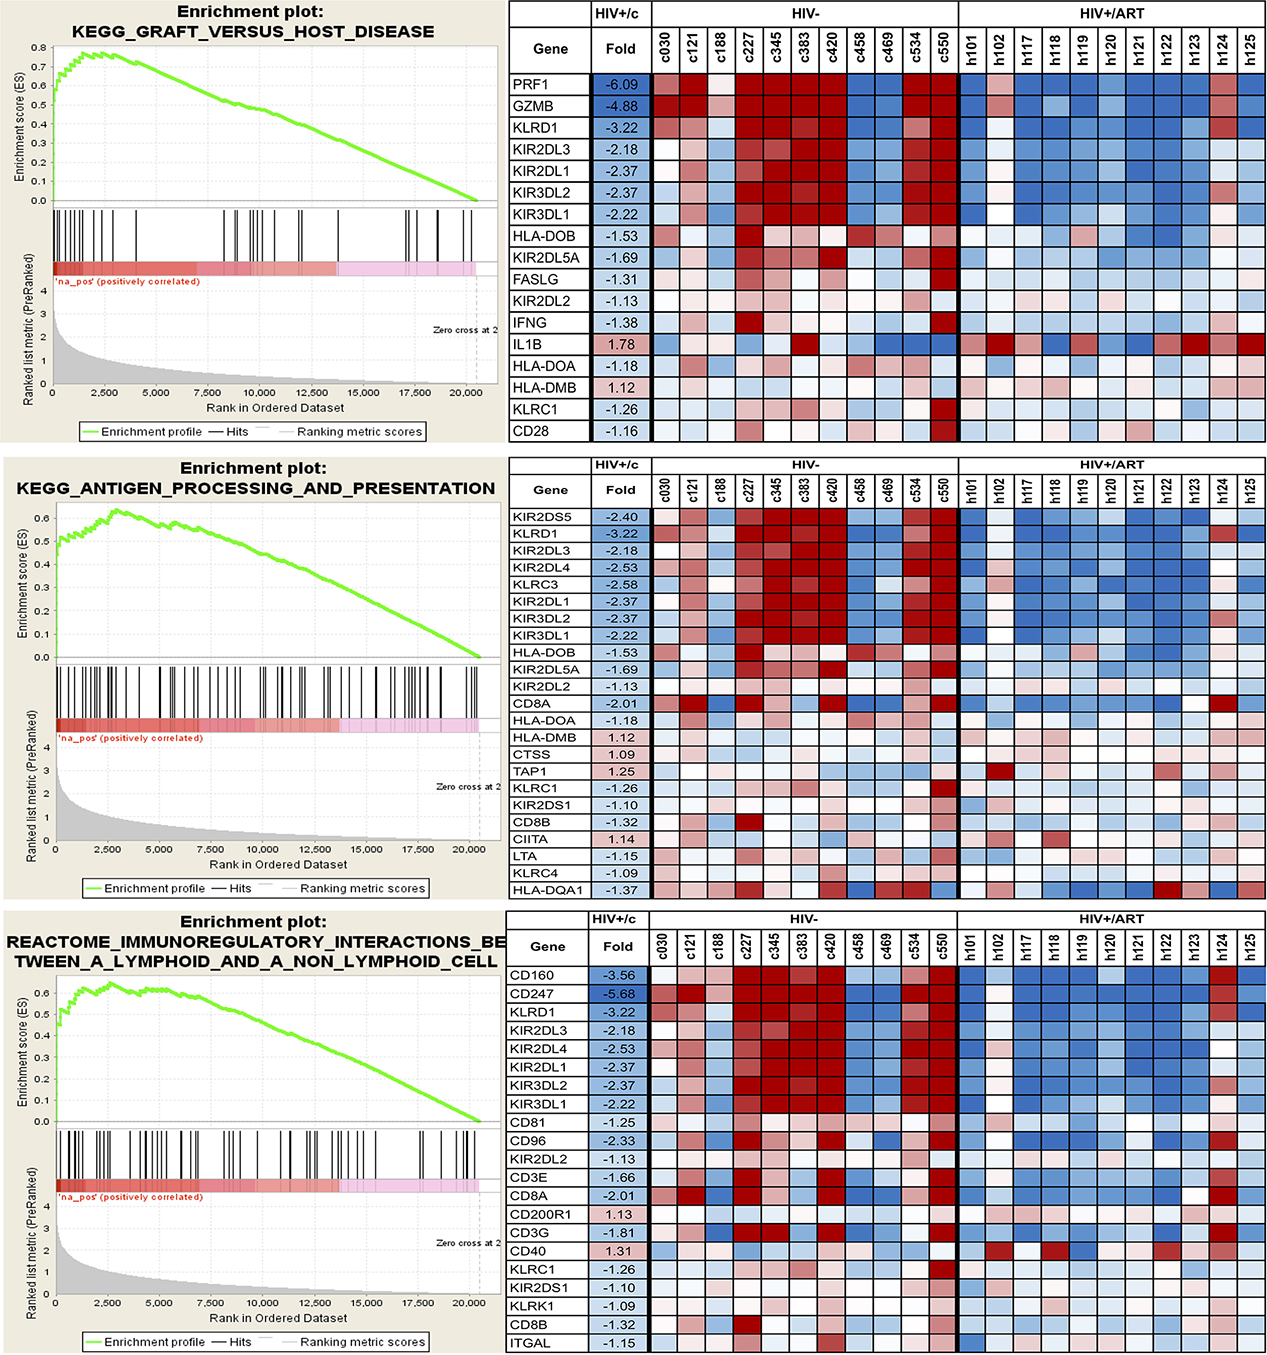
Figure 8. Selected pathways affected in the monocytes of HIV/ART participants versus HIV-negative controls. Data shown are for three KEGG immune-related pathways. Left panels: Enrichment plots for monocytes from HIV/ART group. The bottom portion of the plot shows the value of the ranking metric (y-axis) moving down the list of ranked genes (x-axis). The ranking metric measures a gene’s correlation with a phenotype. Genes most correlated with HIV/ART have the highest positive ranking metric score. Middle portion of the plot shows location of the genes from the respective pathways within the ranked list. Top of the plot shows enrichment score (ES) for the gene set as the analysis walks down the ranked list. The score at the peak of the plot is the ES for the gene set and genes appearing before or at the peak are defined as core enrichment genes for each set. Right panels: Heat map of core enrichment genes corresponding to respective enrichment plots. Rows: genes; columns: samples; range of colors (red to blue): range of expression (high to low).
Table 5. Overrepresentation of biological processes and molecular functions by GSEA in monocytes from HIV/ART participants.
|
|
|
|
|
|
|
CELLULAR DEFENSE RESPONSE |
|
|
|
PRF1, CD160, CXCL9, KIR2DL4, KLRC3, KIR3DL2, FAIM3, GNLY, ITK, LGALS3BP, CCR6, UMOD, CCR2, MNDA, KLRG1, CCR9, KLRC4, CCR3, LY96, CLEC5A, ADORA2A |
|
AXON GUIDANCE |
|
|
|
SPON2, SLIT2, FEZ2, SLIT1, NRP1, KAL1, SEMA4F |
|
SH2 DOMAIN BINDING |
|
|
|
IRS1, NUP62, SIT1, LAX1, JAK2, ARHGAP5 |
|
DI TRI VALENT INORGANIC CATION TRANSMEMBRANE TRANSPORTER ACTIVITY |
|
|
|
IPTR3, ATP2B4, ATP2A2, SLC31A2, ITPR1 |
|
CARBON OXYGEN LYASE ACTIVITY |
|
|
|
ENO2, EHHADH, HADHB, CA5B, CA11, NTHL1, ENO3 |
|
POSITIVE REGULATION OF TRANSCRIPTION FACTOR ACTIVITY |
|
|
|
CARD11, NLRC3, PRKCQ, NOD2, CEBPG, PRDX3, NFAM1 |
|
SERINE HYDROLASE ACTIVITY |
|
|
|
GZMB, GZMA, PROC, DPP4, PREP, CFD, CTSG, PRSS36, F12, APEH, ACHE, CPD |
|
HYDRO LYASE ACTIVITY |
|
|
|
ENO2, EHHADH, HADHB, CA5B, CA11, ENO3 |
|
POSITIVE REGULATION OF TRANSLATION |
|
|
|
IRF4, BOLL, TLR7, SAMD4A, TLR4, TLR6, 1L29, LTB, TLR9, IL27, TLR1, CD28, ELANE, EB13, CEBPG, AZU1 |
|
SERINE TYPE ENDOPEPTIDASE ACTIVITY |
|
|
|
GZMB, GZMA, PROC, PREP, CFD, CTSG, PRSS36, F12, APEH |
|
CYTOKINE SECRETION |
|
|
|
CADM1, ABCA1, NLRC4, CARD8, NOD2, SRGN |
|
SERINE TYPE PEPTIDASE ACTIVITY |
|
|
|
GZMB, GZMA, PROC, DPP4, PREP, CFD, CTSG, PRSS36, F12, APEH, CPD |
|
JAK STAT CASCADE |
|
|
|
NMI, STAT4, F2R, CLCF1, STAT1, IL29, STAT2, CCR2, IFNAR1, STAT5B, STAT3, CCL2, SOCS2, HCLS1, IL20, IL12A, NF2, FGFR3, PIAS1, SOCS6, SOCS3, PIGU |
GS size: Gene set size (number of genes); NOM P-value: nominal P-value; FDR: false discovery rate. Shown are processes enriched at FDR <25%.
We asked whether the aberrant gene expression patterns identified here in HIV/ART participants’ monocytes were similar to aberrant monocyte gene expression patterns previously identified in HIV+ untreated individuals who were viremic, but asymptomatic. To do this, we compared the monocyte gene expression in chronic HIV/ART versus control monocytes from our study (which used the Illumina platform containing 29,208 probes representing 20,464 genes) with a previous study comparing monocytic genes from asymptomatic viremic HIV+ participants versus controls (which used custom cDNA arrays with 19,200 probes representing 14,000 genes) (Supplementary Table 1) [45, 46]. An overlapping group of 7,538 probes was present in both array platforms.
Applying a nominal P<0.05 cutoff to this group of probes, there were 790 probes that were differentially expressed in HIV/ART versus healthy control participants’ monocytes in this study, and 875 probes that were differentially expressed in viremic HIV+ versus control participant monocytes in the prior study (Figure 9A). Among these, only 44 probes showed a similar direction of dysregulated expression in both HIV/ART and HIV+ viremic subjects, representing 39 unique genes (Figure 9B) [45, 46]. Conversely, 56 probes (45 genes) were dysregulated in both HIV+ subject groups compared with healthy controls, but in opposite directions (data not shown). The total number of probes dysregulated in both gene expression analyses (100 probes; 84 genes) was approximately equal to the overlap expected by chance alone (92 probes). Thus, genes dysregulated in the viremic HIV participants as compared with controls are not over-represented in our HIV/ART-versus-control subjects here, which suggests that the pattern of aberrant monocyte gene expression in aviremic HIV/ART participants in our study is fundamentally different from the disruption of monocyte gene expression in viremic HIV+ subjects. Therefore, the monocyte gene expressed abnormalities seen in these long-term ART-suppressed participants reflect a unique pattern, and not simply a less severe version of what is seen in untreated HIV+ subjects’ monocytes.
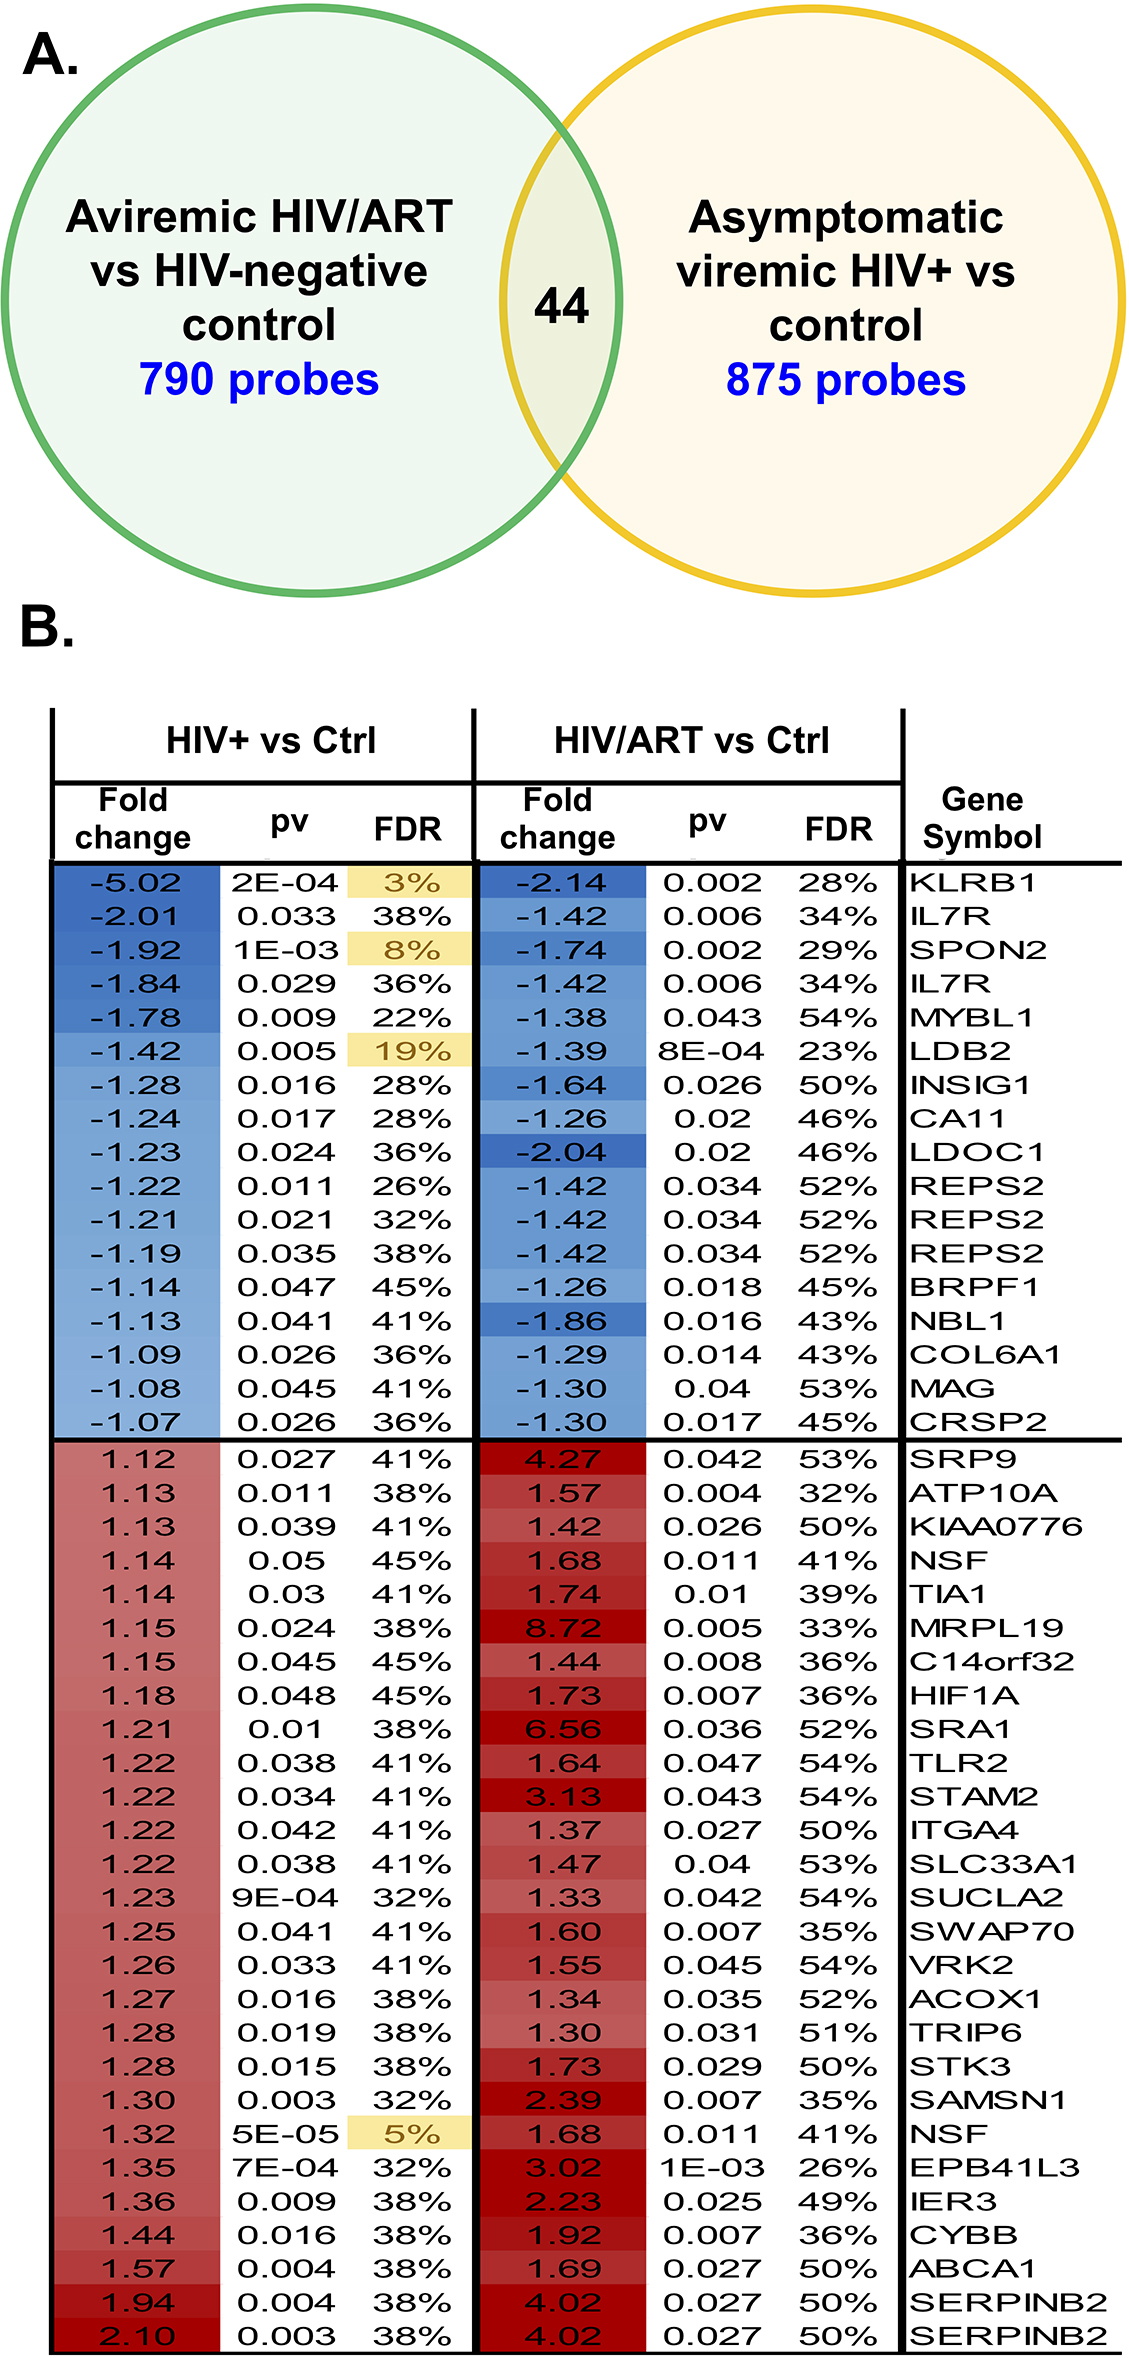
Figure 9. Monocyte gene expression pattern in aviremic HIV/ART participants is distinct from viremic asymptomatic HIV+ people. The differences in monocyte gene expression in HIV/ART versus healthy controls determined in the present study (using the Illumina platform; 29,208 probes representing 20,464 genes) was compared to differences in monocyte genes in chronic viremic HIV patients versus healthy controls (using nylon arrays; 19,200 probes representing 14,000 genes) previously reported [45, 46]. There were 7538 probes present in both array platforms. Using a nominal P<0.05 cutoff, 790 probes were different in HIV/ART versus controls, and 875 probes were different in viremic HIV+ versus controls. Of these, 44 probes (39 genes) reached the significance threshold in both comparisons and showed similar directionality, while 56 probes (45 genes) reached the significance threshold in both comparisons but showed opposite directionality. The figure depicts the overlap of probes and genes with similar directionality in the two analyses (HIV/ART compared with controls, and HIV viremic compared with controls).
The 68 most significant DEGs identified here (Figure 6C) included multiple genes well known to be expressed in monocytes, such as NCAM1 (CD56) [47, 48]. Also identified, however, were several Killer Immunoglobulin-like Receptor (KIR) genes. This finding was unexpected because KIRs are typically associated with NK cells, although KIR gene expression has previously been reported in monocytes [44]. We therefore wished to confirm KIR gene expression in monocytes using qPCR. We isolated mRNA from monocytes from a subset of study subjects (6 healthy controls and 4 HIV/ART), and used RT-qPCR to quantify RNA levels. We selected 2 KIR genes that were significantly downregulated in the HIV/ART group by microarray (KIR3DL1 and KIR3DL2), and 2 other genes (CD247 and IL2RB) that also were observed to be significantly downregulated. As shown in Table 6, qPCR confirmed expression in purified monocyte populations. Furthermore, all genes were downregulated several fold in the HIV/ART subjects compared with controls, consistent with the microarray data. Thus, specific targeted qPCR showed results confirming microarray data for these genes.
Table 6. Real time PCR validation of selected differentially expressed genes in HIV/ART versus healthy control participants.
|
|
|
|
|
|
|
KIR3DL1 |
|
|
|
|
|
KIR3DL2 |
|
|
|
|
|
CD247 |
|
|
|
|
|
IL2RB |
|
|
|
|
Fold difference was calculated from the mean expression levels for each gene relative to a housekeeping gene (IPO8), and is expressed as a negative value indicating down-regulation of the gene in HIV/ART+ compared to control participants.
We provide evidence here of monocyte and immune dysregulation after long-term ART despite recovery of monocyte subset frequencies and levels of sCD14 compared with HIV-negative control levels. Myeloid cells are proposed to play a central role in the serious non-AIDS events (SNAEs) that are associated with long-term HIV infection despite effective viral suppression. To understand monocyte recovery after ART, we employed complementary approaches of monocyte surface phenotyping, soluble cytokine analysis, and monocyte transcriptional analysis. We focused on subjects with HIV who are long-term ART-suppressed and without any of these comorbid conditions, but who are considered at risk based on initiating ART at low CD4 nadir, older age, and elevated plasma hsCRP. We found that monocyte inflammatory subsets in these individuals were not significantly different from those observed in healthy individuals, and only modest differences were seen in activation surface markers; a number of plasma biomarkers were elevated, which were highly interrelated, and cluster analysis identified a subgroup of subjects with coordinated cytokine elevations; and that multiple monocyte genes and gene pathways were significantly different in HIV/ART compared with control monocytes.
The first notable finding is that the proportions of cells in major monocytes subsets linked to persistent inflammation were not different in our HIV/ART subjects compared with HIV-negative controls. Total CD16+ monocytes as well as intermediate (CD14++CD16+) and non-classical (CD14+CD16++) monocytes were only marginally and not significantly higher in the HIV/ART group. This result is consistent with studies reporting reversal of the monocyte subsets indicative of activation in ART-suppressed individuals [20], but differs from others describing persistent alterations in CD16+ expression despite ART [18, 22]. It is likely that the duration of ART suppression or other aspects of subject selection are responsible for differences among studies. In contrast, we did see subtle abnormalities of surface marker expression, such as increased CD163 and decreased PD1, as well as a trend toward increased tissue factor (TF). TF is of particular interest, as it is thought to be a key driver of SNAEs through activation of coagulation pathway mediators [49]. The aberrant TF expression in these subjects was less marked than has been described in individuals with shorter durations of ART, given the median >7 years of ART therapy in our subjects. Together, these suggest that following very long-term ART, there is substantial but incomplete normalization of monocyte activation.
Analysis of monocyte subsets revealed that, beyond altered markers seen in HIV/ART monocytes as a whole, several additional markers were altered only in specific subsets. This included decreased CD38 MFI in non-classical monocytes and a trend toward fewer CX3CR1+ classical and intermediate monocytes. CX3CR1 is the receptor for fractalkine, which plays a role in trans-endothelial monocyte migration, and has been reported to be elevated in HIV/ART plasma [22]. Decreased CX3CR1 expression on HIV/ART monocytes has been reported previously (although based on MFI, rather than percentage) [22]. Although we did not measure plasma fractalkine, together, these findings suggest that abnormalities of the CX3CR1/fractalkine axis might contribute to monocyte/macrophage-related comorbidities in virally-suppressed individuals.
The second principal finding is that, alongside the largely though incompletely normalized monocyte profiles, a number of soluble factors associated with persistent immune activation remained elevated. Most striking was CCL2 (MCP-1), which was twice the level of matched healthy controls. CCL2 plays a key role in monocyte recruitment into tissues, including the CNS and vascular wall [50, 51], and is believed to be central in the development of neurological and cardiovascular complications in HIV/ART subjects [9,52, 53]. Thus, this mechanistically important chemokine is the most prominent abnormal mediator late after viral suppression. In addition, CXCL9 (MIG) and IL2R were also significantly elevated in the HIV/ART subjects as a group. Multiple other soluble factors showed a trend but did not reach statistical significance, which we ascribe to heterogeneity within the HIV subgroup (discussed further, below). In contrast, levels of certain other markers that have been linked to SNAEs, such as sCD14 and sCD163 [16], were increased only marginally or not at all.
The marked elevated CCL2 (MCP-1) levels in these people living with HIV despite long-term viral suppression are consistent with others' evidence implicating the CCL2/CCR2 axis as a central component of persistent immune activation, and a mechanistic role in HIV-associated neurologic, cardiovascular, and metabolic disorders [54-57]. Therefore, inhibiting the CCL2/CCR2 axis might be an attractive approach for prevention or treatment of HIV-associated comorbidities [52, 58]. Small-molecule CCL2 blockers have been developed and studied in vivo in other conditions [59, 60]. In HIV infection, studies have investigated CCL2 or dual CCR2/CCR5 blockade in vitro and in vivo, although with a focus on antiviral effects, rather than inflammation or comorbidities [61, 62]. Thus, the long-term persistence of CCL2 elevations combined with its role in recruiting monocytes into tissues, including brain and vascular tissues, suggest that targeting CCL2/CCR2 should be investigated for prevention or treatment of these comorbidities.
Principal component analysis of these soluble factors revealed that approximately half of the HIV/ART subjects clustered with healthy controls, and clearly delineated a subset of ART-suppressed persons with persistent activation. The HIV outlier cluster was driven not only by the molecules that were significantly elevated in HIV/ART versus healthy subjects (CCL2, CXCL9, and IL2R), but also by CXCL10 (IP-10), CCL-11 (Eotaxin), IL-6, and IL-10, which showed only a trend toward elevation compared with controls. Thus, the control-like cluster and outlier cluster revealed by this analysis explain the heterogeneity that limited statistical power in this relatively small group of HIV/ART subjects. Several of these molecules have been associated with SNAEs and mortality in HIV/ART treated subjects [9,57, 63]. Subjects in the outlier group did not differ from those that grouped with controls in CD4 nadir, current CD4 count, or other measured factors, but they were significantly older. Consistent with this, the incidence of HIV-associated SNAEs increases with age. Thus, we find a pattern of coordinated plasma cytokine dysregulation that is observed in only a subpopulation of HIV/ART subjects, potentially increasing their risk of SNAEs.
Finally, we used several complementary analytic approaches to interrogate monocyte gene expression in these long-term ART-treated subjects, and identified global dysregulation of multiple inter-related pathways associated with antigen presentation and immune function. The direction of dysregulation among these pathways was almost uniformly downregulation. This finding is consistent with the long-standing notion that, despite successful viral suppression, immune function does not completely normalize. Functional defects of myeloid cells are well-described during untreated disease [64, 65]. Our findings suggest that defects in monocyte function might exist in HIV+ individuals despite long-term ART treatment. Indeed, in addition to inflammatory SNAEs, HIV-infected individuals have persistently increased susceptibility to infections such as tuberculosis [4], and to multiple virus-associated cancers [5, 6]. Our data raise the possibility that myeloid dysfunction after ART could contribute to the sustained risk of these infectious and neoplastic complications. While it is plausible that this defect reflects a persistent effect of HIV immune dysfunction, chronic inflammation itself also can induce immunosuppression [66], and several of the downregulated genes in our HIV/ART monocytes have been associated with inflammation-related immunosuppression [67]. Future studies will be needed to define the mechanisms responsible.
Of note, several previous studies have compared transcriptomic patterns in HIV-infected subjects not on ART to those observed in healthy controls, and described multiple dysregulated pathways [46, 68-71]. In contrast, only a few have addressed monocyte gene expression in ART-treated subjects, and our study is the first to our knowledge to examine it in people with long-term ART suppression. One prior report described transcriptomic analysis of 5 ART-suppressed individuals compared with 4 healthy controls (as well as 5 untreated subjects), and identified 76 DEGs, of which 45 were upregulated and 31 downregulated in HIV/ART compared with controls [71]. However, those subjects were on ART for a mean of only 17 months, versus >7 years for our subjects. Another study examined monocytes from untreated individuals compared with healthy controls' monocytes, and the impact on a subset of genes over the first 9 months of ART initiation. That study reported a large number of genes initially dysregulated, about half of which remained dysregulated after 9 months of treatment [72]. Our results differ considerably from those shorter-term ART studies, in that downregulation was the main direction of perturbation in HIV subjects compared with healthy controls. The distinct pattern in our study subject population is likely due to the duration of ART treatment, the relatively advanced stage at which ART was started, older subject age, or other factors. Furthermore, we also compared the gene expression patterns in these monocytes to a prior study of untreated subjects and found very little overlap in the dysregulated genes indicating that it is not simply a "less severe" reflection of that seen in untreated subjects. Taken together, these results suggest that long-term ART-treated individuals exhibit monocyte dysregulation that is qualitatively different from that observed in both untreated and short-term ART-suppressed individuals. Given the persistent susceptibility to certain infections and neoplastic complications, as noted above, this observation merits further investigation.
Our study has several strengths. Our subjects were selected for being at high risk of SNAEs, based on older age and beginning ART in advanced disease with relatively low CD4 counts. Furthermore, our subjects were on ART for >7 years, which is highly relevant to the growing cohort of long-term treated people. Finally, our healthy controls were closely matched with our HIV/ART subjects based on age, race, gender, and smoking status. At the same time, our study has several limitations. While we studied a larger number of subjects than any prior HIV monocyte transcriptome studies, our stringent subject enrollment criteria resulted in a modest sample size, which limits statistical power. Also, within both the HIV and control groups, there was considerable heterogeneity, indicating multiple cofactors impacting surface markers, soluble factors, and gene expression. Monocyte purification (which here was ~95%) cannot completely eliminate any possibility of admixture with other cell types. While the consequences of surface markers such as TF and soluble factors such as CCL2 are strongly linked to SNAEs including neurological and cardiovascular disease in ART-treated individuals, future studies will be needed to identify both the mechanisms responsible for, and functional consequences of, dysregulated monocyte gene expression, as well as the potential impact of therapeutic targeting these pathways.
Finally, we selected participants on the basis of elevated CRP levels as an indicator of persistent inflammation, but it is likely that there are different patterns of residual immune activation, and use of other enrollment criteria (eg; TNF, sCD14, IL6, etc.) might have led to different findings. Combined with the heterogeneity we saw even within our stringently-selected participant group, it is likely that distinct "flavors of inflammation" exist that might not only differentially affect monocyte surface phenotypes, transcriptomic profiles, and soluble markers, but might even underlie distinct susceptibility to different comorbidities in ART-treated people living with HIV. Further research on the drivers and consequences of heterogeneity in residual inflammation in this population is warranted.
In conclusion, this study offers new insights into the perturbations in monocyte function in chronic HIV-1 infection on long-term ART. Our data reveal that monocyte subsets are largely normalized in these individuals, although with subtle abnormalities in levels of selected surface markers. We demonstrate elevated expression of a number of plasma biomarkers, particularly CCL2/MCP1, which is a key driver of neurological and cardiovascular SNAEs, and identification of a subset of subjects with coordinated increase among multiple mediators. Finally, we show global abnormalities of monocyte gene expression, dominated by downregulation of genes involved in various aspects of immune function. Taken together, our results shed light on the overlapping mechanisms that might contribute to both inflammatory complications of longstanding infection and, potentially, the overlapping issue of persistent innate immune dysfunction despite ART suppression.
The authors thank the subjects who participated in this study and the staff of the Penn Center for AIDS Research (CFAR) Clinical Core and Immunology Core. Clinical Trials registration number: NCT01600170.
This work was supported by NIH grant R01-MH61139, and the Penn Center for AIDS Research (CFAR), P30A1045008. The funders had no role in the design of the study, the collection, analysis, or interpretation of data, or in writing the manuscript.
The authors declare no competing financial or other conflicts of interest.
1. Younas M, Psomas C, Reynes J, Corbeau P. Immune activation in the course of HIV-1 infection: Causes, phenotypes and persistence under therapy. HIV Med. 2016;17(2):89-105. PubMed PMID: 26452565. doi: 10.1111/hiv.12310
2. Lederman MM, Funderburg NT, Sekaly RP, Klatt NR, Hunt PW. Residual immune dysregulation syndrome in treated HIV infection. Adv Immunol. 2013;119:51-83. PubMed PMID: 23886064. Pubmed Central PMCID: 4126613. doi: 10.1016/B978-0-12-407707-2.00002-3
3. Hsu DC, Sereti I. Serious Non-AIDS Events: Therapeutic Targets of Immune Activation and Chronic Inflammation in HIV Infection. Drugs. 2016;76(5):533-49. PubMed PMID: 26915027.
4. Kwan CK, Ernst JD. HIV and tuberculosis: a deadly human syndemic. Clin Microbiol Rev. 2011;24(2):351-76. PubMed PMID: 21482729. Pubmed Central PMCID: PMC3122491. doi: 10.1128/CMR.00042-10
5. Silverberg MJ, Lau B, Achenbach CJ, Jing YZ, Althoff KN, D'Souza G, Engels EA, Hessol NA, Brooks JT, Burchell AN, Gill MJ, Goedert JJ, Hogg R, Horberg MA, Kirk GD, Kitahata MM, Korthuis PT, Mathews WC, Mayor A, Modur SP, Napravnik S, Novak RM, Patel P, Rachlis AR, Sterling TR, Willig JH, Justice AC, Moore RD, Dubrow R, Databases IE. Cumulative Incidence of Cancer Among Persons With HIV in North America A Cohort Study. Ann Intern Med. 2015;163(7):507-+. PubMed PMID: WOS:000362496400004. doi: 10.7326/M14-2768
6. Shiels MS, Engels EA. Evolving epidemiology of HIV-associated malignancies. Curr Opin HIV AIDS. 2017;12(1):6-11. PubMed PMID: 27749369. Pubmed Central PMCID: PMC5240042. doi: 10.1097/COH.0000000000000327
7. McGuire JL, Gill AJ, Douglas SD, Kolson DL, group CHA-RTER, Grant I, Letendre SL, Ellis RJ, Marcotte TD, Franklin D, Jr., Ellis RJ, McCutchan JA, Alexander T, Letendre S, Capparelli E, Heaton RK, Atkinson JH, Woods SP, Dawson M, Smith DM, Wong JK, Fennema-Notestine C, Taylor MJ, Theilmann R, Gamst AC, Cushman C, Abramson I, Vaida F, Marcotte TD, von Jaeger R, McArthur J, Smith M, Morgello S, Simpson D, Mintz L, McCutchan JA, Toperoff W, Collier A, Marra C, Jones T, Gelman B, Head E, Clifford D, Al-Lozi M, Teshome M. Central and peripheral markers of neurodegeneration and monocyte activation in HIV-associated neurocognitive disorders. J Neurovirol. 2015;21(4):439-48. PubMed PMID: 25776526.
8. Martin GE, Gouillou M, Hearps AC, Angelovich TA, Cheng AC, Lynch F, Cheng WJ, Paukovics G, Palmer CS, Novak RM, Jaworowski A, Landay AL, Crowe SM. Age-associated changes in monocyte and innate immune activation markers occur more rapidly in HIV infected women. PLoS One. 2013;8(1):e55279. PubMed PMID: 23365694. Pubmed Central PMCID: 3554695. doi: 10.1371/journal.pone.0055279
9. Zungsontiporn N, Tello RR, Zhang G, Mitchell BI, Budoff M, Kallianpur KJ, Nakamoto BK, Keating SM, Norris PJ, Ndhlovu LC, Souza SA, Shikuma CM, Chow DC. Non-Classical Monocytes and Monocyte Chemoattractant Protein-1 (MCP-1) Correlate with Coronary Artery Calcium Progression in Chronically HIV-1 Infected Adults on Stable Antiretroviral Therapy. PLoS One. 2016;11(2):e0149143. PubMed PMID: 26867220. Pubmed Central PMCID: PMC4750941. doi: 10.1371/journal.pone.0149143
10. Sandler NG, Wand H, Roque A, Law M, Nason MC, Nixon DE, Pedersen C, Ruxrungtham K, Lewin SR, Emery S, Neaton JD, Brenchley JM, Deeks SG, Sereti I, Douek DC, Group ISS. Plasma levels of soluble CD14 independently predict mortality in HIV infection. J Infect Dis. 2011;203(6):780-90. PubMed PMID: 21252259.
11. Kusao I, Shiramizu B, Liang C-Y, Grove J, Agsalda M, Troelstrup D, Velasco V-N, Marshall A, Whitenack N, Shikuma C, Valcour V. Cognitive performance related to HIV-1-infected monocytes. J Neuropsychiatry Clin Neurosci. 2012;24(1):71-80. PubMed PMID: 22450616.
12. Kim W-K, Corey S, Alvarez X, Williams K. Monocyte/macrophage traffic in HIV and SIV encephalitis. J Leukoc Biol. 2003;74(5):650-6. PubMed PMID: 12960230.
13. Kamat A, Misra V, Cassol E, Ancuta P, Yan Z, Li C, Morgello S, Gabuzda D. A plasma biomarker signature of immune activation in HIV patients on antiretroviral therapy. PLoS One. 2012;7(2):e30881. PubMed PMID: 22363505.
14. Kaplan RC, Landay AL, Hodis HN, Gange SJ, Norris PJ, Young M, Anastos K, Tien PC, Xue X, Lazar J, Parrinello CM, Benning L, Tracy RP. Potential cardiovascular disease risk markers among HIV-infected women initiating antiretroviral treatment. J Acquir Immune Defic Syndr. 2012;60(4):359-68. PubMed PMID: 22592585.
15. Burdo TH, Lo J, Abbara S, Wei J, DeLelys ME, Preffer F, Rosenberg ES, Williams KC, Grinspoon S. Soluble CD163, a novel marker of activated macrophages, is elevated and associated with noncalcified coronary plaque in HIV-infected patients. J Infect Dis. 2011;204(8):1227-36. PubMed PMID: 21917896.
16. Longenecker CT, Jiang Y, Orringer CE, Gilkeson RC, Debanne S, Funderburg NT, Lederman MM, Storer N, Labbato DE, McComsey GA. Soluble CD14 is independently associated with coronary calcification and extent of subclinical vascular disease in treated HIV infection. AIDS. 2014;28(7):969-77. PubMed PMID: 24691204.
17. Burdo TH, Lentz MR, Autissier P, Krishnan A, Halpern E, Letendre S, Rosenberg ES, Ellis RJ, Williams KC. Soluble CD163 made by monocyte/macrophages is a novel marker of HIV activity in early and chronic infection prior to and after anti-retroviral therapy. J Infect Dis. 2011;204(1):154-63. PubMed PMID: 21628670.
18. Castley A, Berry C, French M, Fernandez S, Krueger R, Nolan D. Elevated plasma soluble CD14 and skewed CD16+ monocyte distribution persist despite normalisation of soluble CD163 and CXCL10 by effective HIV therapy: a changing paradigm for routine HIV laboratory monitoring? PLoS One. 2014;9(12):e115226. PubMed PMID: 25544986. Pubmed Central PMCID: PMC4278884. doi: 10.1371/journal.pone.0115226
19. Shikuma CM, Gangcuangco LMA, Killebrew DA, Libutti DE, Chow DC, Nakamoto BK, Liang CY, Milne CIP, Ndhlovu LC, Barbour JD, Shiramizu BT, Gerschenson M. The role of HIV and monocytes/macrophages in adipose tissue biology. J Acquir Immune Defic Syndr. 2014;65(2):151-9. PubMed PMID: 24091690.
20. McCausland MR, Juchnowski SM, Zidar DA, Kuritzkes DR, Andrade A, Sieg SF, Lederman MM, Funderburg NT. Altered Monocyte Phenotype in HIV-1 Infection Tends to Normalize with Integrase-Inhibitor-Based Antiretroviral Therapy. PLoS One. 2015;10(10):e0139474. PubMed PMID: 26430882.
21. Han J, Wang B, Han N, Zhao Y, Song C, Feng X, Mao Y, Zhang F, Zhao H, Zeng H. CD14(high)CD16(+) rather than CD14(low)CD16(+) monocytes correlate with disease progression in chronic HIV-infected patients. J Acquir Immune Defic Syndr. 2009;52(5):553-9. PubMed PMID: 19950429.
22. Kulkarni M, Bowman E, Gabriel J, Amburgy T, Mayne E, Zidar DA, Maierhofer C, Turner AN, Bazan JA, Koletar SL, Lederman MM, Sieg SF, Funderburg NT. Altered Monocyte and Endothelial Cell Adhesion Molecule Expression Is Linked to Vascular Inflammation in Human Immunodeficiency Virus Infection. Open Forum Infect Dis. 2016;3(4):ofw224. PubMed PMID: 28066794. Pubmed Central PMCID: PMC5198584. doi: 10.1093/ofid/ofw224
23. Gill AJ, Kolson DL. Chronic inflammation and the role for cofactors (hepatitis C, drug abuse, antiretroviral drug toxicity, aging) in HAND persistence. Curr HIV/AIDS Rep. 2014;11(3):325-35. PubMed PMID: 24929842. Pubmed Central PMCID: 4188391. doi: 10.1007/s11904-014-0210-3
24. Munoz-Moreno JA, Fumaz CR, Ferrer MJ, Prats A, Negredo E, Garolera M, Perez-Alvarez N, Molto J, Gomez G, Clotet B. Nadir CD4 cell count predicts neurocognitive impairment in HIV-infected patients. AIDS Res Hum Retroviruses. 2008;24(10):1301-7. PubMed PMID: 18844464. doi: 10.1089/aid.2007.0310
25. Zhang S. A comprehensive evaluation of SAM, the SAM R-package and a simple modification to improve its performance. BMC bioinformatics. 2007;8:230. PubMed PMID: 17603887.
26. Huang DW, Sherman BT, Lempicki RA. Systematic and integrative analysis of large gene lists using DAVID bioinformatics resources. Nat Protoc. 2009;4(1):44-57. PubMed PMID: 19131956.
27. Mootha VK, Lindgren CM, Eriksson K-F, Subramanian A, Sihag S, Lehar J, Puigserver P, Carlsson E, Ridderstrale M, Laurila E, Houstis N, Daly MJ, Patterson N, Mesirov JP, Golub TR, Tamayo P, Spiegelman B, Lander ES, Hirschhorn JN, Altshuler D, Groop LC. PGC-1alpha-responsive genes involved in oxidative phosphorylation are coordinately downregulated in human diabetes. Nat Genet. 2003;34(3):267-73. PubMed PMID: 12808457.
28. Schmittgen TD, Livak KJ. Analyzing real-time PCR data by the comparative C(T) method. Nat Protoc. 2008;3(6):1101-8. PubMed PMID: 18546601.
29. Almeida M, Cordero M, Almeida J, Orfao A. Persistent abnormalities in peripheral blood dendritic cells and monocytes from HIV-1-positive patients after 1 year of antiretroviral therapy. J Acquir Immune Defic Syndr. 2006;41(4):405-15. PubMed PMID: 16652047. doi: 10.1097/01.qai.0000209896.82255.d3
30. Funderburg NT, Zidar DA, Shive C, Lioi A, Mudd J, Musselwhite LW, Simon DI, Costa MA, Rodriguez B, Sieg SF, Lederman MM. Shared monocyte subset phenotypes in HIV-1 infection and in uninfected subjects with acute coronary syndrome. Blood. 2012;120(23):4599-608. PubMed PMID: 23065151. Pubmed Central PMCID: PMC3512236. doi: 10.1182/blood-2012-05-433946
31. Wong KL, Tai JJ, Wong WC, Han H, Sem X, Yeap WH, Kourilsky P, Wong SC. Gene expression profiling reveals the defining features of the classical, intermediate, and nonclassical human monocyte subsets. Blood. 2011;118(5):e16-31. PubMed PMID: 21653326. doi: 10.1182/blood-2010-12-326355
32. Wong KL, Yeap WH, Tai JJ, Ong SM, Dang TM, Wong SC. The three human monocyte subsets: implications for health and disease. Immunol Res. 2012;53(1-3):41-57. PubMed PMID: 22430559. doi: 10.1007/s12026-012-8297-3
33. Hileman CO, Kinley B, Scharen-Guivel V, Melbourne K, Szwarcberg J, Robinson J, Lederman MM, McComsey GA. Differential Reduction in Monocyte Activation and Vascular Inflammation With Integrase Inhibitor-Based Initial Antiretroviral Therapy Among HIV-Infected Individuals. J Infect Dis. 2015;212(3):345-54. PubMed PMID: 25583168.
34. Boasso A, Hardy AW, Landay AL, Martinson JL, Anderson SA, Dolan MJ, Clerici M, Shearer GM. PDL-1 upregulation on monocytes and T cells by HIV via type I interferon: restricted expression of type I interferon receptor by CCR5-expressing leukocytes. Clinical immunology (Orlando, Fla ). 2008;129(1):132-44. PubMed PMID: 18650129.
35. Said EA, Dupuy FP, Trautmann L, Zhang Y, Shi Y, El-Far M, Hill BJ, Noto A, Ancuta P, Peretz Y, Fonseca SG, Van Grevenynghe J, Boulassel MR, Bruneau J, Shoukry NH, Routy J-P, Douek DC, Haddad EK, Sekaly R-P. Programmed death-1-induced interleukin-10 production by monocytes impairs CD4+ T cell activation during HIV infection. Nat Med. 2010;16(4):452-9. PubMed PMID: 20208540.
36. Schechter ME, Andrade BB, He T, Richter GH, Tosh KW, Policicchio BB, Singh A, Raehtz KD, Sheikh V, Ma D, Brocca-Cofano E, Apetrei C, Tracy R, Ribeiro RM, Sher A, Francischetti IMB, Pandrea I, Sereti I. Inflammatory monocytes expressing tissue factor drive SIV and HIV coagulopathy. Sci Transl Med. 2017;9(405). PubMed PMID: 28855397. Pubmed Central PMCID: PMC5755598. doi: 10.1126/scitranslmed.aam5441
37. Kamat A, Lyons JL, Misra V, Uno H, Morgello S, Singer EJ, Gabuzda D. Monocyte activation markers in cerebrospinal fluid associated with impaired neurocognitive testing in advanced HIV infection. J Acquir Immune Defic Syndr. 2012;60(3):234-43. PubMed PMID: 22569268.
38. Knudsen TB, Ertner G, Petersen J, Moller HJ, Moestrup SK, Eugen-Olsen J, Kronborg G, Benfield T. Plasma Soluble CD163 Level Independently Predicts All-Cause Mortality in HIV-1-Infected Individuals. J Infect Dis. 2016. PubMed PMID: 27354366. doi: 10.1093/infdis/jiw263
39. Wilson EM, Singh A, Hullsiek KH, Gibson D, Henry WK, Lichtenstein K, Onen NF, Kojic E, Patel P, Brooks JT, Sereti I, Baker JV. Monocyte-activation phenotypes are associated with biomarkers of inflammation and coagulation in chronic HIV infection. J Infect Dis. 2014;210(9):1396-406. PubMed PMID: 24813472. Pubmed Central PMCID: 4207864. doi: 10.1093/infdis/jiu275
40. O'Halloran JA, Dunne E, Gurwith M, Lambert JS, Sheehan GJ, Feeney ER, Pozniak A, Reiss P, Kenny D, Mallon P. The effect of initiation of antiretroviral therapy on monocyte, endothelial and platelet function in HIV-1 infection. HIV Med. 2015;16(10):608-19. PubMed PMID: 26111187. doi: 10.1111/hiv.12270
41. Fu W, Sanders-Beer BE, Katz KS, Maglott DR, Pruitt KD, Ptak RG. Human immunodeficiency virus type 1, human protein interaction database at NCBI. Nucleic Acids Res. 2009;37(Database issue):D417-22. PubMed PMID: 18927109.
42. Ako-Adjei D, Fu W, Wallin C, Katz KS, Song G, Darji D, Brister JR, Ptak RG, Pruitt KD. HIV-1, human interaction database: current status and new features. Nucleic Acids Res. 2015;43(Database issue):D566-70. PubMed PMID: 25378338.
43. Sonza S, Mutimer HP, Oelrichs R, Jardine D, Harvey K, Dunne A, Purcell DF, Birch C, Crowe SM. Monocytes harbour replication-competent, non-latent HIV-1 in patients on highly active antiretroviral therapy. AIDS. 2001;15(1):17-22. PubMed PMID: 11192864.
44. Wu JQ, Sasse TR, Saksena MM, Saksena NK. Transcriptome analysis of primary monocytes from HIV-positive patients with differential responses to antiretroviral therapy. Virol J. 2013;10:361. PubMed PMID: 24370116. Pubmed Central PMCID: 3877975. doi: 10.1186/1743-422X-10-361
45. Gekonge B, Giri MS, Kossenkov AV, Nebozyhn M, Yousef M, Mounzer K, Showe L, Montaner LJ. Constitutive gene expression in monocytes from chronic HIV-1 infection overlaps with acute Toll-like receptor induced monocyte activation profiles. PLoS One. 2012;7(7):e41153. PubMed PMID: 22815948. Pubmed Central PMCID: 3399809. doi: 10.1371/journal.pone.0041153
46. Giri MS, Nebozyhn M, Raymond A, Gekonge B, Hancock A, Creer S, Nicols C, Yousef M, Foulkes AS, Mounzer K, Shull J, Silvestri G, Kostman J, Collman RG, Showe L, Montaner LJ. Circulating monocytes in HIV-1-infected viremic subjects exhibit an antiapoptosis gene signature and virus- and host-mediated apoptosis resistance. J Immunol. 2009;182(7):4459-70. PubMed PMID: 19299747. Pubmed Central PMCID: 2776064. doi: 10.4049/jimmunol.0801450
47. Milush JM, Long BR, Snyder-Cappione JE, Cappione AJ, 3rd, York VA, Ndhlovu LC, Lanier LL, Michaelsson J, Nixon DF. Functionally distinct subsets of human NK cells and monocyte/DC-like cells identified by coexpression of CD56, CD7, and CD4. Blood. 2009;114(23):4823-31. PubMed PMID: 19805616. Pubmed Central PMCID: 2786291. doi: 10.1182/blood-2009-04-216374
48. Krasselt M, Baerwald C, Wagner U, Rossol M. CD56+ monocytes have a dysregulated cytokine response to lipopolysaccharide and accumulate in rheumatoid arthritis and immunosenescence. Arthritis Res Ther. 2013;15(5):R139. PubMed PMID: 24286519.
49. Barska K, Kwiatkowska W, Knysz B, Arczynska K, Karczewski M, Witkiewicz W. The role of the tissue factor and its inhibitor in the development of subclinical atherosclerosis in people living with HIV. PLoS One. 2017;12(7):e0181533. PubMed PMID: 28749986. Pubmed Central PMCID: PMC5531520. doi: 10.1371/journal.pone.0181533
50. Bianconi V, Sahebkar A, Atkin SL, Pirro M. The regulation and importance of monocyte chemoattractant protein-1. Curr Opin Hematol. 2018;25(1):44-51. PubMed PMID: 28914666. doi: 10.1097/MOH.0000000000000389
51. Bose S, Cho J. Role of chemokine CCL2 and its receptor CCR2 in neurodegenerative diseases. Arch Pharm Res. 2013;36(9):1039-50. PubMed PMID: 23771498. doi: 10.1007/s12272-013-0161-z
52. Williams DW, Calderon TM, Lopez L, Carvallo-Torres L, Gaskill PJ, Eugenin EA, Morgello S, Berman JW. Mechanisms of HIV entry into the CNS: increased sensitivity of HIV infected CD14+CD16+ monocytes to CCL2 and key roles of CCR2, JAM-A, and ALCAM in diapedesis. PLoS One. 2013;8(7):e69270. PubMed PMID: 23922698. Pubmed Central PMCID: PMC3724935. doi: 10.1371/journal.pone.0069270
53. McKibben RA, Margolick JB, Grinspoon S, Li X, Palella FJ, Jr., Kingsley LA, Witt MD, George RT, Jacobson LP, Budoff M, Tracy RP, Brown TT, Post WS. Elevated levels of monocyte activation markers are associated with subclinical atherosclerosis in men with and those without HIV infection. J Infect Dis. 2015;211(8):1219-28. PubMed PMID: 25362192. Pubmed Central PMCID: PMC4402336. doi: 10.1093/infdis/jiu594
54. Dhillon NK, Williams R, Callen S, Zien C, Narayan O, Buch S. Roles of MCP-1 in development of HIV-dementia. Front Biosci. 2008;13:3913-8. PubMed PMID: 18508485. Pubmed Central PMCID: 2715276.
55. Sevigny JJ, Albert SM, McDermott MP, McArthur JC, Sacktor N, Conant K, Schifitto G, Selnes OA, Stern Y, McClernon DR, Palumbo D, Kieburtz K, Riggs G, Cohen B, Epstein LG, Marder K. Evaluation of HIV RNA and markers of immune activation as predictors of HIV-associated dementia. Neurology. 2004;63(11):2084-90. PubMed PMID: 15596754.
56. Floris-Moore M, Fayad ZA, Berman JW, Mani V, Schoenbaum EE, Klein RS, Weinshelbaum KB, Fuster V, Howard AA, Lo Y, Schecter AD. Association of HIV viral load with monocyte chemoattractant protein-1 and atherosclerosis burden measured by magnetic resonance imaging. AIDS. 2009;23(8):941-9. PubMed PMID: 19318907. Pubmed Central PMCID: 2786203. doi: 10.1097/QAD.0b013e328329c76b
57. Shikuma CM, Barbour JD, Ndhlovu LC, Keating SM, Norris PJ, Budoff M, Parikh N, Seto T, Gangcuangco LM, Ogata-Arakaki D, Chow D. Plasma monocyte chemoattractant protein-1 and tumor necrosis factor-alpha levels predict the presence of coronary artery calcium in HIV-infected individuals independent of traditional cardiovascular risk factors. AIDS Res Hum Retroviruses. 2014;30(2):142-6. PubMed PMID: 23984974. Pubmed Central PMCID: PMC3910454. doi: 10.1089/AID.2013.0183
58. Covino DA, Sabbatucci M, Fantuzzi L. The CCL2/CCR2 Axis in the Pathogenesis of HIV-1 Infection: A New Cellular Target for Therapy? Curr Drug Targets. 2016;17(1):76-110. PubMed PMID: 26687605. doi: 10.2174/138945011701151217110917
59. Di Prospero NA, Artis E, Andrade-Gordon P, Johnson DL, Vaccaro N, Xi L, Rothenberg P. CCR2 antagonism in patients with type 2 diabetes mellitus: a randomized, placebo-controlled study. Diabetes Obes Metab. 2014;16(11):1055-64. PubMed PMID: 24798870. doi: 10.1111/dom.12309
60. Kalliomaki J, Attal N, Jonzon B, Bach FW, Huizar K, Ratcliffe S, Eriksson B, Janecki M, Danilov A, Bouhassira D, Group APS. A randomized, double-blind, placebo-controlled trial of a chemokine receptor 2 (CCR2) antagonist in posttraumatic neuralgia. Pain. 2013;154(5):761-7. PubMed PMID: 23523116. doi: 10.1016/j.pain.2013.02.003
61. Lalezari J, Gathe J, Brinson C, Thompson M, Cohen C, Dejesus E, Galindez J, Ernst JA, Martin DE, Palleja SM. Safety, efficacy, and pharmacokinetics of TBR-652, a CCR5/CCR2 antagonist, in HIV-1-infected, treatment-experienced, CCR5 antagonist-naive subjects. J Acquir Immune Defic Syndr. 2011;57(2):118-25. PubMed PMID: 21317794. doi: 10.1097/QAI.0b013e318213c2c0
62. Sabbatucci M, Covino DA, Purificato C, Mallano A, Federico M, Lu J, Rinaldi AO, Pellegrini M, Bona R, Michelini Z, Cara A, Vella S, Gessani S, Andreotti M, Fantuzzi L. Endogenous CCL2 neutralization restricts HIV-1 replication in primary human macrophages by inhibiting viral DNA accumulation. Retrovirology. 2015;12:4. PubMed PMID: 25608886. Pubmed Central PMCID: PMC4314729. doi: 10.1186/s12977-014-0132-6
63. Oliver BG, Elliott JH, Price P, Phillips M, Cooper DA, French MA. Tuberculosis After Commencing Antiretroviral Therapy for HIV Infection Is Associated With Elevated CXCL9 and CXCL10 Responses to Mycobacterium tuberculosis Antigens. Jaids-Journal of Acquired Immune Deficiency Syndromes. 2012;61(3):287-92. PubMed PMID: WOS:000310519300009. doi: 10.1097/QAI.0b013e31826445ef
64. Chaturvedi S, Frame P, Newman SL. Macrophages from human immunodeficiency virus-positive persons are defective in host defense against Histoplasma capsulatum. J Infect Dis. 1995;171(2):320-7. PubMed PMID: 7844367. doi: 10.1093/infdis/171.2.320
65. Eales LJ, Moshtael O, Pinching AJ. Microbicidal activity of monocyte derived macrophages in AIDS and related disorders. Clin Exp Immunol. 1987;67(2):227-35. PubMed PMID: 3111759. Pubmed Central PMCID: PMC1542592.
66. Kanterman J, Sade-Feldman M, Baniyash M. New insights into chronic inflammation-induced immunosuppression. Semin Cancer Biol. 2012;22(4):307-18. PubMed PMID: 22387003. doi: 10.1016/j.semcancer.2012.02.008
67. Baniyash M, Sade-Feldman M, Kanterman J. Chronic inflammation and cancer: suppressing the suppressors. Cancer Immunol Immunother. 2014;63(1):11-20. PubMed PMID: 23990173. doi: 10.1007/s00262-013-1468-9
68. Wu JQ, Sasse TR, Wolkenstein G, Conceicao V, Saksena MM, Soedjono M, Perera SS, Wang B, Dwyer DE, Saksena NK. Transcriptome analysis of primary monocytes shows global down-regulation of genetic networks in HIV viremic patients versus long-term non-progressors. Virology. 2013;435(2):308-19. PubMed PMID: WOS:000313459200013. doi: 10.1016/j.virol.2012.10.026
69. Pulliam L, Sun B, Rempel H. Invasive chronic inflammatory monocyte phenotype in subjects with high HIV-1 viral load. J Neuroimmunol. 2004;157(1-2):93-8. PubMed PMID: WOS:000225869400013. doi: 10.1016/j.jneuroim.2004.08.039
70. Van den Bergh R, Florence E, Vlieghe E, Boonefaes T, Grooten J, Houthuys E, Tran HTT, Gali Y, De Baetselier P, Vanham G, Raes G. Transcriptome analysis of monocyte-HIV interactions. Retrovirology. 2010;7. PubMed PMID: WOS:000280297100001. Artn 53. doi: 10.1186/1742-4690-7-53
71. Wu JQ, Sasse TR, Saksena MM, Saksena NK. Transcriptome analysis of primary monocytes from HIV-positive patients with differential responses to antiretroviral therapy. Virol J. 2013;10. PubMed PMID: WOS:000330052200001. Artn 361. doi: 10.1186/1743-422x-10-361
72. Van den Bergh R, Florence E, Vlieghe E, Boonefaes T, Grooten J, Houthuys E, Tran HT, Gali Y, De Baetselier P, Vanham G, Raes G. Transcriptome analysis of monocyte-HIV interactions. Retrovirology. 2010;7:53. PubMed PMID: 20546557. Pubmed Central PMCID: PMC2900222. doi: 10.1186/1742-4690-7-53
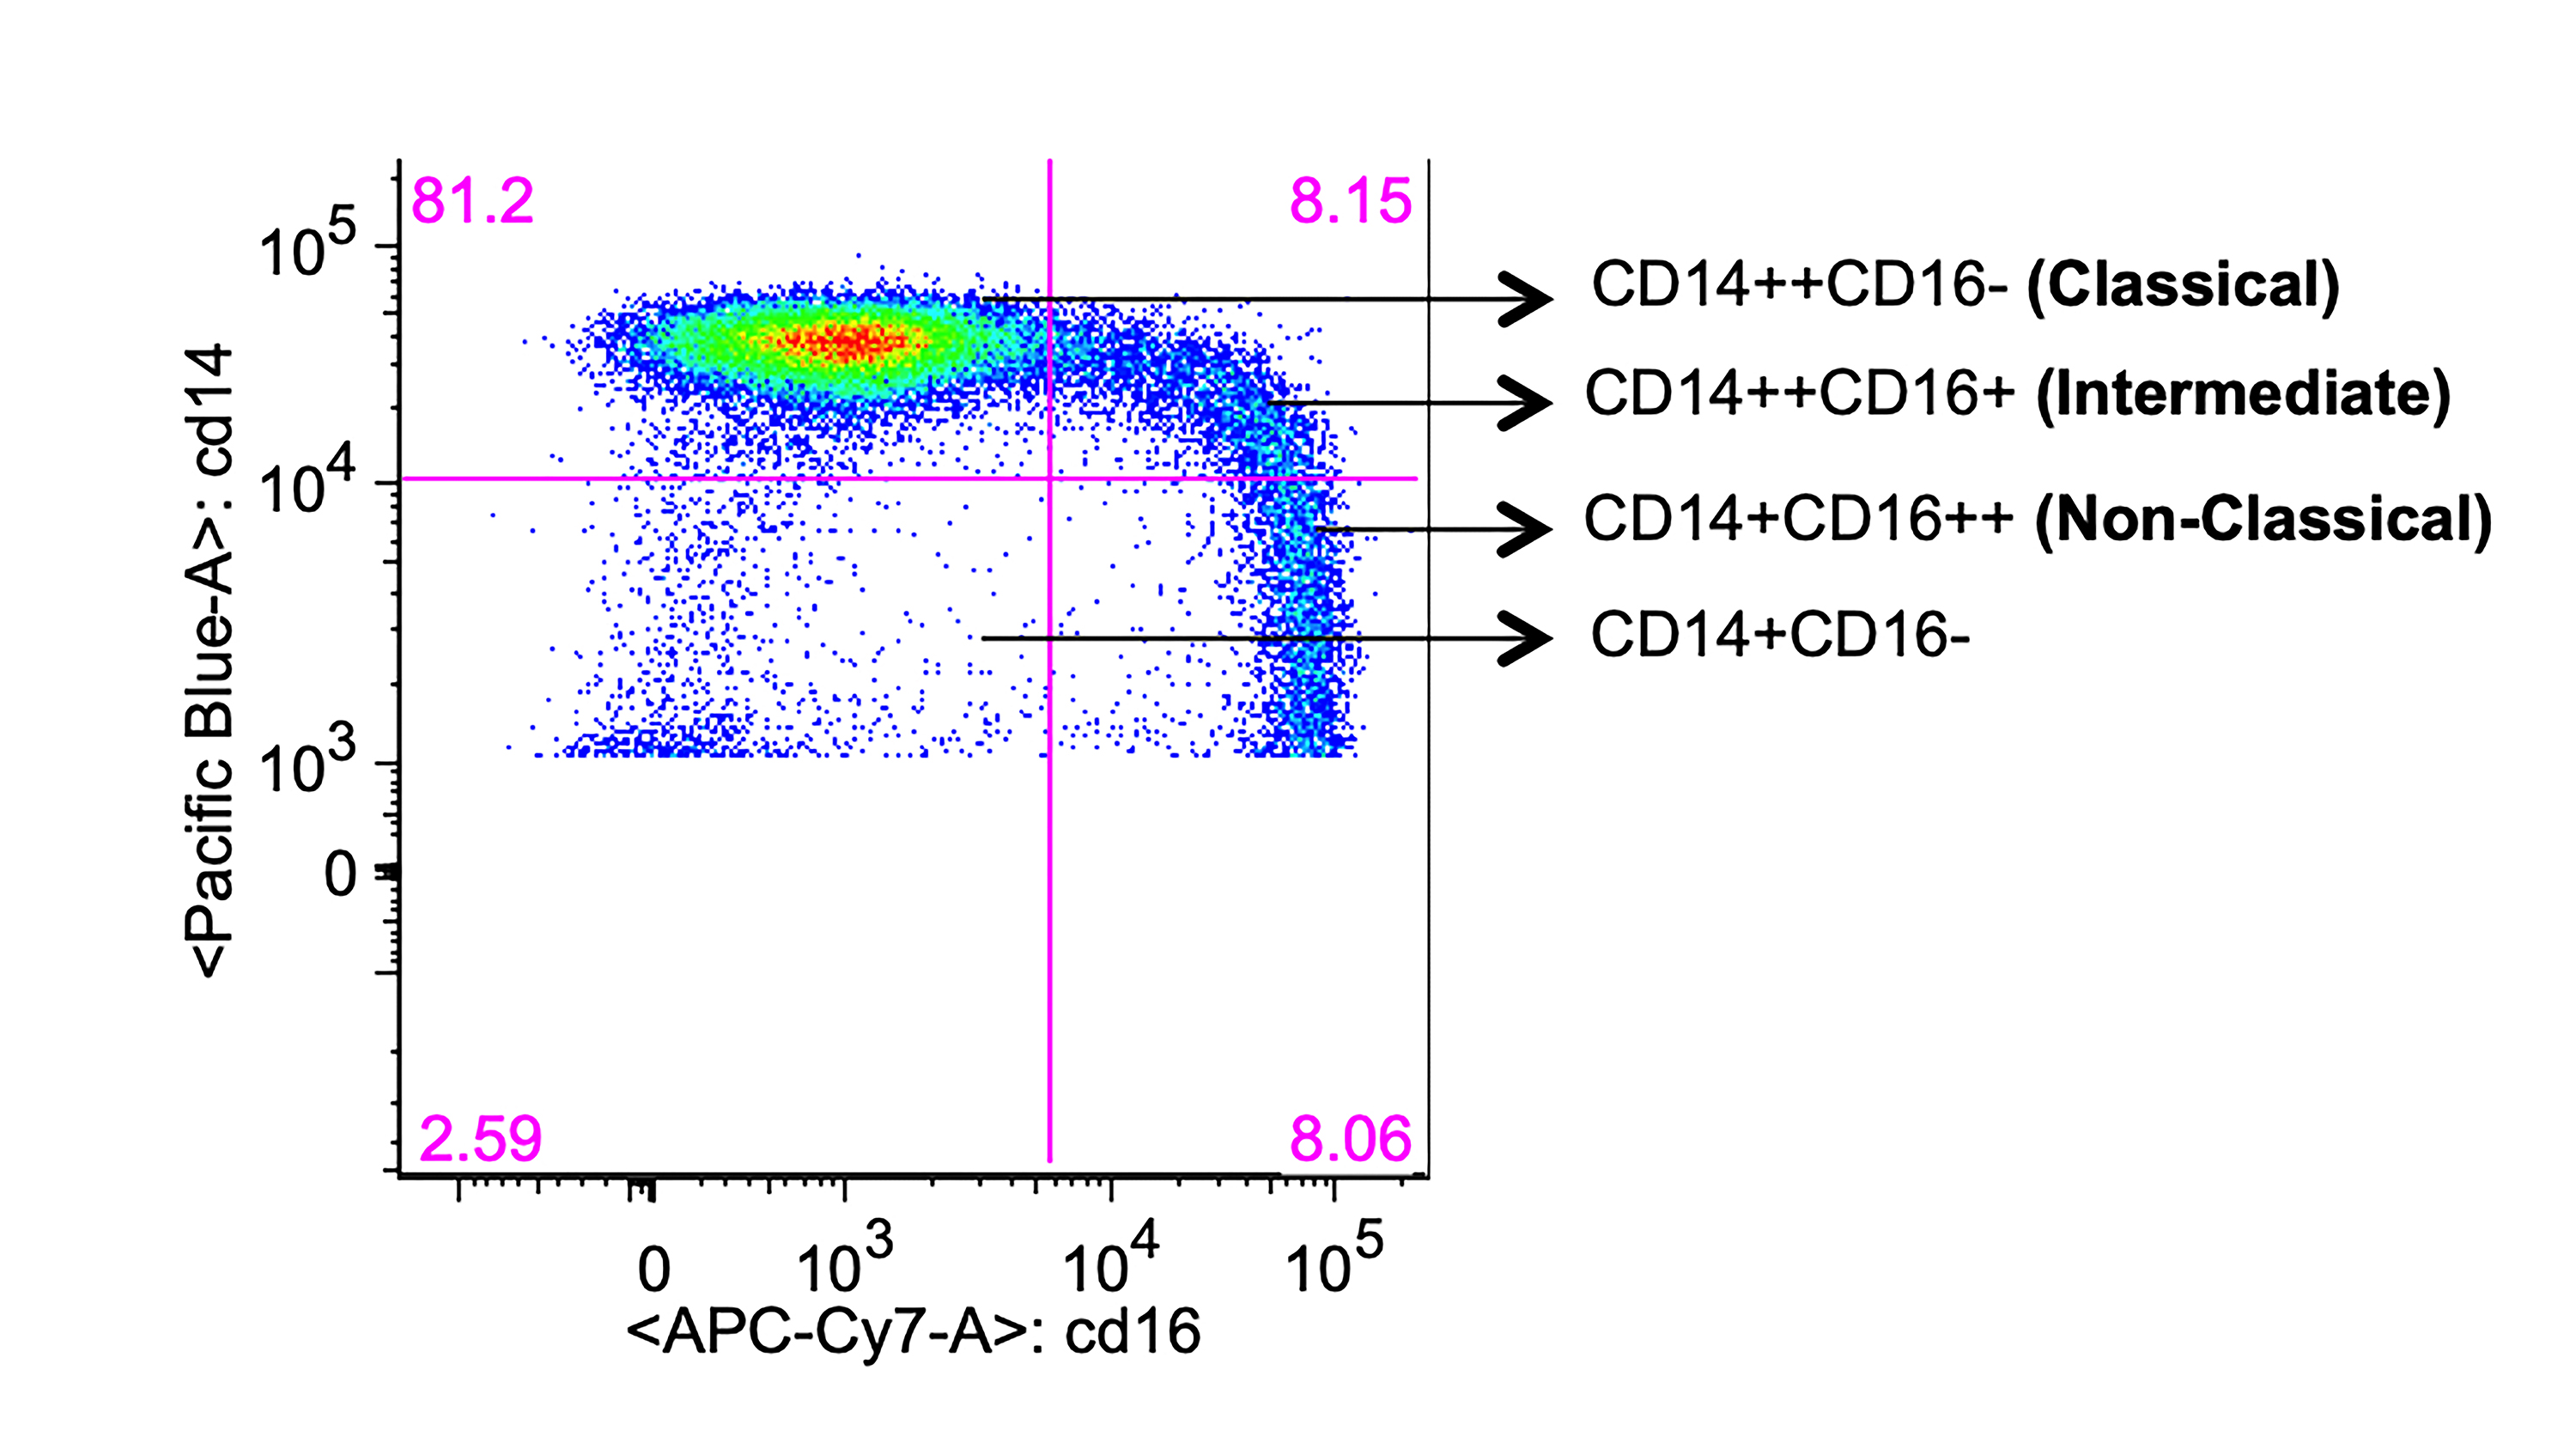
Supplementary Figure 1. Gating of monocyte subsets. Freshly isolated PBMCs from HIV+ and HIV- individuals were stained for monocyte surface markers and analyzed by flow cytometry. Representative dot plot showing monocyte subsets based on CD16 expression after gating on total CD14+ monocytes.
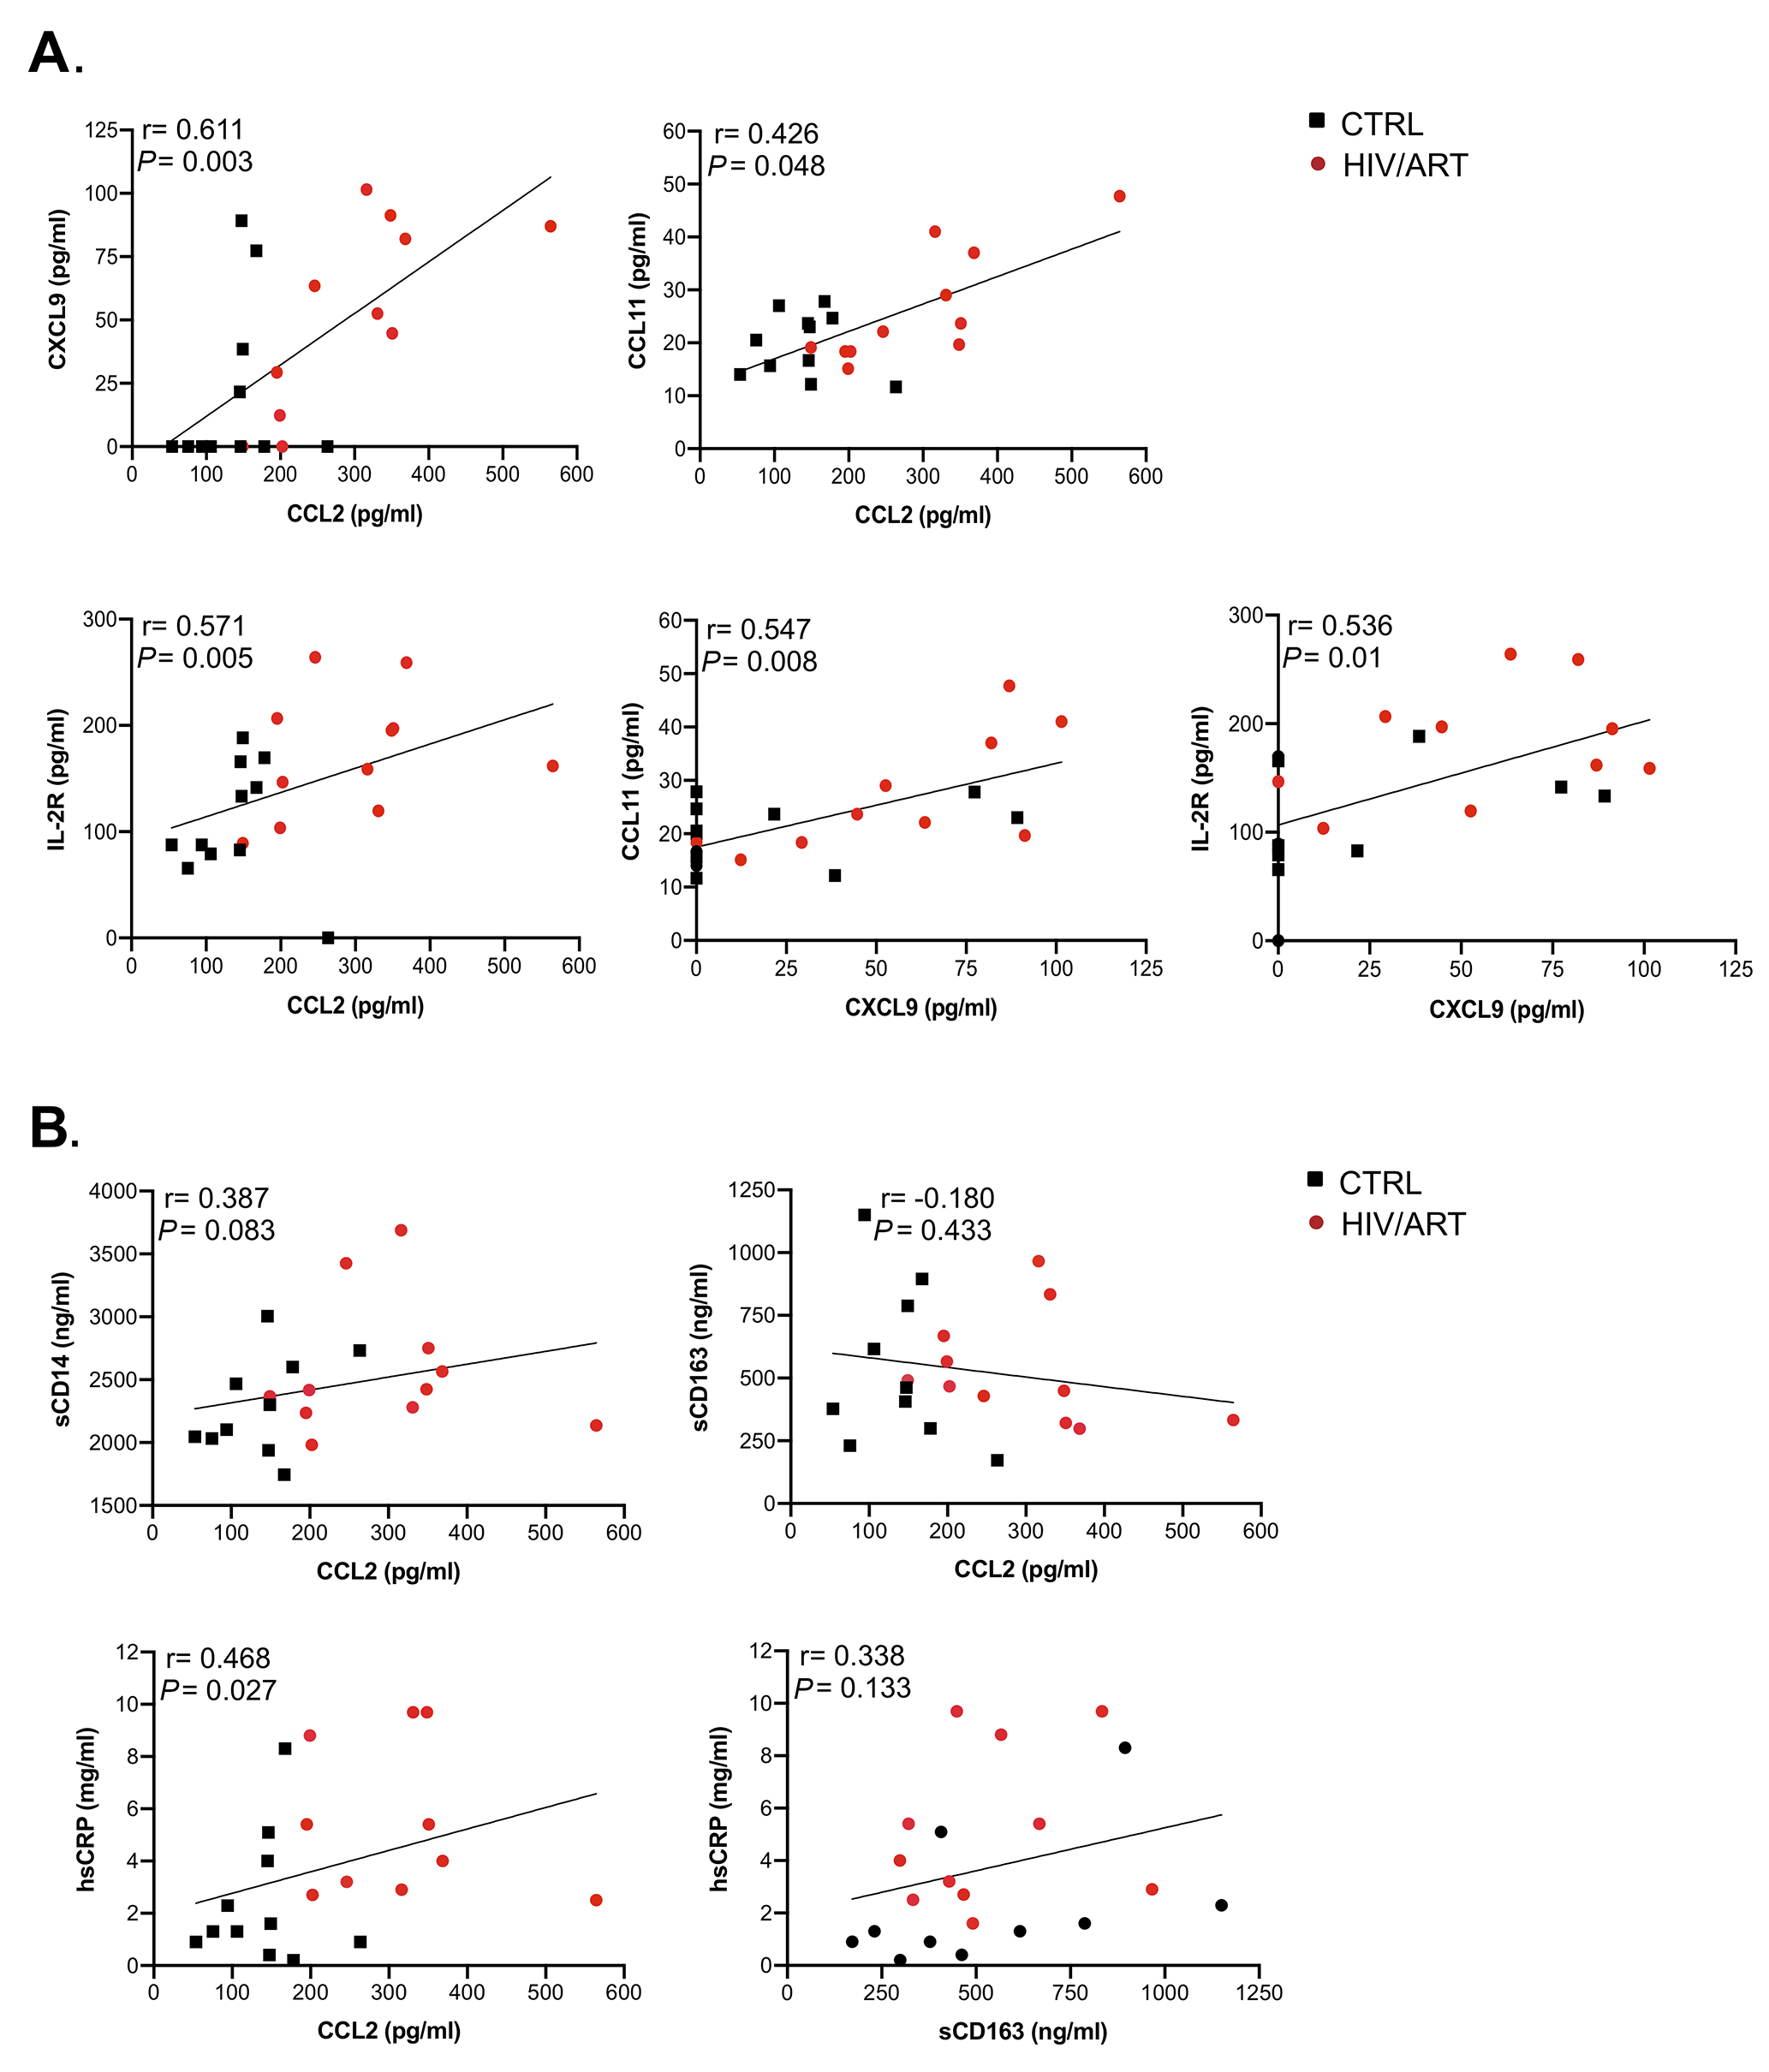
Supplementary Figure 2. Correlation analysis between soluble markers combining HIV/ART and HIV-negative participants. A Spearman correlation test was used to assess the significance of correlations between the measured parameters combining HIV/ART and HIV-negative participants. (A) Correlations between CXCL9, CCL2, CCL11, and IL-2R (sIL-2R). (B) Correlations between sCD14, CCL2, sCD163, and hsCRP. The correlation coefficient and significance values for each comparison are shown over each graph.
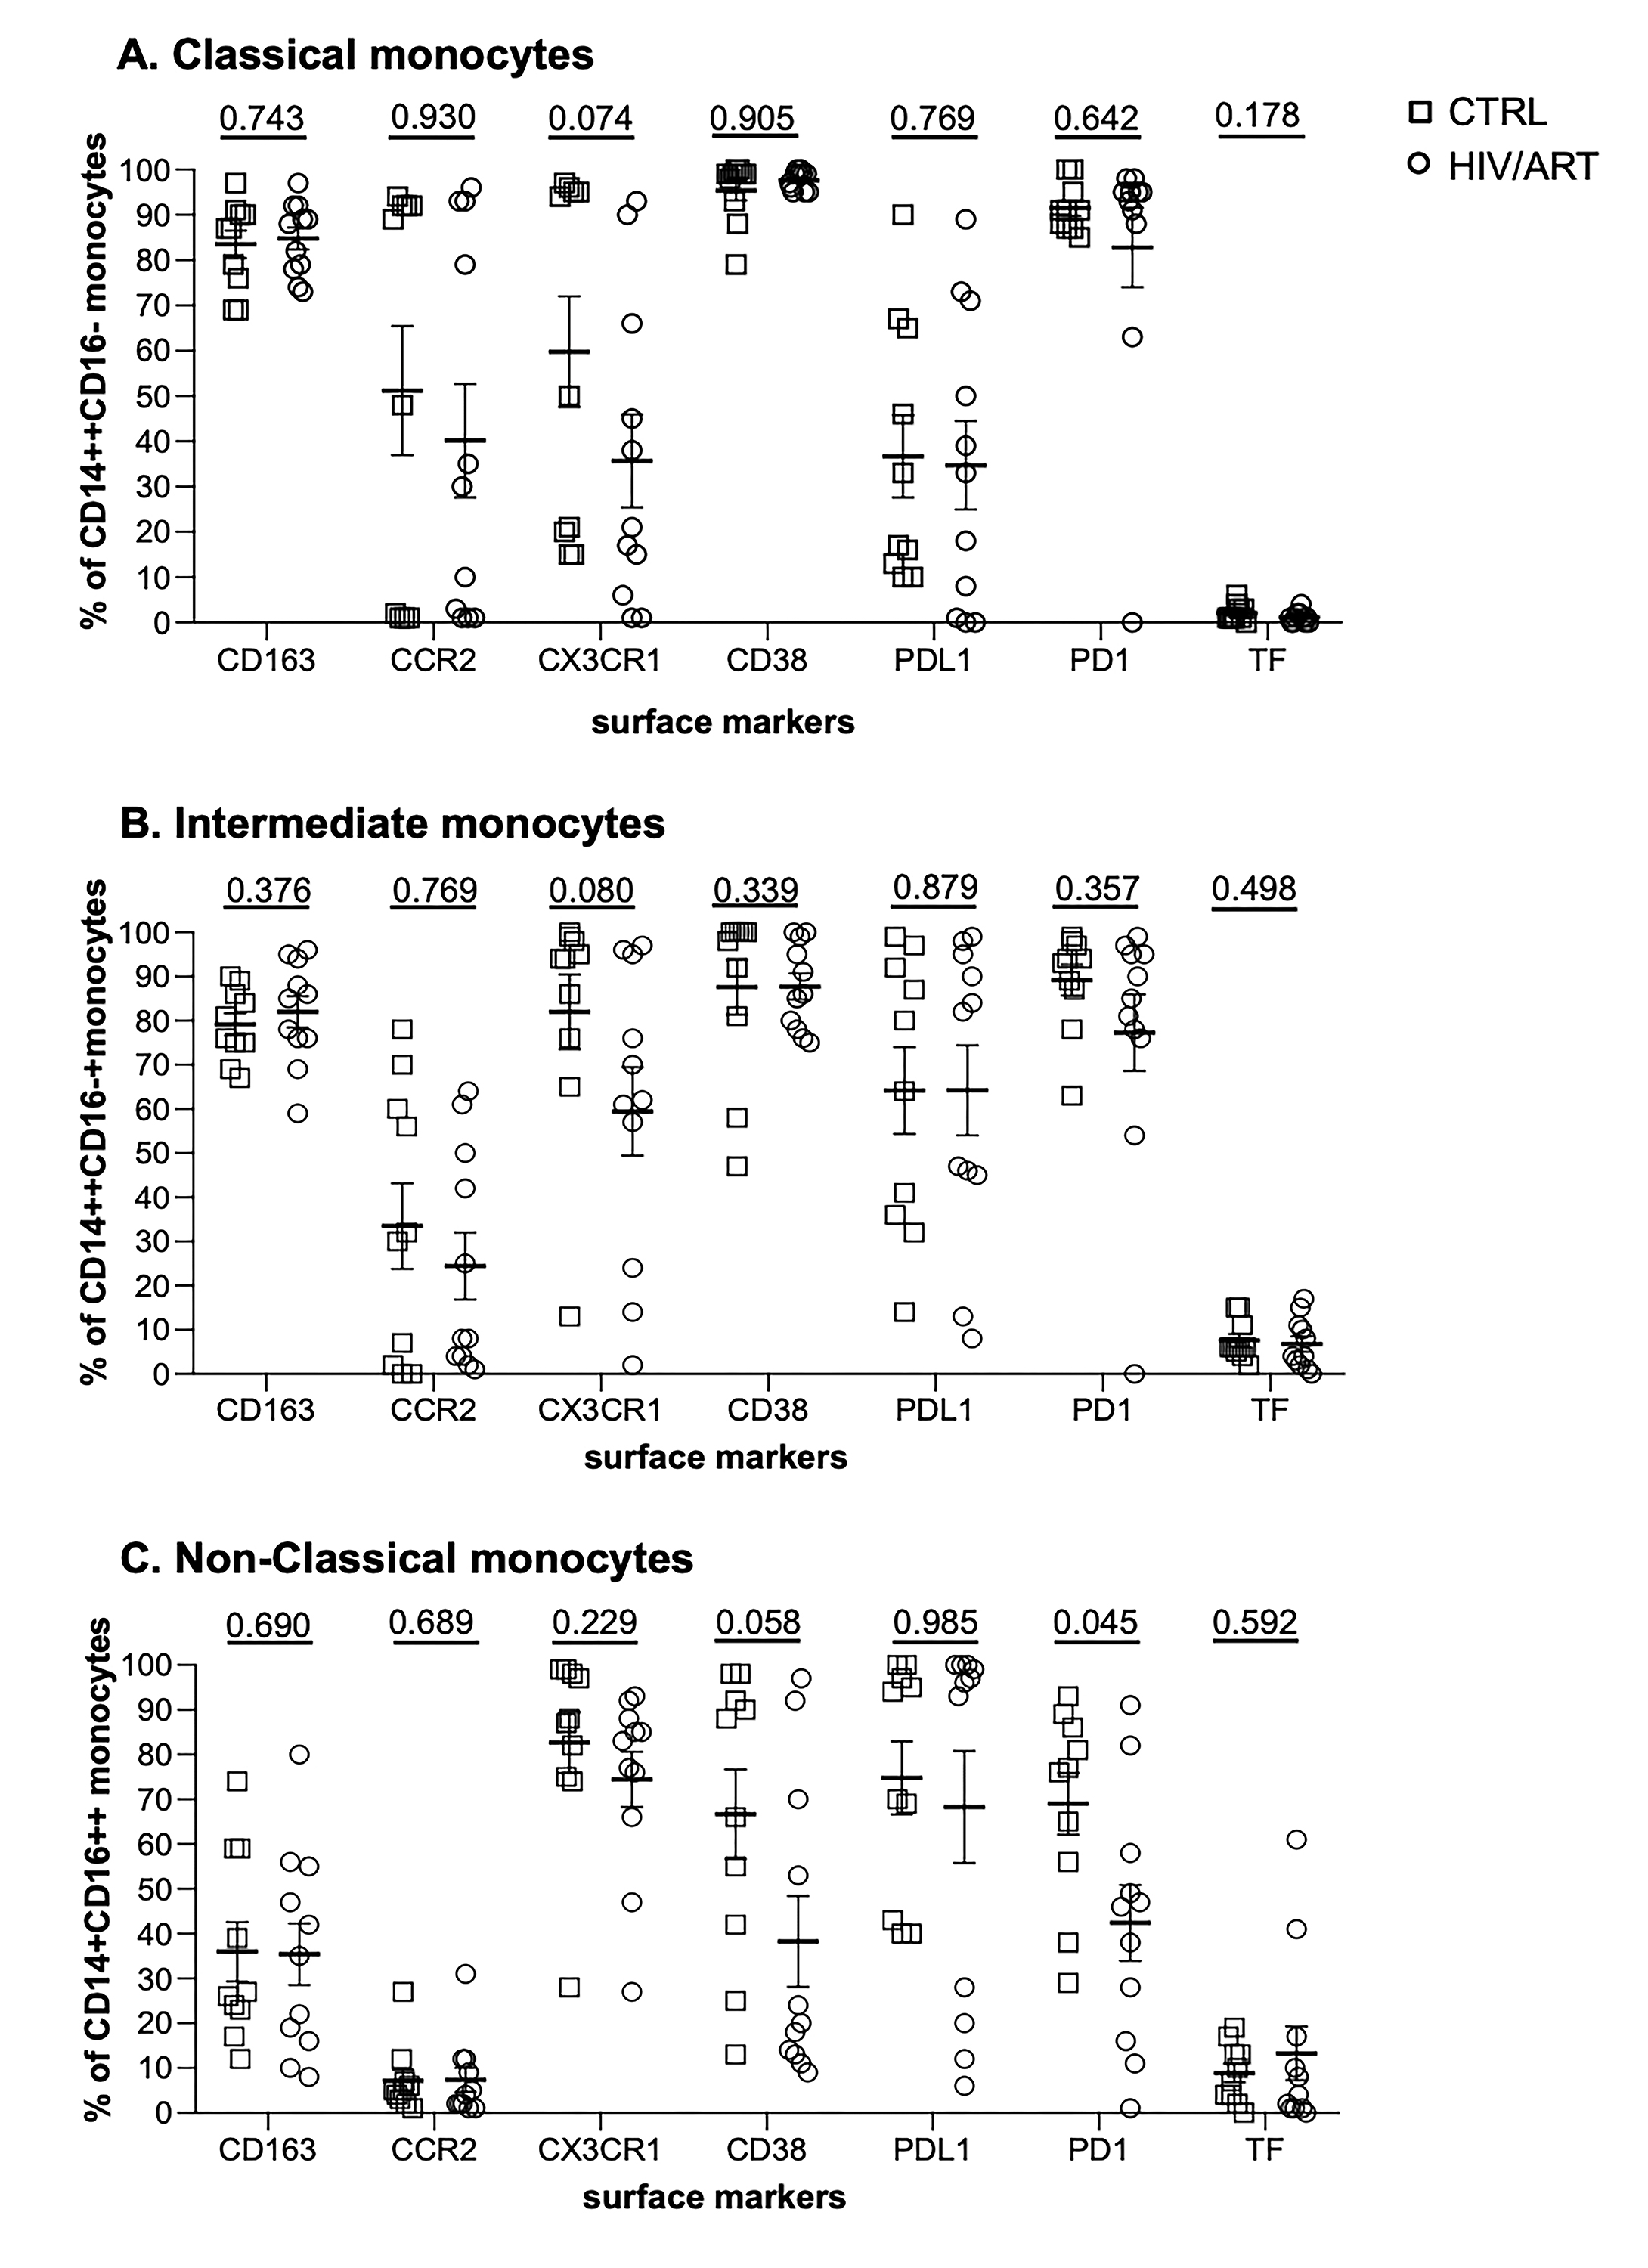
Supplementary Figure 3. Proportion of monocyte subsets expressing surface markers. (A) Percentage of classical (CD14++CD16-), (B) intermediate (CD14++CD16+), and (C) non-classical (CD14+CD16++) monocyte subsets from virally suppressed HIV/ART participants and matched HIV-negative controls expressing the indicated markers. Results are expressed as mean ± SE. P value is calculated using unpaired Mann Whitney U-test.
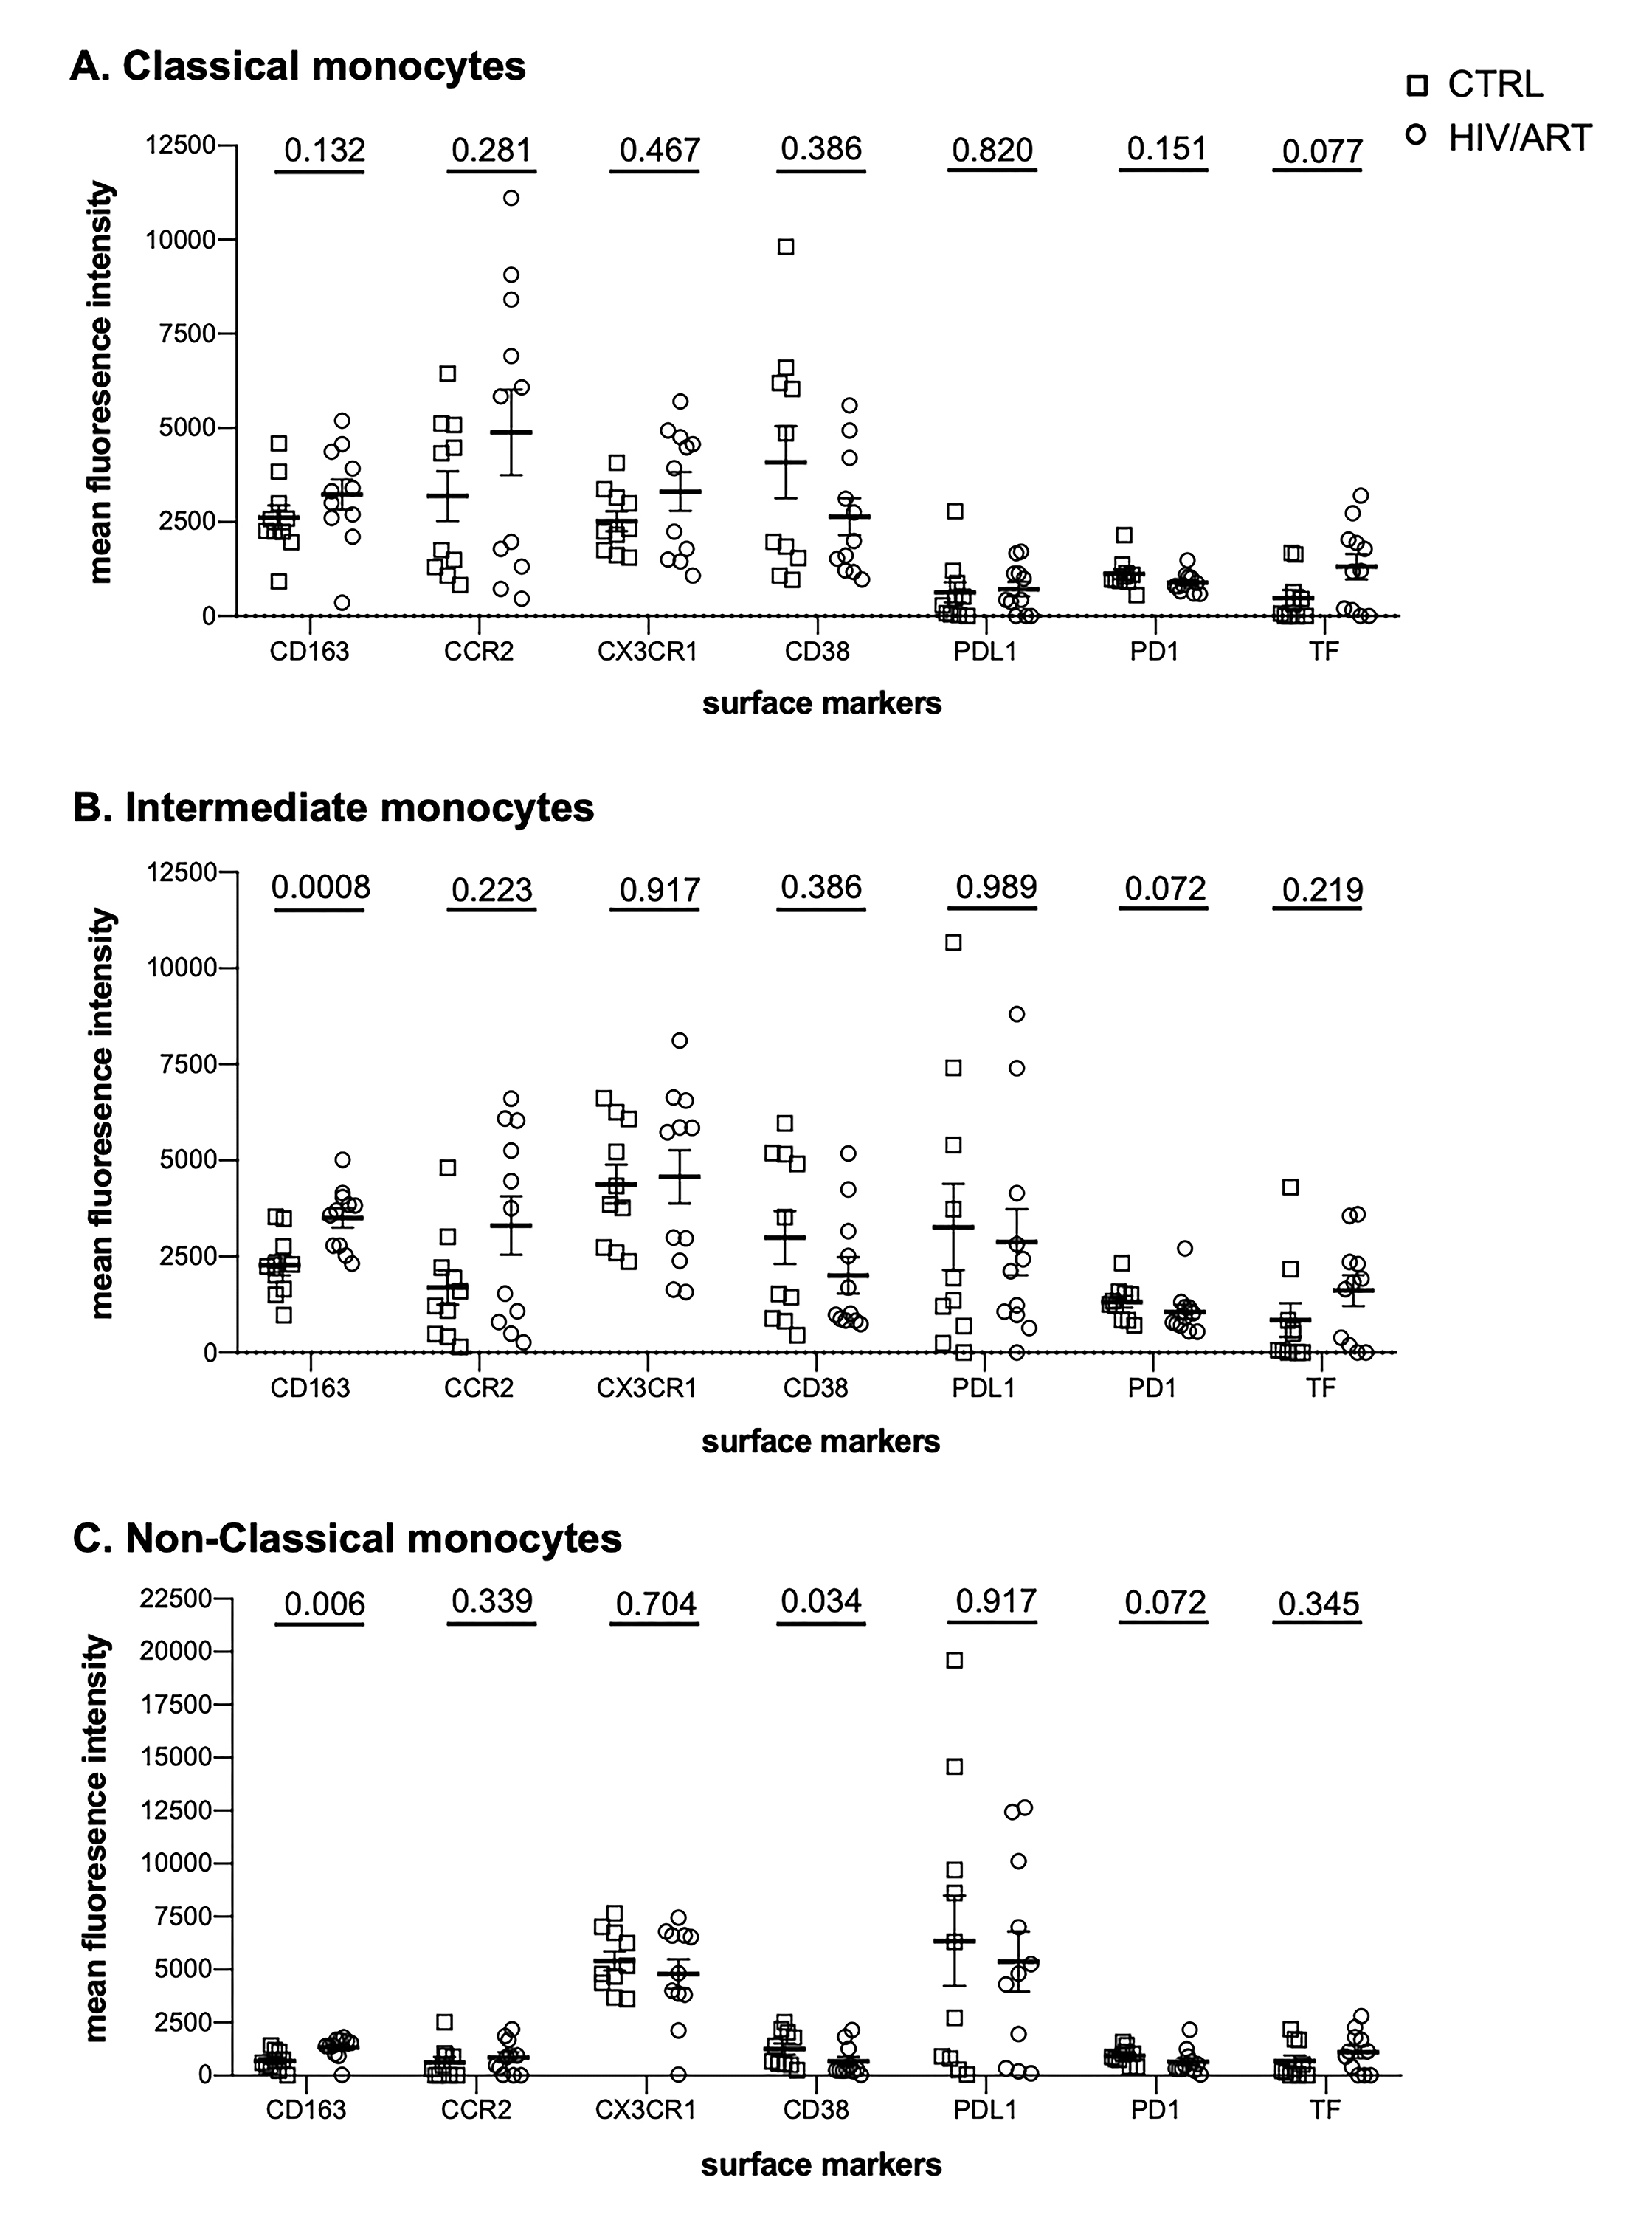
Supplementary Figure 4. Mean fluorescence intensity of surface markers on monocyte subsets. MFI of indicated markers on (A) classical (CD14++CD16-), (B) intermediate (CD14++CD16+), and (C) non-classical (CD14+CD16++) monocyte subsets from virally suppressed HIV/ART participants and matched HIV-negative controls. Results are expressed as mean ± SE. P value is calculated using unpaired Mann Whitney U-test.
Supplementary Table 1. HIV+ viremic monocyte donors baseline characteristics.
|
|
|
|
|
|
|
|
|
|
|
|
|
|
|
|
|
|
|
|
|
|
|
|
|
|
|
|
|
|
|
|
|
|
|
|
|
|
|
|
|
|
|
|
|
|
|
|
|
|
|
|
|
|
|
|
|
|
|
|
|
|
|
|
|
|
|
|
|
|
|
|
|
|
|
|
|
|
|
|
|
|
|
|
Gene expression data for HIV+ viremic individuals was obtained from [45, 46]. Table shows available clinical and demographic information.