Mark E. Obrenovich1,2,3,4*, George E. Jaskiw5,6, Thriveen Sankar Chittoor Mana2,6, Christina P. Bennett2, Jennifer Cadnum2, Curtis J. Donskey6,7
1
Pathology and Laboratory Medicine Service; Veterans Affairs Northeast Ohio
Healthcare System (VANEOHS); Cleveland, Ohio
2
Research Service; VANEOHS; Cleveland, Ohio
3
Department of Chemistry; Case Western Reserve University; Cleveland, Ohio
4
Department of Medicinal and Biological Chemistry; University of Toledo;
Toledo, Ohio
5
Psychiatry Service; VANEOHS; Cleveland, Ohio
6
School of Medicine; Case Western Reserve University; Cleveland, Ohio
7
Geriatric Research, Education and Clinical Center; VANEOHS; Cleveland, Ohio
George E. Jaskiw
Psychiatry Service 116(A)
VA Northeast Ohio Healthcare System
10701 East Blvd.
Cleveland, OH 44106
Telephone: 216-791-3800
Fax: 216 229-2396
gxj5@case.edu
ME Obrenovich, GE Jaskiw, TSC Mana, CP Bennett, J Cadnum, CJ Donskey. Urinary Metabolites of Green Tea as Potential Markers of Colonization Resistance to Pathogenic Gut Bacteria in Mice. Pathogens and Immunity. 2019;4(2):271-293. doi: 10.20411/pai.v4i2.335
Background: The gut microbiome (GMB) generates numerous chemicals that are absorbed systemically and excreted in urine. Antibiotics can disrupt the GMB ecosystem and weaken its resistance to colonization by enteric pathogens such as Clostridium difficile. If the changes in GMB composition and metabolism are sufficiently large, they can be reflected in the urinary metabolome. Characterizing these changes could provide a potentially valuable biomarker of the status of the GMB. While preliminary studies suggest such a possibility, the high level of data variance presents a challenge to translational applications. Since many GMB-generated chemicals are derived from the biotransformation of plant-derived dietary polyphenols, administering an oral precursor challenge should amplify GMB-dependent changes in urinary metabolites.
Methods: A course of antibiotics (clindamycin, piperacillin/tazobactam, or aztreonam) was administered SC daily (days 1 and 2) to mice receiving polyphenol-rich green tea in drinking water. Urine was collected at baseline as well as days 3, 7, and 11. Levels of pyrogallol and pyrocatechol, two phenolic molecules unequivocally GMB-dependent in humans but that had not been similarly examined in mice, were quantified.
Results: In confirmation of our hypothesis, differential changes in murine urinary pyrogallol levels identified the treatments (clindamycin, piperacillin/tazobactam) previously associated with a weakening of colonization resistance to Clostridium difficile. The changes in pyrocatechol levels did not withstand corrections for multiple comparisons.
Conclusions: In the mouse, urinary pyrogallol and, in all likelihood, pyrocatechol levels, are GMB-dependent and, in combination with precursor challenge, deserve further consideration as potential metabolomic biomarkers for the health and dysbiotic vulnerability of the GMB.
Keywords: microbiota; anaerobes; mice; clindamycin; aztreonam; piperacillin/tazobactam; polyphenols
A healthy gut microbiome (GMB) is critical to the maintenance of colonization resistance (CR), providing relative protection from overgrowth by endogenous enteric pathobionts [1, 2]. Antibiotics that reach the gut lumen can compromise CR, rendering the gut vulnerable to colonization and overgrowth by healthcare-associated pathogens such asClostridium difficile and vancomycin-resistantEnterococci (VRE) [3-5], resulting in substantial morbidity, mortality, and economic burden [6]. Accordingly, the development of an index that reflects the health of the GMB and particularly its relative CR, would be of significant clinical value.
The GMB generates numerous small molecules (< 2,000 Da) that enter the systemic circulation and are excreted in urine [7-9]. Since GMB-based processes can affect the synthesis, absorption, metabolism, and excretion of such compounds, antibiotic-induced dysbiosis may be reflected in the urinary metabolome. We initially reported that several GMB-associated urinary chemicals were significantly lower 24 hours after completion of a two-day course of antibiotics that compromises CR [10]. Subsequent studies demonstrated that urinary levels of several small phenolic molecules (SPMs) (ie, molecules MW < 2000 Da, possessing a phenolic ring) were also affected in an antibiotic-induced mouse model of dysbiosis [11]. Pyrocatechol (PC) and pyrogallol (PG) (Figure 1) are two SPMs thought to be generated through a relatively simple yet discrete pathway [12]. Both PG and PC appear in the urinary metabolome of humans, rodents, and other mammals [9, 13]. Both chemicals are unequivocally GMB-dependent in humans [12]. A PubMed search did not identify analogous studies in the mouse and only limited studies in the rat [14, 15]. Accordingly, we conducted exploratory studies on urinary PG and PC levels in antibiotic-treated mice. Although PG and PC showed the expected trends, the changes did not consistently reach statistical significance (Supplementary Figure 1). We attributed this in part to the high variance in metabolomic data [9].
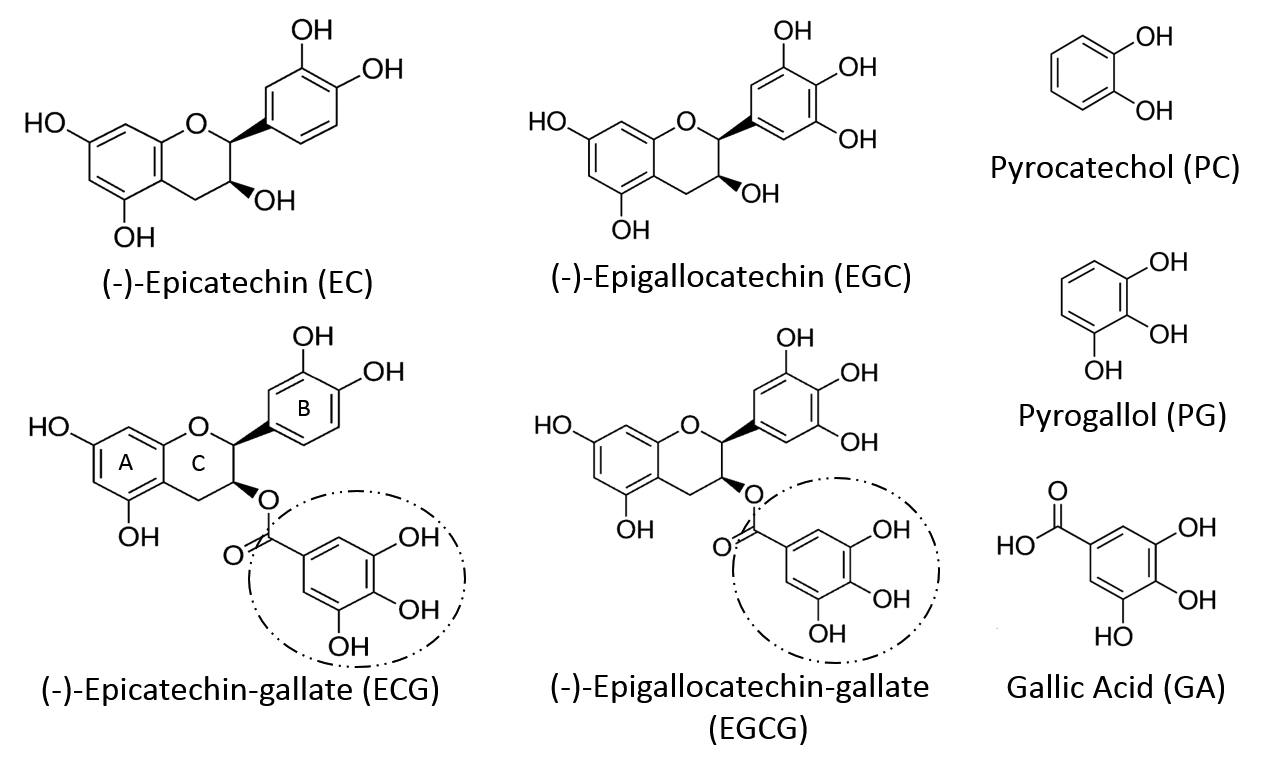
In response, we considered an appropriate challenge test to amplify the changes [16]. If the syntheses of PG and PC were sufficiently elevated, the dysbiotic GMB-mediated effect on the metabolome should be easier to detect. In mammals, many SPMs, including PG and PC, can be derived from the biotransformation of polyphenols or related dietary constituents [17]. Anaerobic bacteria such as Clostridium species, includingC. difficile, have been implicated in both routes [ 17-21]. Flavonoids constitute the largest group of dietary polyphenols [22], which despite their heterogeneity, are metabolized through a limited series of common metabolic steps in part mediated by the GMB [17, 23]. Indeed, the administration of flavonoids has been used to delineate such pathways [17, 24]. Green tea is a particularly attractive candidate in this regard. Its composition and metabolism have been well characterized. Four catechins, (-)-epicatechin (EC), (-)-epigallocatechin (EGC), (-)-epicatechin-3-O-gallate (ECG), and (-)- epigallocatechin-3-O-gallate (EGCG) (Figure 1) together comprise over 92% of all the flavonoids in brewed green tea [25] (Supplementary Table 1).
About one-third of ingested catechins are metabolized and absorbed in the small intestine. From there they enter the portal circulatory system and become vulnerable to hepatic metabolism and then fecal and/or urinary excretion. The remaining two-thirds reach the colon, where they can undergo bacterially mediated biotransformation (eg, dehydroxylation, demethylation) and then be metabolized into compounds that are either excreted in feces or absorbed systemically and excreted in urine [12, 26-28]. The bioavailability of green tea catechins is comparable in humans and in the mouse [29]. Antibiotic-treated mice have elevated plasma, serum, and tissue levels of several parent catechins, presumably due to inhibition of GMB-mediated biotransformation [30]. GT ingestion elevates urinary levels of PG and PC in individuals with an intact colon, but not in those with an ileostomy [12, 31], strongly implicating the GMB. Accordingly, we tested the hypothesis that antibiotic treatments previously shown to lower other SPM levels [10, 11], would potently suppress GT-augmented urinary PG and PC levels in the mouse.
The study protocol was approved by the Cleveland VA Medical Center’s Institutional Animal Care and Use Committee. Female CF-1 mice weighing 25–30 g (Harlan Sprague-Dawley, Indianapolis, IN) were housed 4-5 / cage with groups segregated by antibiotic treatment. All cages were in the same rack and subjected to the same husbandry in order to minimize cage effects. They were fed a sterilized Teklad Global 18% protein-extruded rodent diet (Harlan Teklad, Madison, WI) based on plant products, including soybean meal, brewer’s dry yeast, and wheat [32].
Fresh (GT) solution was prepared twice daily (8:00H and 17:00H) to coincide with the start of the lights on/off periods. One green tea bag (Kirkland®) was steeped for 3 min in 200 ml double-distilled water and then cooled before use. No inhibitors, preservatives, or metal chelators were added to the GT solution. In earlier studies, bacterial cultures were not found to appreciably affect end-product formation from tea (data not shown) [33].
Mice were conditioned to drink increasing concentrations of GT (increase by 20%/d) over one week preceding the start of antibiotic treatment, so that the target concentration ~(0.682 green tea catechin content [34]) was reached before and maintained through the period (days 0–11) of antibiotic treatment and urine collection. On days 1 and 2, groups (n = 5–8 mice/group) received subcutaneous (SC) injections (once daily at 11AM; 0.1 ml total volume) of either saline (SAL) or one of three antibiotic regimens: (1) clindamycin (CLIN) (15 mg/day); (2) piperacillin/tazobactam (PIP/TAZ) (8 mg/day); or (3) aztreonam (AZT) (3 mg/day). The antibiotic doses were selected to model typical clinical doses (mg/g body weight over 24 hours). CLIN and PIP/TAZ inhibit intestinal anaerobes, thus promoting the growth of C. difficile or other pathogens; AZT targets facultative gram-negative microorganisms but not anaerobes and does not promote pathogen colonization [3-5]. One group of mice did not receive either GT or antibiotic and acted as an additional control. Baseline urine samples for analysis were collected on day 1 (immediately preceding the first administration of antibiotics) and the collection repeated on days 3, 7, and 11.
On the morning of days 1 (pre-antibiotic baseline), 3, 7, and 11, mice were placed individually in clean, food-free, and bedding-free cages with Hydrogel® (for hydration) and observed continuously for one-hour periods until they produced ~100μL urine. Fresh urine specimens (100 μL aliquots) were collected in real time by pipette tip and transferred to sterile 1.5 ml Eppendorf tubes on wet ice until the end of the collection.
Stool and any urine in contact with stool was removed and the floor wiped continuously during the observation period. In addition, three types of controls were employed to rule out spurious contamination: (1) 100 μL (total) of sterile double-distilled water was placed across three different points on the floor of a clean individual cage and collected after 60 min; (2) 100 μL (total) of double-distilled water was placed across three different points on the floor and a mouse immediately introduced. Feces and urine were continuously removed over the following 60 min. The remaining water was then immediately collected and, (3) a mouse was placed into a clean cage. After 60 min both the mouse and all visible urine and feces were removed. 100 μL (total) of double-distilled water was placed across three different points on the floor and collected after an additional 60 min had elapsed. All specimens were quick-frozen on dry ice and then stored at –80°C until they were thawed for analysis.
Antibiotics were USP grade (Pfizer, New York). All chemicals and reagents were of the highest purity and grade commercially available. Standards were purchased from Sigma-Aldrich Co. LLC. (St. Louis, MO). LC-MS grade solvents: water; acetonitrile (ACN); formic acid; and methanol were purchased from Fisher Scientific (Pittsburgh, PA).
A standard stock solution containing all of the compounds of interest as well as the internal standards (1 mg/ml) was prepared in a suitable solvent (LC/MS grade water or methanol), initially blanketed with nitrogen gas, in glass vials equipped with Teflon®-lined screw caps and then stored at –20°C. The thawed stock solution was serially diluted to obtain work solutions in the range of 10-1000 ng/ml. To generate standard curves for quantitation of the metabolites, stripped urine was used as the matrix. In brief, 10 μL of the internal standard (1000 ng/ml) and 50 μL of stripped urine were added to each serially diluted standard, which was then brought to a final volume of 100 μL.
Thawed samples were centrifuged (13,000 g × 15 min at 8°C), hydrolyzed (β-glucuronidase and aryl sulfatase) for 24 h at 37°C per the manufacturer’s instructions (Roche Diagnostics GmbH, Mannheim, Germany). 10 μL of multiple internal standard were added to 100 μL of rodent urine [35]. The vials were either immediately processed or were weighed and refrozen at –80°C. Immediately prior to analysis, 500 μL of ice-cold 100% methanol were added to precipitate any possible protein. The sample was vortexed for 20 seconds; the supernatant was transferred to a clean 1.5-mL Eppendorf tube. It was brought to near-dryness using a Speed-Vac® centrifuge and then reconstituted with 100 μL of solvent (water + 0.01% formic acid),
Aliquots of 2 μL were placed in the autosampler (8°C). The analytic Shimadzu HPLC system (Shimadzu Kyoto, Japan) parameters were: Luna, C18 (3 um, ODS 100A, 2 × 150 mm) LC column (Phenomenex, Rancho Palos Verdes, CA) with an integrated guard column to minimize and/or eliminate cross-contamination by sample matrix between sample runs. Water injections were conducted with every 20 samples to monitor for possible carryover. Chromatography was performed at a constant flow of 0.3mL/min with the following parameters: nebulizing gas flow 3 L/min, heating gas flow 10 L/min, drying gas flow 10 L/min, interface temperature 300°C, DL temperature 250°C, heat block temperature 400°C, argon as the collision-induced dissociation (CID) gas. Eluents A (water + 0.01% formic acid) and B (acetonitrile + 0.01% formic acid) were used under gradient conditions at a flow rate of 0.3 mL/min. Isocratic elution with 100% A (0-2 min, followed by 100% A to 100% B; 2-8 min; 8-18 min, 100% B, 18-18.5 min, 100% B to 100% A; 18.5-26 min, 100% A) achieved separation of PG and PC. Second, 5μL of HPLC column effluent was introduced onto a Shimadzu 8050 triple quadruple MS system (Shimadzu, Kyoto, Japan) and analyzed using either positive or negative electrospray ionization (ESI) in the MRM mode. The data were analyzed using Liquid Chromatography Mass Spectrometry (LC/MS) software (LabSolutions®, Shimadzu, Kyoto, Japan). Levels of pyrogallol (PG) and pyrocatechol (PC) were measured.
Resulting data files were exported to our servers. The data were processed manually to authenticate metabolite spectra using retention index and mass spectrum information. Identified metabolites were reported if present in all of the samples (as defined in our method); the peak area ratios (unique ion/internal standard) were used for quantitation [10]. All values were within the limits of detection for the assay. Missing data were identified and replaced from raw data set files.
At each time point, levels of metabolites were subjected to a one-way ANOVA followed by pairwise comparisons with Bonferroni corrections. Because mice within treatment groups were not individually tracked through successive urine collections, a repeated measures analysis was not applicable. The significance level was set at P < 0.05.
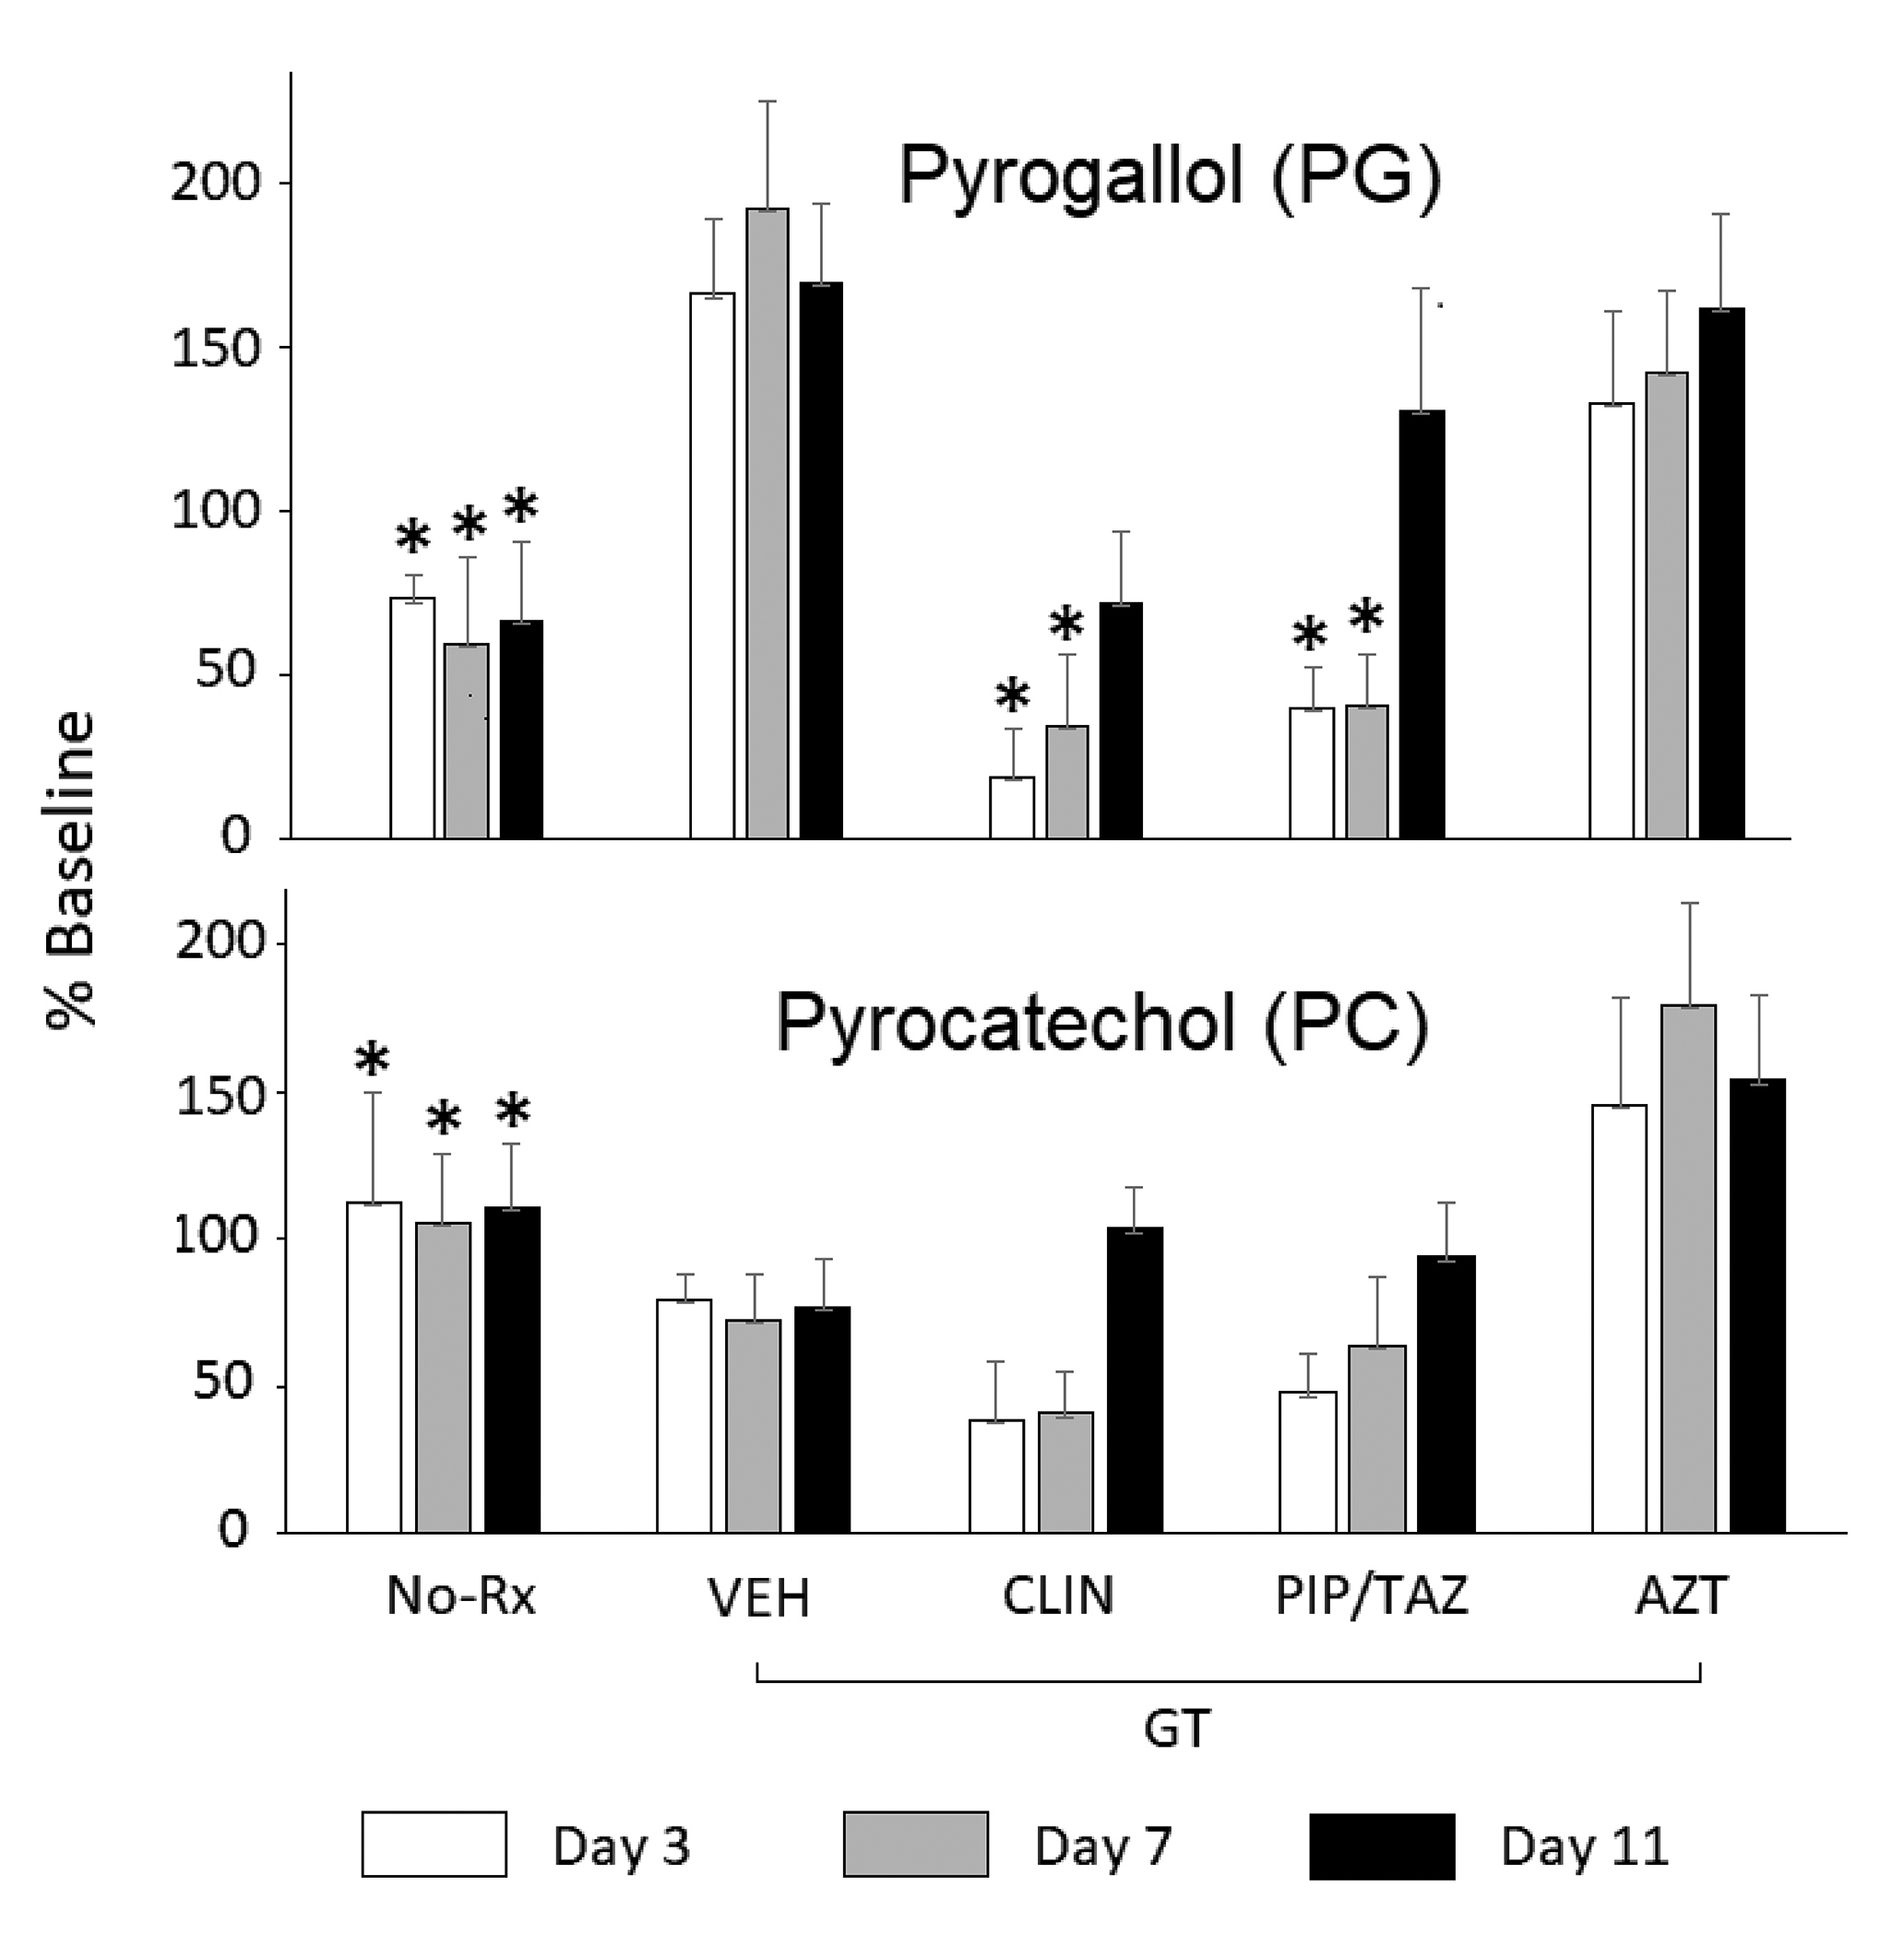
At baseline (day 0), that is, prior to the start of antibiotics, there were no significant differences in PG or PC levels across the treatment groups (Table 1, Figure 2). For PG, the overall ANOVA for PG day 3 showed a treatment effect (F(4,18) = 8.93, P < 0.0004). Bonferroni-adjusted pairwise comparisons showed that levels in mice treated with GT only were significantly different from those that in addition received CLIN (P < 0.01), PIP/T (P < 0.01) or no treatment at all (P < 0.01). In addition, PG levels in mice treated with AZT were significantly higher than those treated with CLIN (P < 0.05) or in the No-Rx group (P < 0.05) (Figure 2). The overall ANOVA for day 7 showed a treatment effect (F(4,20) = 7.59, P < 0.0007. Levels in mice treated with GT only were significantly different from those treated with CLIN (P < 0.04), PIP/TAZ (P < 0.01) or not treated at all (P < 0.01). AZT treated mice had higher levels than those that were not treated at all P < 0.05). The overall ANOVA for day 11 showed a significant treatment effect (F(4,20) = 3.85, P < 0.02). Significance was confined to the pairwise comparisons between the groups no-Rx vs GT (P < 0.05) and no-Rx vs AZT (P < 0.05).
|
ng/ml |
No-Rx VEH |
Green Tea (GT) |
|||
|
VEH |
CLIN |
PIP/TAZ |
AZT |
||
|
PG |
94.98 + 27.04 |
324.00 + 111.62 |
470.19 + 144.43 |
305.65 + 123.74 |
325.58 + 95.03 |
|
PC |
20.78 + 3.16 |
352.64 + 76.24 |
234.11 + 38.79 |
335.53 + 86.98 |
311.57 + 61.02 |
Baseline (day 0) urinary levels of pyrogallol (PG) and pyrocatechol (PC) in mice prior to the introduction of antibiotics. One group of mice (No-Rx) did not receive either green tea (GT) or antibiotics. Of the remaining groups, all received GT in drinking water and were assigned to additional treatment with either a saline vehicle (VEH), clindamycin (CLIN), piperacillin/tazobactam (PIP/TAZ), or aztreonam (AZT) on days 1–2. Mean + SEM.
For PC, the overall ANOVA for day 3 showed an overall effect of treatment (F(4,25) = 7.95, P < 0.0003). Bonferroni-adjusted pairwise comparisons showed that levels in mice treated only with GT were significantly different from those in mice that had no treatment at all (P < 0.01) (Figure 2). In addition, PC levels in mice treated with AZT were significantly higher than those not treated at all (P < 0.01) or those treated with CLIN (P < 0.01) or PIP/TAZ (P < 0.01). The overall ANOVA for day 7 showed an overall effect of treatment (F(4,25) = 9.77, P < 0.00007. Levels in mice treated with GT only were significantly different from those not treated at all (P < 0.05). AZT treated mice had higher levels than those not treated at all (P <0.01), or those treated with CLIN (P < 0.01) or PIP/TAZ (P < 0.01). The overall ANOVA for day 11 showed a significant treatment effect (F(4,22) = 7.94, P < 0.0004) that was evident in the pairwise comparisons between the groups no-Rx vs CLIN (P < 0.05) and no-Rx vs PIP/TAZ (P < 0.01). On each of days 3 and 7, PC levels in the GT group were significantly different from those in the CLIN group, as determined by uncorrected t-test. Trends for differences between mice treated with VEH and those treated with either AZT or PIP/TAZ did not withstand the correction for multiple comparisons.
After administration of polyphenol precursors, antibiotic effects on urinary levels of PG were clearly evident (Figure 2, Table 1). Furthermore, urinary PG levels were differentially affected by antibiotics previously shown to suppress versus not suppress intestinal anaerobes and promote colonization by healthcare-associated pathogens [3-5]. Specifically, CLIN and PIP/TAZ suppress anaerobes; treatment with these agents significantly lowered urinary PG levels. In contrast, treatment with AZT, which has little if any impact on anaerobes, did not lower levels of PG. The trends were similar but did not reach rigorous statistical significance in the case of PC. The data must be interpreted in light of experimental limitations and the multiple processes that can affect constituents of the urinary metabolome.
In the rat, orally administered EC is extensively glucuronidated and methylated by enterocytes of the small intestine during absorption, with the result that little free EC enters the portal circulation [22,36, 37]. The compound and metabolites then undergo hepatic sulfation and are additionally exposed to catechol-O-methyl transferase in the liver and kidney [37, 38]. Major phase II conjugation and metabolism processes include methylation; β-glucuronidation of hydroxyl-, carboxyl-, amino-, and thiol-groups; as well as sulfation of hydroxyl- and amino groups [17, 39]. In the rat, 18 different mono-, di-, and triconjugates of EC with various glucuronide, methyl, and sulfate moieties have been identified [40]. A fraction of those metabolites enter the systemic circulation and are renally excreted. The remainder enter bile where their levels peak within 2h of oral administration of the parent [41]. After reaching the small intestinal lumen, some compounds re-enter the enterohepatic circulation, while the rest are exposed to the GMB, which increase in density and diversity through the lower ileum and large intestine [17, 42].
Catechins share a common flavan structure consisting of two phenol rings (A and B) joined by a heterocyclic pyran ring (C) (Figure 1) [43, 44]. While no endogenous mammalian enzymes are known to cleave the “C” ring [13], mixed [17] as well as certain individual GMB constituents (eg, in the rat, Adlercreutzia equolifaciens, Eggerthella lenta, Flavonifractor plauti) [45] can do so. In vivo tracer studies using radio-labeled catechin demonstrate that, across species, (rat, guinea-pig, humans) the “B” ring is maintained within subsequent metabolites [46-48], with the exception of those chemicals derived exclusively from the galloyl moiety present in some members of the catechin family. Indeed, ECG and EGCG differ from EC and EGC in having an ester-linked galloyl moiety (Figure 1) which can be readily cleaved in in vivo to liberate free gallic acid (GA) [49]. Ingestion of foods or extracts containing either free or esterified GA [50, 51] elevates urinary levels of GA and its metabolites [52-54]. As far as GT is concerned, ECG and EGCG are the principal flavonoids and dominant sources of GA (Supplementary Table 1). The GA contribution from gallocatechin-gallate is negligible [12].
In mice receiving GT, broad-spectrum antibiotic-induced suppression of the GMB results in elevated serum and fecal levels of EGCG but lowered fecal levels of EGC, presumably due to such attenuated hydrolysis of the galloyl ester bond in EGCG [30]. Administration of theaflavin digallate, another dietary flavonoid esterified with gallate, elevates fecal excretion of GA levels in normal but not in germ-free mice [55]. Cultures of porcine GMB can generate GA from ECG or EGCG but not from EC or EGC [56]. Analogously, human fecal slurries or even individual Bifidobacterium strains can hydrolyze ECG or theaflavin digallate to generate GA [55, 57]. The single report that galloylated catechins are resistant to hydrolysis by cultures of rat feces [57] is difficult to reconcile with the demonstration that several bacterial strains isolated from rat GMB (Enterobacter aerogenes, Raoultella planticola, Klebsiella pneumoniae subsp. pneumoniae, Bifidobacterium longum subsp.Infantis) hydrolyze EGCG into the constituent EGC and GA [58]. Thus, as a general rule, the mammalian GMB appears to possess the capacity to hydrolyze galloylated flavonoids to generate free GA.
Free GA is then subject to additional biotransformations. In the rat, the rabbit, and in humans, orally administered GA is readily metabolized to urinary 4-O-methyl-GA [49,59, 60] as well as other metabolites [61]. Gavage with ECG or GA elevates urinary PG and/or its metabolites in the rat and rabbit, consistent with a simple decarboxylation of GA to PG [14,49,61, 62]. Two reports in the rat indicate that at least some of these steps can be suppressed by broad-spectrum antibiotics targeting the GMB [14, 15]. Analogous studies in the mouse are lacking but human data are more abundant.
Foods rich in free GA and/or galloyl-esterified flavonoids elevate excretion of PG and PC or their conjugates in healthy controls (Figure 1) [31, 63-65]. Ingestion of GT or grape juice elevates excretion of PG and/or PC in patients with an intact colon, but not in those with an ileostomy [12, 66]. While cultures of the GMB colonizing the remaining ileum can dehydroxylate GA to PG in vitro [67] this does not appear to be sufficient to affect urinary PG levels in vivo. Human fecal cultures are able to generate PC and/or PG from sources of GA or galloylated esters [12, 55, 57, 66, 68-71]. Several identified bacterial strains (Lactobacillus plantarum 299v, Bacillus subtilis) can decarboxylate GA to PG on their own [55, 72]. While the underlying reactions, and particularly the relationship between PG and PC remain to be fully characterized, the available data suggest a provisional pathway (Figure 3) [45].
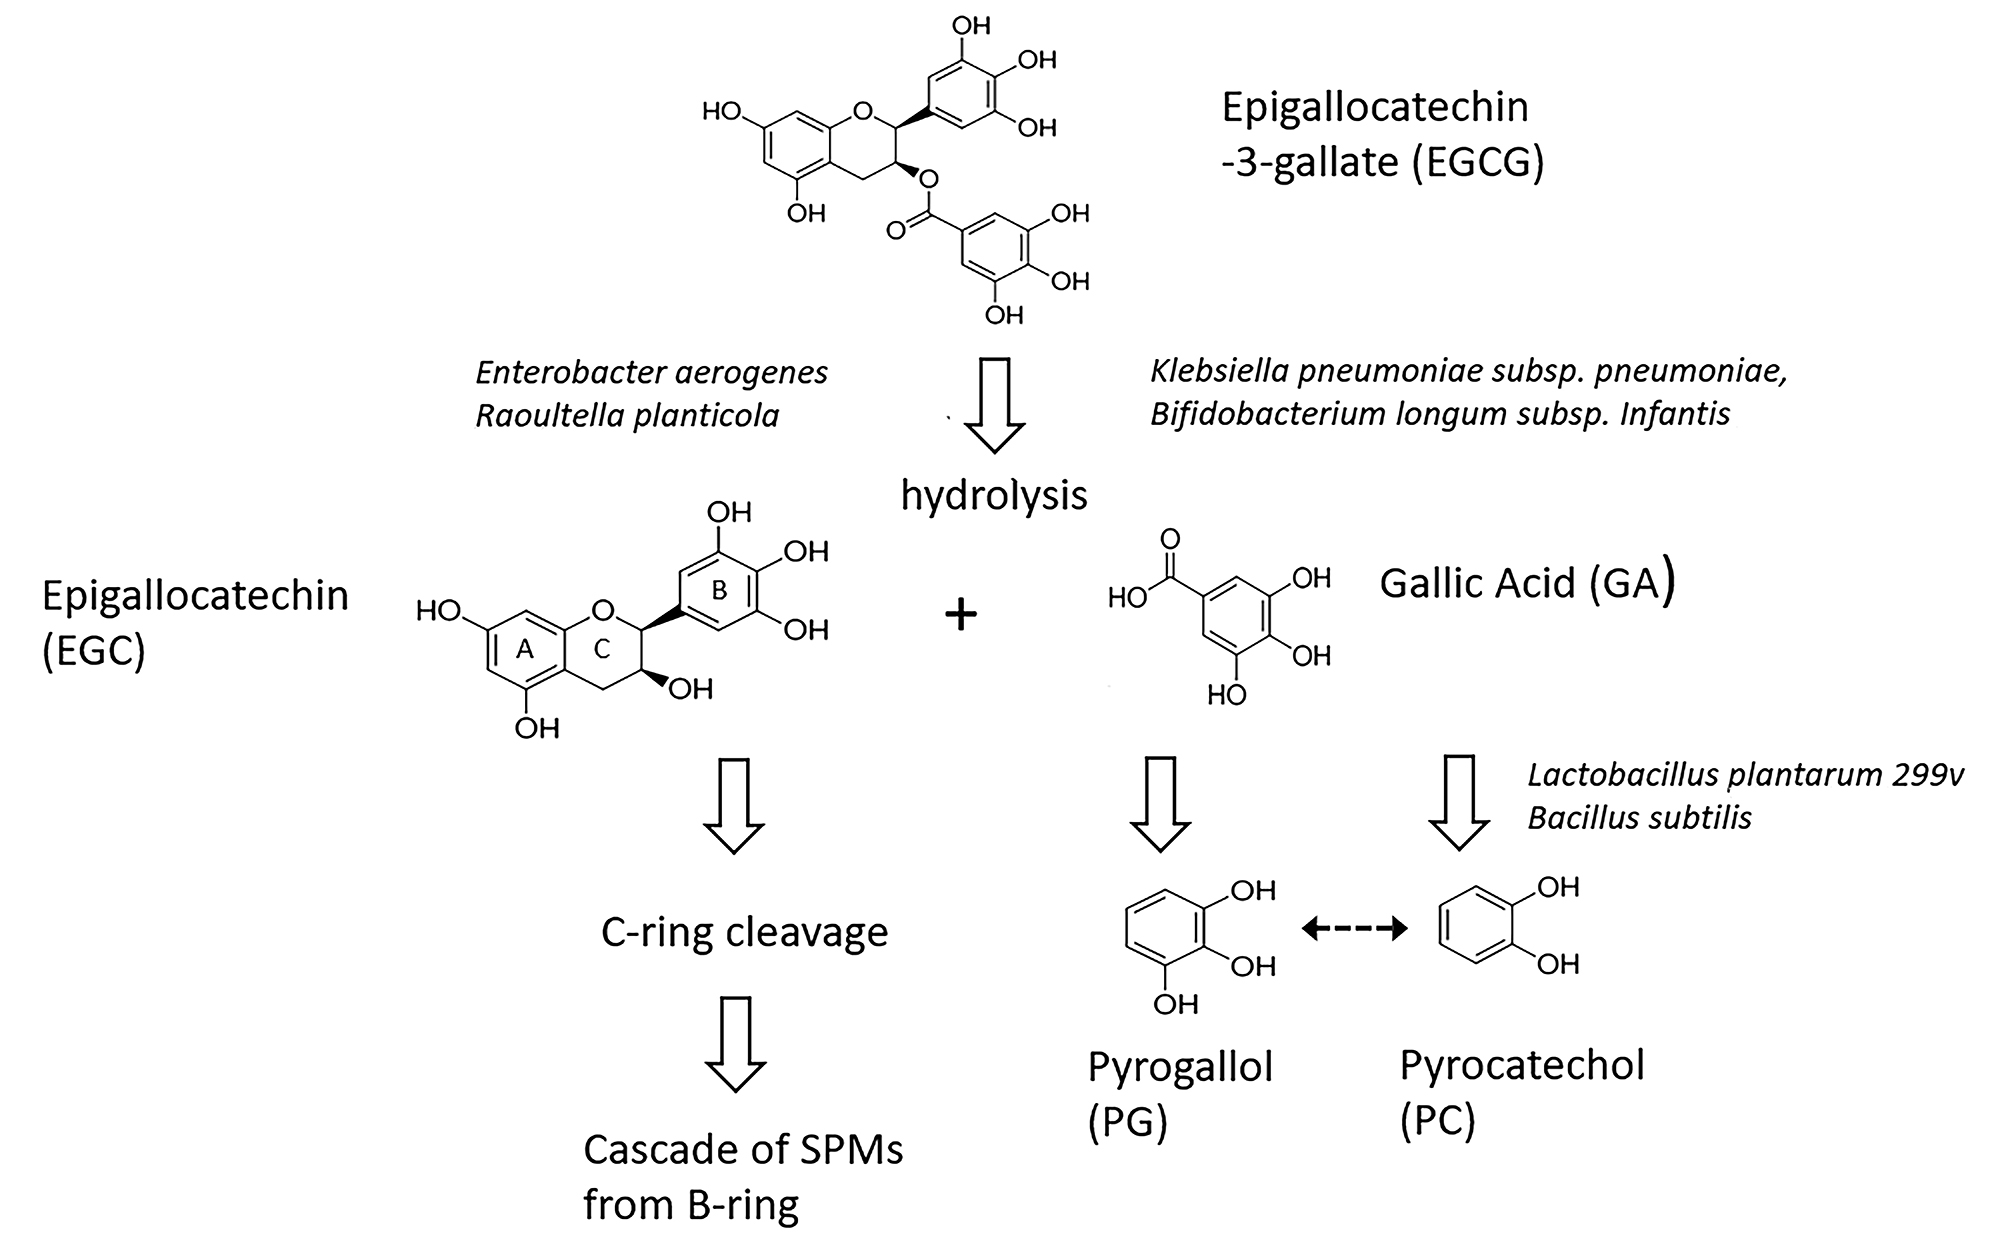
The data suggest that anaerobic bacteria, differentially suppressed by CLIN or PIP/TAZ vs AZT, are critically involved in generating PG and PC from the galloylated catechins. This suppression could act at any of several loci: (1) hydrolysis of EGCG and EG to release GA; (2) decarboxylation of GA to generate PG; or (3) possible interconversions of PC and PG (Figure 3). Most bacterial enzymatic capacities are expressed by multiple types of bacteria rather than being exclusive to a single genus [73]. Thus, the list of individual strains identified in the pathways of interest so far (Figure 3) [55, 58] should be considered preliminary. Given the diversity of reactions expressed in the GMB in vivo [73], additional pathways that generate PG or PC are certainly possible [74]. Nonetheless, we can conclude that an oral precursor rich in galloylated catechins markedly elevates urinary levels of PG in the mouse through a GMB-dependent mechanism.
Although the trends for PC were very similar to those for PG, the lowered PC levels did not reach statistical significance when a rigorous correction for multiple comparisons was imposed (Figure 2). By our estimate, had the number of mice per cell been doubled, the suppression of PC levels would have been significant. Similarly, had individual mice been tracked across sample collections, a repeated-measures analysis with its greater power could have been applied. Given translational considerations, we were seeking a highly robust index that would not depend on either large numbers of samples or conservative statistical methods to achieve significance. However, even with a precursor load that elevated PC and PG levels by up to 10-fold, substantial variance remained. Diet and the microbiome are major sources of such variance [17].
Our mice were fed a largely plant-based laboratory diet consisting of soybean meal, brewer’s dry yeast, and wheat [32]. Soybeans contain only low quantities of catechin and cinnamic acids [75] and brewer’s yeast does not contain polyphenolic precursors of PAs. Wheat and most other grains do, however, contain large amounts of ferulic acid [76, 77]. Ferulic acid, however, is not known to be converted in vivo to either PG or PC. Thus, the galloylated catechins in GT should constitute the dominant source of precursors for urinary PG and PC in our study.
We used an outbred mouse strain that is more robust, but also more microbially diverse than inbred strains [78]. Even in co-housed mice of the same strain, significant inter-individual variations in the effects of antibiotics on the GMB are evident [ 79]. We previously reported on GMB changes induced by common antibiotic regimens [5] but did not do so in this study. Accordingly, we cannot determine possible correlations between bacterial subtypes and the declines in PG or PC.
Both PC and PG have multiple conjugates. In humans, for instance, 9 urinary conjugates of PG have been identified after GT ingestion [80]. Most such chemicals are not commercially available for use as authentic standards. Accordingly, in the current study we hydrolyzed urine samples using both β-glucuronidase and aryl sulfatase before chemical analysis. The hydrolysis liberated PG and PC from glucuronidated and/or sulfated conjugates but not from methylated conjugates. We cannot preclude the possibility that one or another of these conjugates would have provided a more robust index of antibiotic effects. We observed that levels of PG in the animals treated only with green tea were non-significantly elevated (~150%) relative to their pretreatment baseline (Figure 2). This may be attributable to the initial continuous rise in plasma catechins during administration of tea polyphenols to rodents [81].
Since flavonoids and their metabolites undergo hepatic biotransformation [17], changes in hepatic function can also affect their kinetics. Usual doses of most antibiotics, however, generally have little effect on hepatic function [82]. While high IV or IP doses of PG can inhibit catechol-O-methyl-transferase [83] as well as sulfation [84], whether PG levels (< 8 μM in the rat) generated by oral precursors [85] possess meaningful bioactivity is not known. Finally, we evaluated only female mice, in keeping with the larger body of work from our laboratory (CJD). Extrapolation of our findings to male mice should be made cautiously in light of potential gender-specific effects of antibiotics on the GMB [86].
Our group had previously demonstrated that treatment with CLIN or PIP/TAZ weakened CR to overgrowth by C. difficile [3-5]. Evaluation of the corresponding urinary metabolome showed suppressed levels of 3,2-hydroxyphenylpropionic acid (3,2-HPPA) as well as of 3,3-HPPA and 3,4-HPPA, SPMs known to be at least partially derived by the GMB through C-ring cleavage of dietary flavonoids (Figure 3) [11]. Our current data expand on this, indicating that urinary PG, more robustly than PC, is also lower in association with compromised CR. Several next steps are possible. Given that both PG and PC are derived from GA, the administration of the purely galloylated moieties ECG and EGCG or even pure GA could be considered for precursor loading. One risk with GA loading is that this chemical itself possesses antibacterial activity [87] and, at higher concentrations, can inhibit its own GMB-mediated metabolism [56]. A similar effect in vivo cannot be precluded. Another approach would be to administer GT and to simultaneously measure both those SPMs derived from C-ring cleavage as well as those derived from hydrolysis of galloylated catechins (Figure 3). The results could suggest a broader biomarker panel.
We conclude that urinary PG and PC levels in the mouse are GMB-dependent, and that this dependence may be amplified by precursor loading. Such an effect may be even larger in humans, in whom the relative increase in urinary PG levels after GT ingestion exceeds those of any other metabolite [31]. The data linking PG and PC levels in humans to the GMB are particularly robust [12, 55, 57, 66, 68-71]. Our results build on earlier studies in which oral administration of flavonoid-rich dietary constituents, whether in the form of natural food products (eg, green tea, coffee, fruit juice) or as purified supplements (eg, catechin, quercetin) was used to delineate metabolism of polyphenols in rodents and humans [31, 47, 48, 59, 64]. Insofar as steps in that metabolism necessarily involve the GMB, appropriate precursor loading may facilitate development of clinically useful indices, including the degree of vulnerability to overgrowth by pathogenic anaerobic bacteria. Since both PC and PG reach the central nervous system [88] and can affect cerebral monoamine levels [89], possible neuropsychiatric effects should also be explored.
This work was supported by the Research Service of the VA Northeast Ohio Healthcare System and by a grant from the VISN 10 Research Initiative Program (to CJD and GEJ). The manuscript content is solely the responsibility of the authors and does not necessarily represent the official views of the Department of Veterans Affairs and/or the authors’ employers and/or their academically affiliated institutions.
Curtis J. Donskey has received research funding from Clorox, GOJO, Pfizer, Avery Dennison, PDI, and Boehringer Laboratories. He also serves as an associate editor for Pathogens and Immunity. All other authors report no relevant conflicts of interest.
1. Kamada N, Chen GY, Inohara N, Nunez G. Control of pathogens and pathobionts by the gut microbiota. Nature Immunology. 2013;14(7):685-90. PubMed PMID: 23778796. Pubmed Central PMCID: PMC4083503. doi: 10.1038/ni.2608
2. Baumler AJ, Sperandio V. Interactions between the microbiota and pathogenic bacteria in the gut. Nature. 2016;535(7610):85-93. PubMed PMID: 27383983. Pubmed Central PMCID: PMC5114849. doi: 10.1038/nature18849
3. Pultz NJ, Donskey CJ. Effect of antibiotic treatment on growth of and toxin production by Clostridium difficile in the cecal contents of mice. Antimicrobial Agents and Chemotherapy. 2005;49(8):3529-32. PubMed PMID: 16048976. Pubmed Central PMCID: PMC1196291. doi: 10.1128/AAC.49.8.3529-3532.2005
4. Pultz NJ, Stiefel U, Subramanyan S, Helfand MS, Donskey CJ. Mechanisms by which anaerobic microbiota inhibit the establishment in mice of intestinal colonization by vancomycin-resistant Enterococcus. Journal of Infectious Diseases. 2005;191(6):949-56. PubMed PMID: 15717271. doi: 10.1086/428090
5. Jump RL, Polinkovsky A, Hurless K, Sitzlar B, Eckart K, Tomas M, Deshpande A, Nerandzic MM, Donskey CJ. Metabolomics analysis identifies intestinal microbiota-derived biomarkers of colonization resistance in clindamycin-treated mice. PloS One. 2014;9(7):e101267. PubMed PMID: 24988418. Pubmed Central PMCID: PMC4079339. doi: 10.1371/journal.pone.0101267
6. Deshpande A, Pant C, Olyaee M, Donskey CJ. Hospital readmissions related to Clostridium difficile infection in the United States. American Journal of Infection Control. 2018;46(3):346-7. PubMed PMID: 29050906. doi: 10.1016/j.ajic.2017.08.043
7. Wikoff WR, Anfora AT, Liu J, Schultz PG, Lesley SA, Peters EC, Siuzdak G. Metabolomics analysis reveals large effects of gut microflora on mammalian blood metabolites. Proceedings of the National Academy of Sciences of the United States of America. 2009;106(10):3698-703. PubMed PMID: 19234110. Pubmed Central PMCID: PMC2656143. doi: 10.1073/pnas.0812874106
8. Collins SM, Surette M, Bercik P. The interplay between the intestinal microbiota and the brain. Nature Reviews: Microbiology. 2012;10(11):735-42. PubMed PMID: 23000955. doi: 10.1038/nrmicro2876
9. Wishart DS, Feunang YD, Marcu A, Guo AC, Liang K, Vazquez-Fresno R, Sajed T, Johnson D, Li C, Karu N, Sayeeda Z, Lo E, Assempour N, Berjanskii M, Singhal S, Arndt D, Liang Y, Badran H, Grant J, Serra-Cayuela A, Liu Y, Mandal R, Neveu V, Pon A, Knox C, Wilson M, Manach C, Scalbert A. HMDB 4.0: the human metabolome database for 2018. Nucleic Acids Research. 2018;46(D1):D608-D17. PubMed PMID: 29140435. Pubmed Central PMCID: PMC5753273. doi: 10.1093/nar/gkx1089
10. Obrenovich ME, Tima M, Polinkovsky A, Zhang R, Emancipator SN, Donskey CJ. Targeted Metabolomics Analysis Identifies Intestinal Microbiota-Derived Urinary Biomarkers of Colonization Resistance in Antibiotic-Treated Mice. Antimicrobial Agents and Chemotherapy. 2017;61(8):pii: e00477-17. PubMed PMID: 28584146. Pubmed Central PMCID: PMC5527637. doi: 10.1128/AAC.00477-17
11. Obrenovich ME, Jaskiw GE, Zhang R, Willard B, Donskey CJ. Identification and Quantification by Targeted Metabolomics of Antibiotic-Responsive Urinary Small Phenolic Molecules Derived from the Intestinal Microbiota in Mice. Pathogens and Immunity. 2019;4(1):85-103. doi: 10.20411/pai.v4i1.284
12. Roowi S, Stalmach A, Mullen W, Lean ME, Edwards CA, Crozier A. Green tea flavan-3-ols: colonic degradation and urinary excretion of catabolites by humans. Journal of Agricultural and Food Chemistry. 2010;58(2):1296-304. PubMed PMID: 20041649. doi: 10.1021/jf9032975
13. Kanehisa M, Furumichi M, Tanabe M, Sato Y, Morishima K. KEGG: new perspectives on genomes, pathways, diseases and drugs. Nucleic Acids Research. 2017;45(D1):D353-D61. PubMed PMID: 27899662. Pubmed Central PMCID: PMC5210567. doi: 10.1093/nar/gkw1092
14. Scheline RR. The decarboxylation of some phenolic acids by the rat. Acta Pharmacologica et Toxicologica. 1966;24(2):275-85. PubMed PMID: 6013094.
15. Zheng X, Xie G, Zhao A, Zhao L, Yao C, Chiu NH, Zhou Z, Bao Y, Jia W, Nicholson JK, Jia W. The footprints of gut microbial-mammalian co-metabolism. Journal of Proteome Research. 2011;10(12):5512-22. PubMed PMID: 21970572. doi: 10.1021/pr2007945
16. Wu WK, Chen CC, Liu PY, Panyod S, Liao BY, Chen PC, Kao HL, Kuo HC, Kuo CH, Chiu THT, Chen RA, Chuang HL, Huang YT, Zou HB, Hsu CC, Chang TY, Lin CL, Ho CT, Yu HT, Sheen LY, Wu MS. Identification of TMAO-producer phenotype and host-diet-gut dysbiosis by carnitine challenge test in human and germ-free mice. Gut. 2019;68(8):1439-49. PubMed PMID: 30377191. doi: 10.1136/gutjnl-2018-317155
17. Williamson G, Clifford MN. Role of the small intestine, colon and microbiota in determining the metabolic fate of polyphenols. Biochemical Pharmacology. 2017;139:24-39. PubMed PMID: 28322745. doi: 10.1016/j.bcp.2017.03.012
18. Kesli R, Gokcen C, Bulug U, Terzi Y. Investigation of the relation between anaerobic bacteria genus clostridium and late-onset autism etiology in children. J Immunoassay Immunochem. 2014;35(1):101-9.
19. Shaw W. Increased urinary excretion of a 3-(3-hydroxyphenyl)-3-hydroxypropionic acid (HPHPA), an abnormal phenylalanine metabolite of Clostridia spp. in the gastrointestinal tract, in urine samples from patients with autism and schizophrenia. Nutritional Neuroscience. 2010;13(3):135-43. PubMed PMID: 20423563. doi: 10.1179/147683010X12611460763968
20. Shaw W. Clostridia bacteria in the gastrointestinal tract as a major cause of depression and other neuropsychiatric disorders. In: Greenblatt J, Brogan K, editors. Integrative Psychiatry for Depression: Redefining Models for Assessment, Treatment, and Prevention of Mood Disorders. New York, NY: Taylor and Francis; 2016. p. 31-48.
21. Xiong X, Liu D, Wang Y, Zeng T, Peng Y. Urinary 3-(3-Hydroxyphenyl)-3-hydroxypropionic Acid, 3-Hydroxyphenylacetic Acid, and 3-Hydroxyhippuric Acid Are Elevated in Children with Autism Spectrum Disorders. Biomed Res Int. 2016;2016:9485412. PubMed PMID: 27123458. Pubmed Central PMCID: PMC4829699. doi: 10.1155/2016/9485412
22. Scalbert A, Williamson G. Dietary intake and bioavailability of polyphenols. Journal of Nutrition. 2000;130(8S Suppl):2073S-85S. PubMed PMID: 10917926. doi: 10.1093/jn/130.8.2073S
23. Borges G, Ottaviani JI, van der Hooft JJJ, Schroeter H, Crozier A. Absorption, metabolism, distribution and excretion of (-)-epicatechin: A review of recent findings. Molecular Aspects of Medicine. 2018;61:18-30. PubMed PMID: 29126853. doi: 10.1016/j.mam.2017.11.002
24. Chen HD, Sang SM. Biotransformation of tea polyphenols by gut microbiota. Journal of Functional Foods. 2014;7:26-42. PubMed PMID: WOS:000335203500003. doi: 10.1016/j.jff.2014.01.013
25. USDA Database for the Flavonoid Content of Selected Foods [Internet]. 2007. Available from: www.ars.usda.gov/ARSUserFiles/80400525/Data/Flav/Flav02-1.pdf.
26. Spencer JP. Metabolism of tea flavonoids in the gastrointestinal tract. Journal of Nutrition. 2003;133(10):3255S-61S. PubMed PMID: 14519823. doi: 10.1093/jn/133.10.3255S
27. Stalmach A, Mullen W, Steiling H, Williamson G, Lean ME, Crozier A. Absorption, metabolism, and excretion of green tea flavan-3-ols in humans with an ileostomy. Molecular Nutrition & Food Research. 2010;54(3):323-34. PubMed PMID: 19937856. doi: 10.1002/mnfr.200900194
28. Liu Z, Bruins ME, Ni L, Vincken JP. Green and Black Tea Phenolics: Bioavailability, Transformation by Colonic Microbiota, and Modulation of Colonic Microbiota. Journal of Agricultural and Food Chemistry. 2018;66(32):8469-77. PubMed PMID: 30020786. doi: 10.1021/acs.jafc.8b02233
29. Li C, Meng X, Winnik B, Lee MJ, Lu H, Sheng S, Buckley B, Yang CS. Analysis of urinary metabolites of tea catechins by liquid chromatography/electrospray ionization mass spectrometry. Chemical Research in Toxicology. 2001;14(6):702-7. PubMed PMID: 11409941.
30. Liu AB, Tao S, Lee MJ, Hu Q, Meng X, Lin Y, Yang CS. Effects of gut microbiota and time of treatment on tissue levels of green tea polyphenols in mice. Biofactors. 2018. PubMed PMID: 29740891. Pubmed Central PMCID: PMC6222019. doi: 10.1002/biof.1430
31. Madrid-Gambin F, Garcia-Aloy M, Vazquez-Fresno R, Vegas-Lozano E, Sanchez-Pla A, Misawa K, Hase T, Shimotoyodome A, Andres-Lacueva C. Metabolic Signature of a Functional High-Catechin Tea after Acute and Sustained Consumption in Healthy Volunteers through (1)H NMR Based Metabolomics Analysis of Urine. Journal of Agricultural and Food Chemistry. 2019;67(11):3118-24. PubMed PMID: 30574780. doi: 10.1021/acs.jafc.8b04198
32. Envigo. Teklad Global 18% Protein Extruded Rodent Diet (Sterilizable) 2018 [cited 2018 08/08/2018]. Diet composition]. Available from: www.envigo.com/resources/data-sheets/2018sx-datasheet-0915.pdf
33. Rutter, Sell, Fraser, Obrenovich, Zito, Starke-Reed, Monnier. Green Tea Extract Suppresses the Age-Related Increase in Collagen Crosslinking and Fluorescent Products in C57BL/6 Mice. International Journal for Vitamin and Nutrition Research. 2003;73(6):453-60. PubMed PMID: 14743550. doi: 10.1024/0300-9831.73.6.453
34. Khokhar S, Venema D, Hollman PC, Dekker M, Jongen W. A RP-HPLC method for the determination of tea catechins. Cancer Letters. 1997;114(1-2):171-2. PubMed PMID: 9103282. doi: 10.1016/s0304-3835(97)04653-3
35. Sysi-Aho M, Katajamaa M, Yetukuri L, Oresic M. Normalization method for metabolomics data using optimal selection of multiple internal standards. BMC Bioinformatics. 2007;8:93. PubMed PMID: 17362505. Pubmed Central PMCID: PMC1838434. doi: 10.1186/1471-2105-8-93
36. Meng X, Sang S, Zhu N, Lu H, Sheng S, Lee MJ, Ho CT, Yang CS. Identification and characterization of methylated and ring-fission metabolites of tea catechins formed in humans, mice, and rats. Chemical Research in Toxicology. 2002;15(8):1042-50. PubMed PMID: 12184788.
37. Donovan JL, Crespy V, Manach C, Morand C, Besson C, Scalbert A, Remesy C. Catechin is metabolized by both the small intestine and liver of rats. Journal of Nutrition. 2001;131(6):1753-7. PubMed PMID: 11385063. doi: 10.1093/jn/131.6.1753
38. Piskula MK, Terao J. Accumulation of (-)-epicatechin metabolites in rat plasma after oral administration and distribution of conjugation enzymes in rat tissues. Journal of Nutrition. 1998;128(7):1172-8. PubMed PMID: 9649602. doi: 10.1093/jn/128.7.1172
39. Shangari N, Chan TS, O'Brien PJ. Sulfation and glucuronidation of phenols: implications in coenyzme Q metabolism. Methods in Enzymology. 2005;400:342-59. PubMed PMID: 16399359. doi: 10.1016/S0076-6879(05)00020-0
40. Tourino S, Fuguet E, Vinardell MP, Cascante M, Torres JL. Phenolic metabolites of grape antioxidant dietary fiber in rat urine. Journal of Agricultural and Food Chemistry. 2009;57(23):11418-26. PubMed PMID: 19951002. doi: 10.1021/jf901972c
41. Shaw IC, Hackett AM, Griffiths LA. Metabolism and excretion of the liver-protective agent (+)-catechin in experimental hepatitis. Xenobiotica. 1982;12(7):405-16. PubMed PMID: 7147991.
42. Macfarlane GT, Cummings JH. The colonic flora, fermentation and large bowel digestive function. In: Phillips SF, Pemberton JH, Shorter RG, editors. The Large Intestine: Physiology, Pathophysiology and Disease. New York: Raven Press; 1991. p. 51-92.
43. Kuhnau J. The flavonoids. A class of semi-essential food components: their role in human nutrition. World Review of Nutrition and Dietetics. 1976;24:117-91. PubMed PMID: 790781.
44. Crozier A, Jaganath I, B., Clifford MN. Phenols, Polyphenols and Tannins: An Overview. In: Crozier A, Clifford MN, Ashihara H, editors. Plant Secondary Metabolites: Occurrence, Structure and Role in the Human Diet. Oxford, UK: Blackwell Publishing; 2006. p. 1-24.
45. Takagaki A, Kato Y, Nanjo F. Isolation and characterization of rat intestinal bacteria involved in biotransformation of (-)-epigallocatechin. Archives of Microbiology. 2014;196(10):681-95. PubMed PMID: 24947740. doi: 10.1007/s00203-014-1006-y
46. Das NP, Griffiths LA. Studies on flavonoid metabolism. Metabolism of (+)-[14C] catechin in the rat and guinea pig. Biochemical Journal. 1969;115(4):831-6. PubMed PMID: 5357023. Pubmed Central PMCID: PMC1185212. doi: 10.1042/bj1150831
47. Borges G, van der Hooft JJJ, Crozier A. A comprehensive evaluation of the [2-(14)C](-)-epicatechin metabolome in rats. Free Radical Biology and Medicine. 2016;99:128-38. PubMed PMID: 27495388. doi: 10.1016/j.freeradbiomed.2016.08.001
48. Ottaviani JI, Borges G, Momma TY, Spencer JP, Keen CL, Crozier A, Schroeter H. The metabolome of [2-(14)C](-)-epicatechin in humans: implications for the assessment of efficacy, safety, and mechanisms of action of polyphenolic bioactives. Scientific Reports. 2016;6:29034. PubMed PMID: 27363516. Pubmed Central PMCID: PMC4929566. doi: 10.1038/srep29034
49. Booth AN, Masri MS, Robbins DJ, Emerson OH, Jones FT, De Eds F. The metabolic fate of gallic acid and related compounds. Journal of Biological Chemistry. 1959;234:3014-6. PubMed PMID: 13802679.
50. Daglia M, Di Lorenzo A, Nabavi SF, Talas ZS, Nabavi SM. Polyphenols: well beyond the antioxidant capacity: gallic acid and related compounds as neuroprotective agents: you are what you eat! Current Pharmaceutical Biotechnology. 2014;15(4):362-72. PubMed PMID: 24938889.
51. Mandic AI, Dilas SM, Cetkovic GS, Canadanovic-Brunet JM, Tumbas VT. Polyphenolic Composition and Antioxidant Activities of Grape Seed Extract. International Journal of Food Properties. 2008;11(4):713-26. PubMed PMID: WOS:000261020200001. Pii 905635022. doi: 10.1080/10942910701584260
52. Del Bo C, Ciappellano S, Klimis-Zacas D, Martini D, Gardana C, Riso P, Porrini M. Anthocyanin absorption, metabolism, and distribution from a wild blueberry-enriched diet (Vaccinium angustifolium) is affected by diet duration in the Sprague-Dawley rat. Journal of Agricultural and Food Chemistry. 2010;58(4):2491-7. PubMed PMID: 20030330. doi: 10.1021/jf903472x
53. Abhijit S, Tripathi SJ, Bhagya V, Shankaranarayana Rao BS, Subramanyam MV, Asha Devi S. Antioxidant action of grape seed polyphenols and aerobic exercise in improving neuronal number in the hippocampus is associated with decrease in lipid peroxidation and hydrogen peroxide in adult and middle-aged rats. Experimental Gerontology. 2018;101:101-12. PubMed PMID: 29174497. doi: 10.1016/j.exger.2017.11.012
54. Vostalova J, Galandakova A, Palikova I, Ulrichova J, Dolezal D, Lichnovska R, Vrbkova J, Rajnochova Svobodova A. Lonicera caerulea fruits reduce UVA-induced damage in hairless mice. Journal of Photochemistry and Photobiology B: Biology. 2013;128:1-11. PubMed PMID: 23974431. doi: 10.1016/j.jphotobiol.2013.07.024
55. Chen H, Hayek S, Rivera Guzman J, Gillitt ND, Ibrahim SA, Jobin C, Sang S. The microbiota is essential for the generation of black tea theaflavins-derived metabolites. PloS One. 2012;7(12):e51001. PubMed PMID: 23227227. Pubmed Central PMCID: PMC3515489. doi: 10.1371/journal.pone.0051001
56. van't Slot G, Humpf HU. Degradation and metabolism of catechin, epigallocatechin-3-gallate (EGCG), and related compounds by the intestinal microbiota in the pig cecum model. Journal of Agricultural and Food Chemistry. 2009;57(17):8041-8. PubMed PMID: 19670865. doi: 10.1021/jf900458e
57. Meselhy MR, Nakamura N, Hattori M. Biotransformation of (-)-epicatechin 3-O-gallate by human intestinal bacteria. Chemical and Pharmaceutical Bulletin. 1997;45(5):888-93. PubMed PMID: 9178524. doi: 10.1248/cpb.45.888
58. Takagaki A, Nanjo F. Metabolism of (-)-epigallocatechin gallate by rat intestinal flora. Journal of Agricultural and Food Chemistry. 2010;58(2):1313-21. PubMed PMID: 20043675. doi: 10.1021/jf903375s
59. Shahrzad S, Aoyagi K, Winter A, Koyama A, Bitsch I. Pharmacokinetics of gallic acid and its relative bioavailability from tea in healthy humans. Journal of Nutrition. 2001;131(4):1207-10. PubMed PMID: 11285327. doi: 10.1093/jn/131.4.1207
60. Shahrzad S, Bitsch I. Determination of gallic acid and its metabolites in human plasma and urine by high-performance liquid chromatography. Journal of Chromatography B: Biomedical Sciences and Applications. 1998;705(1):87-95. PubMed PMID: 9498674.
61. Yasuda T, Inaba A, Ohmori M, Endo T, Kubo S, Ohsawa K. Urinary Metabolites of Gallic Acid in Rats and Their Radical-Scavenging Effects on 1,1-Diphenyl-2-picrylhydrazyl Radical. Journal of Natural Products. 2000;63(10):1444-6. doi: 10.1021/np0000421
62. Kohri T, Suzuki M, Nanjo F. Identification of metabolites of (-)-epicatechin gallate and their metabolic fate in the rat. Journal of Agricultural and Food Chemistry. 2003;51(18):5561-6. PubMed PMID: 12926915. doi: 10.1021/jf034450x
63. Feliciano RP, Istas G, Heiss C, Rodriguez-Mateos A. Plasma and Urinary Phenolic Profiles after Acute and Repetitive Intake of Wild Blueberry. Molecules. 2016;21(9). PubMed PMID: 27571052. Pubmed Central PMCID: PMC6273248. doi: 10.3390/molecules21091120
64. Pimpao RC, Dew T, Figueira ME, McDougall GJ, Stewart D, Ferreira RB, Santos CN, Williamson G. Urinary metabolite profiling identifies novel colonic metabolites and conjugates of phenolics in healthy volunteers. Molecular Nutrition & Food Research. 2014;58(7):1414-25. PubMed PMID: 24740799. doi: 10.1002/mnfr.201300822
65. Ancillotti C, Ulaszewska M, Mattivi F, Del Bubba M. Untargeted Metabolomics Analytical Strategy Based on Liquid Chromatography/Electrospray Ionization Linear Ion Trap Quadrupole/Orbitrap Mass Spectrometry for Discovering New Polyphenol Metabolites in Human Biofluids after Acute Ingestion of Vaccinium myrtillus Berry Supplement. Journal of the American Society for Mass Spectrometry. 2019;30(3):381-402. PubMed PMID: 30506347. doi: 10.1007/s13361-018-2111-y
66. Stalmach A, Edwards CA, Wightman JD, Crozier A. Colonic catabolism of dietary phenolic and polyphenolic compounds from Concord grape juice. Food & Function. 2013;4(1):52-62. PubMed PMID: 22961385. doi: 10.1039/c2fo30151b
67. Schantz M, Erk T, Richling E. Metabolism of green tea catechins by the human small intestine. Biotechnology Journal. 2010;5(10):1050-9. PubMed PMID: 20931601. doi: 10.1002/biot.201000214
68. Sanchez-Patan F, Barroso E, van de Wiele T, Jimenez-Giron A, Martin-Alvarez PJ, Moreno-Arribas MV, Martinez-Cuesta MC, Pelaez C, Requena T, Bartolome B. Comparative in vitro fermentations of cranberry and grape seed polyphenols with colonic microbiota. Food Chemistry. 2015;183:273-82. PubMed PMID: 25863636. doi: 10.1016/j.foodchem.2015.03.061
69. Sánchez-Patán F, Cueva C, Monagas M, Walton GE, Gibson GR, Martín-Álvarez PJ, Victoria Moreno-Arribas M, Bartolomé B. Gut microbial catabolism of grape seed flavan-3-ols by human faecal microbiota. Targetted analysis of precursor compounds, intermediate metabolites and end-products. Food Chemistry. 2012;131(1):337-47. doi: 10.1016/j.foodchem.2011.08.011
70. Sanchez-Patan F, Cueva C, Monagas M, Walton GE, Gibson GR, Quintanilla-Lopez JE, Lebron-Aguilar R, Martin-Alvarez PJ, Moreno-Arribas MV, Bartolome B. In vitro fermentation of a red wine extract by human gut microbiota: changes in microbial groups and formation of phenolic metabolites. Journal of Agricultural and Food Chemistry. 2012;60(9):2136-47. PubMed PMID: 22313337. doi: 10.1021/jf2040115
71. Munoz-Gonzalez C, Moreno-Arribas MV, Rodriguez-Bencomo JJ, Cueva C, Martin Alvarez PJ, Bartolome B, Pozo-Bayon MA. Feasibility and application of liquid-liquid extraction combined with gas chromatography-mass spectrometry for the analysis of phenolic acids from grape polyphenols degraded by human faecal microbiota. Food Chemistry. 2012;133(2):526-35. PubMed PMID: 25683429. doi: 10.1016/j.foodchem.2012.01.020
72. Rodríguez H, Landete JM, Rivas Bdl, Muñoz R. Metabolism of food phenolic acids by Lactobacillus plantarum CECT 748T. Food Chemistry. 2008;107(4):1393-8. doi: 10.1016/j.foodchem.2007.09.067
73. Sridharan GV, Choi K, Klemashevich C, Wu C, Prabakaran D, Pan LB, Steinmeyer S, Mueller C, Yousofshahi M, Alaniz RC, Lee K, Jayaraman A. Prediction and quantification of bioactive microbiota metabolites in the mouse gut. Nat Commun. 2014;5:5492. PubMed PMID: 25411059. doi: 10.1038/ncomms6492
74. Gonzalez-Barrio R, Edwards CA, Crozier A. Colonic catabolism of ellagitannins, ellagic acid, and raspberry anthocyanins: in vivo and in vitro studies. Drug Metabolism and Disposition: The Biological Fate of Chemicals. 2011;39(9):1680-8. PubMed PMID: 21622625. doi: 10.1124/dmd.111.039651
75. Xu B, Chang SK. Characterization of phenolic substances and antioxidant properties of food soybeans grown in the North Dakota-Minnesota region. Journal of Agricultural and Food Chemistry. 2008;56(19):9102-13. PubMed PMID: 18781761. doi: 10.1021/jf801451k
76. Zhao Z, Egashira Y, Sanada H. Phenolic antioxidants richly contained in corn bran are slightly bioavailable in rats. Journal of Agricultural and Food Chemistry. 2005;53(12):5030-5. PubMed PMID: 15941352. doi: 10.1021/jf050111n
77. Mattila P, Pihlava JM, Hellstrom J. Contents of phenolic acids, alkyl- and alkenylresorcinols, and avenanthramides in commercial grain products. Journal of Agricultural and Food Chemistry. 2005;53(21):8290-5. PubMed PMID: 16218677. doi: 10.1021/jf051437z
78. Hufeldt MR, Nielsen DS, Vogensen FK, Midtvedt T, Hansen AK. Variation in the gut microbiota of laboratory mice is related to both genetic and environmental factors. Comparative Medicine. 2010;60(5):336-47. PubMed PMID: 21262117. Pubmed Central PMCID: PMC2958200.
79. Lavelle A, Hoffmann TW, Pham HP, Langella P, Guedon E, Sokol H. Baseline microbiota composition modulates antibiotic-mediated effects on the gut microbiota and host. Microbiome. 2019;7(1):111. PubMed PMID: 31375137. Pubmed Central PMCID: PMC6676565. doi: 10.1186/s40168-019-0725-3
80. Ridder L, van der Hooft JJ, Verhoeven S, de Vos RC, Vervoort J, Bino RJ. In silico prediction and automatic LC-MS(n) annotation of green tea metabolites in urine. Analytical Chemistry. 2014;86(10):4767-74. PubMed PMID: 24779709. doi: 10.1021/ac403875b
81. Kim S, Lee MJ, Hong J, Li C, Smith TJ, Yang GY, Seril DN, Yang CS. Plasma and tissue levels of tea catechins in rats and mice during chronic consumption of green tea polyphenols. Nutrition and Cancer. 2000;37(1):41-8. PubMed PMID: 10965518. doi: 10.1207/s15327914nc3701_5
82. Westphal JF, Vetter D, Brogard JM. Hepatic side-effects of antibiotics. Journal of Antimicrobial Chemotherapy. 1994;33(3):387-401. PubMed PMID: 8040106. doi: 10.1093/jac/33.3.387
83. Buu NT. Relationship between catechol-O-methyltransferase and phenolsulfotransferase in the metabolism of dopamine in the rat brain. Journal of Neurochemistry. 1985;45(5):1612-9. PubMed PMID: 3930664. doi: 10.1111/j.1471-4159.1985.tb07234.x
84. Sugden RF, Eccleston D. Glycol sulphate ester formation from ( 14 C)noradrenaline in brain and the influence of a COMT inhibitor. Journal of Neurochemistry. 1971;18(12):2461-8. PubMed PMID: 5135906. doi: 10.1111/j.1471-4159.1971.tb00203.x
85. Nakamura Y, Tsuji S, Tonogai Y. Method for analysis of tannic acid and its metabolites in biological samples: application to tannic acid metabolism in the rat. Journal of Agricultural and Food Chemistry. 2003;51(1):331-9. PubMed PMID: 12502429. doi: 10.1021/jf020847+
86. Harrison CA, Laubitz D, Midura-Kiela MT, Jamwal DR, Besselsen DG, Ghishan FK, Kiela PR. Sexual Dimorphism in the Response to Broad-spectrum Antibiotics During T Cell-mediated Colitis. Journal of Crohn's & Colitis. 2019;13(1):115-26. PubMed PMID: 30252029. Pubmed Central PMCID: PMC6302957. doi: 10.1093/ecco-jcc/jjy144
87. Naz S, Siddiqi R, Ahmad S, Rasool SA, Sayeed SA. Antibacterial activity directed isolation of compounds from Punica granatum. Journal of Food Science. 2007;72(9):M341-5. PubMed PMID: 18034726. doi: 10.1111/j.1750-3841.2007.00533.x
88. Obrenovich ME, Donskey CJ, Schiefer IT, Bongiovanni R, Li L, Jaskiw GE. Quantification of phenolic acid metabolites in humans by LC-MS: a structural and targeted metabolomics approach. Bioanalysis. 2018;10(19):1591-608. PubMed PMID: 30295550. doi: 10.4155/bio-2018-0140
89. Rogers KJ, Angel A, Butterfield L. The penetration of catechol and pyrogallol into mouse brain and the effect on cerebral monoamine levels. Journal of Pharmacy and Pharmacology. 1968;20(9):727-9. PubMed PMID: 4386386. doi: 10.1111/j.2042-7158.1968.tb09845.x
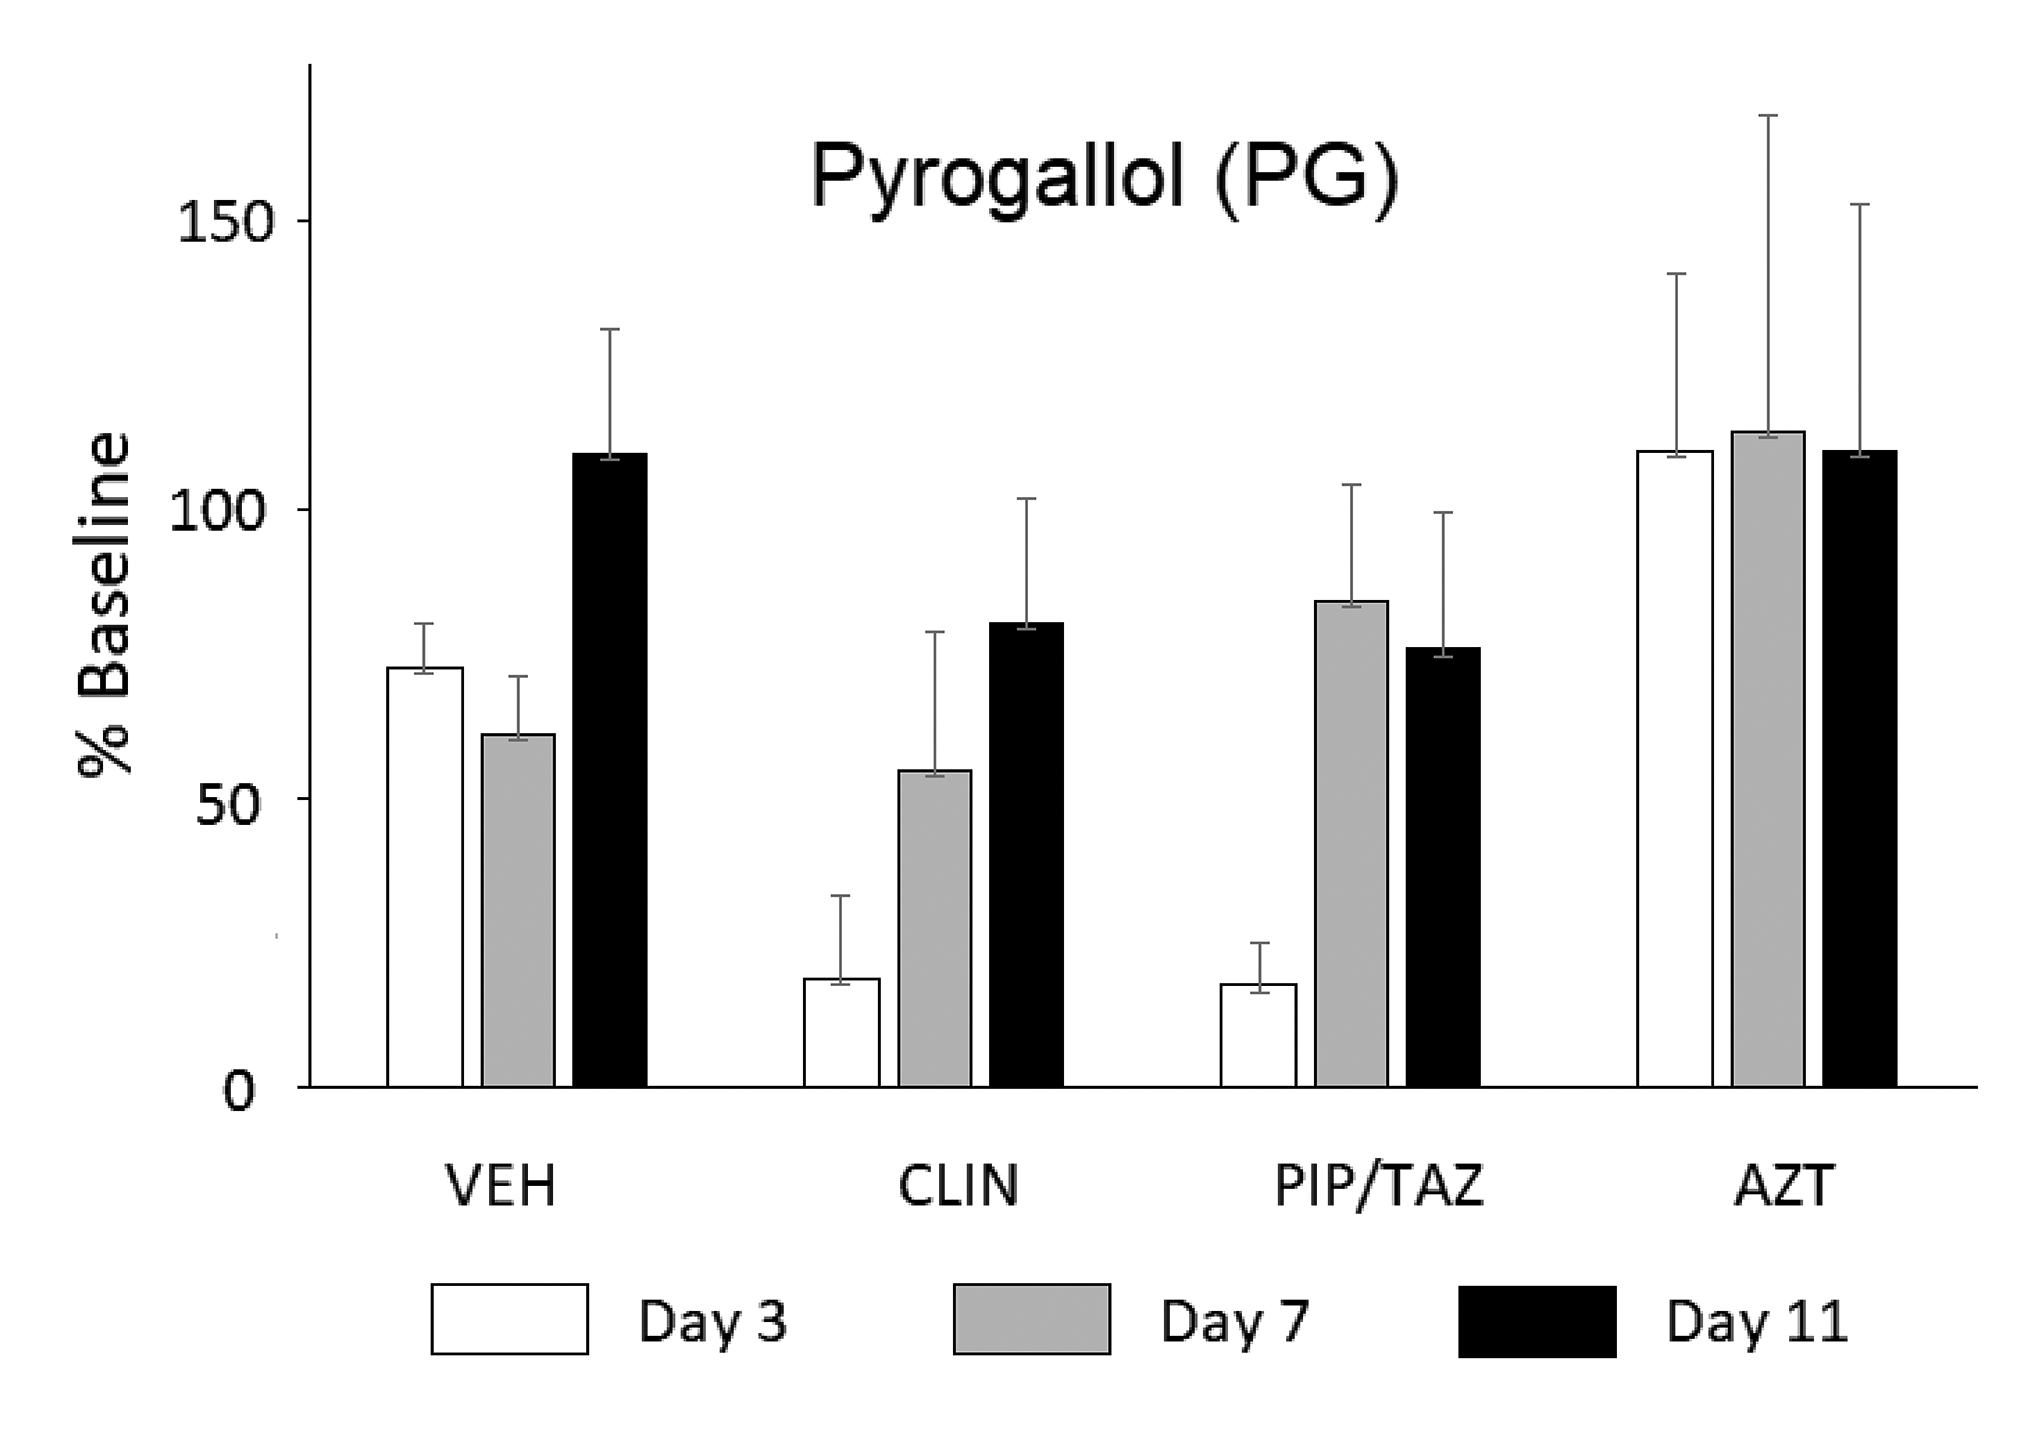
Supplementary Figure 1. Groups of 4-5 mice were treated with clindamycin (CLIN), piperacillin/tazobactam (PIP/TAZ), or aztreonam (AZT) on days 1–2 and urine was collected on days 3, 7, and 11. Data are presented as a percent of the baseline (day 0) for the given group. Statistical analyses were conducted on the absolute levels Mean + SEM. Urinary levels of pyrogallol (PG) tended to be lower on days 3–7 in CLIN- and PIP/TAZ-treated mice as expected but statistical significance was not reached in the data shown, due to a high level of data variance. Similar data were generated for pyrocatechol (PC).
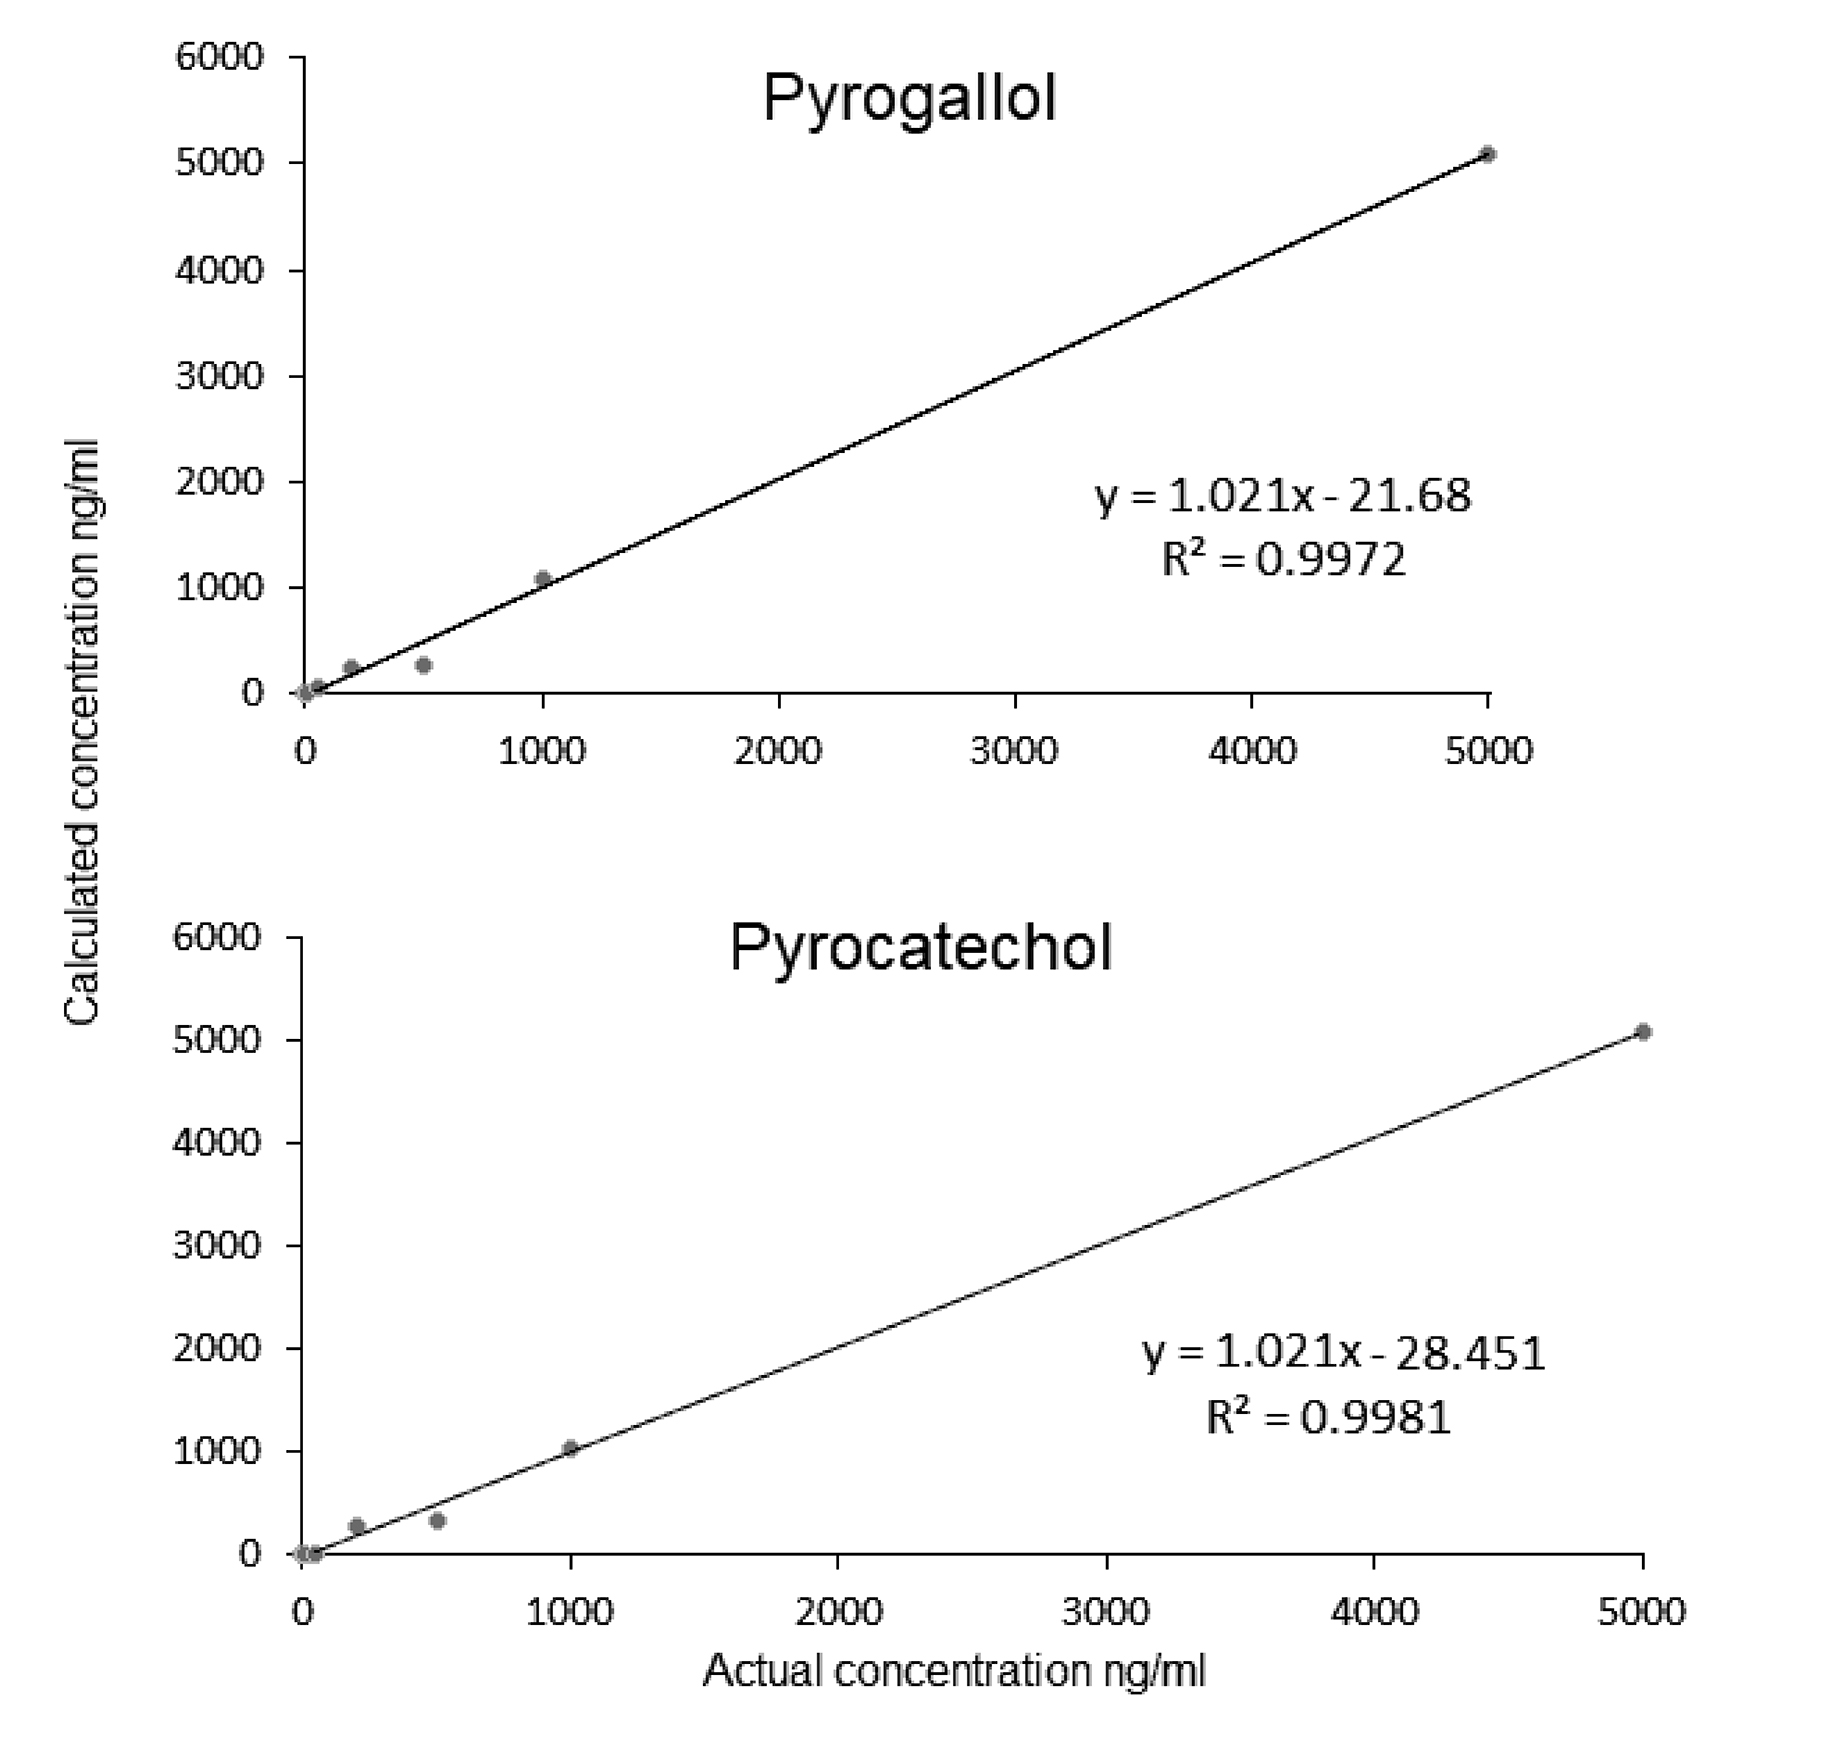
Supplementary Figure 2. Calibration curves for the compounds of interest.
|
|
|
|
|
(-)-Epicatechin |
6.22 |
8.29 |
|
(-)-Epicatechin-3-O-gallate |
14.8 |
19.73 |
|
(-)-Epigallocatechin |
12.5 |
16.71 |
|
(-)-Epigallocatechin-3-O-gallate |
58.4 |
77.81 |
|
Subtotal |
91.92% |
122.54 |
|
|
|
|
|
|
Gallic acid |
(-) |
169.00 > 125.15 |
5.156 |
|
Pyrogallol |
(-) |
125.10 > 79.10 |
5.154 |
|
Pyrocatechol |
(-) |
109.10>91.10 |
5.994 |
|
d5-L-phenylalanine |
(-) |
169.00 > 152.20 |
5.141 |