Martha A. Belury1, Emily Bowman2, Janelle Gabriel 2, Brandon Snyder2, Manjusha Kulkarni2, Marilly Palettas3, Xiaokui Mo3, Jordan E. Lake4, David Zidar5, Scott F. Sieg5, Benigno Rodriguez5, Martin P. Playford6, Adriana Andrade7, Daniel R. Kuritzkes8, Nehal N. Mehta6, Michael M. Lederman5, Nicholas T. Funderburg2, the AIDS Clinical Trials Group A5248/A5249s Team
1
Department of Human Sciences, Ohio State University, Columbus, Ohio
2
School of Health and Rehabilitation Sciences, Division of Medical
Laboratory Science, Ohio State University, Columbus, Ohio
3
Center for Biostatistics, Department of Biomedical Informatics, Ohio State
University, Columbus, Ohio
4
University of Texas Health Science Center, Houston, Texas
5
Case Western Reserve University, Cleveland Ohio
6
National Heart Lung and Blood Institute, Bethesda, Maryland
7
Johns Hopkins University, Baltimore, Maryland
8
Brigham and Women’s Hospital/Harvard Medical School, Boston, Massachusetts
Nicholas T. Funderburg
535A Atwell Hall
453 West 10th Ave
Columbus OH, 43210
Funderburg.20@osu.edu
Phone: 614-366-7667
Fax: 614-292-0210
Background: Lipid profiles are altered by HIV infection and antiretroviral therapy (ART). Among HIV-uninfected (HIV-) populations the concentrations of various lipid classes (ie, lysophosphatidylcholine, LPC) and their saturated (SaFA), monounsaturated (MUFA), and polyunsaturated fatty acid (PUFA) composition are related to cardiometabolic disease risk. Associations between changes in the lipidome and immune activation in HIV-infected (HIV+) individuals beginning ART have not been described.
Methods: Plasma lipid concentrations and their fatty acid composition were measured by differential mobility spectroscopy in samples from 35 treatment-naive HIV+ participants beginning raltegravir (RAL)-based ART and from HIV- individuals (n = 13) matched for age and sex.
Results: The levels of SaFA, including palmitic (16:0) and stearic (18:0) acid were enriched in HIV+ participants (pre- and post-ART), and SaFA levels were often positively correlated with levels of immune activation (ie, IL-6, sCD14, and TNFR1) at baseline and week 48. Levels of PUFAs (including 18:3, 20:4, and 20:5) were lower in HIV+ participants at baseline compared to levels in HIV- participants (P<0.01), and levels of these PUFAs were increased following 48 weeks of ART. Levels of PUFAs were often inversely related to immune activation. Levels of LPC were increased in HIV+ participants, both pre- and post-ART vs HIV- participants, and the composition of LPC was enriched for SaFAs among HIV+ individuals. At week 48, several LPC molecules containing SaFAs were positively correlated with levels of sCD14, D-dimer, and TNFR1 (P <0.01), and levels of PUFA-containing LPC (18:3, 20:5, 22:5, 22:6) were positively correlated with CD4+ T cell counts and inversely correlated with sCD14 and IL-6 (P<0.01).
Conclusions: The composition of the lipidome is altered in HIV infection and changes when ART is administered. Alterations in SaFAs were generally associated with inflammatory markers and may contribute to comorbid disease pathogenesis.
Keywords: lysophosphatidylcholine, immune activation, antiretroviral therapy, fatty acids
Human immunodeficiency virus (HIV) infection, its treatment, and the inflammatory consequences of chronic HIV infection all contribute to cardiometabolic disease risk [1, 2]. Chronic HIV infection is often associated with decreases in levels of high-density lipoprotein (HDL) cholesterol and increases in low-density lipoprotein (LDL) cholesterol, triglycerides (TG), and total cholesterol (TC) [1, 2]; however, these basic lipid panels provide only a crude characterization of blood lipids and are insufficient to accurately assess cardiovascular disease (CVD) risk in individuals infected with HIV [3]. Historically, assays of lipid families have aggregated hundreds of different molecular species into classes based on their densities; newer methods now allow finer characterization of these elements.
Fatty acid concentrations and composition in plasma, including levels of saturated (SaFA), monounsaturated (MUFA), and polyunsaturated fatty acids (PUFA) have been associated with CVD [4, 5], non-alcoholic steatohepatitis (NASH) [6] and diabetes [7] in HIV- populations. For example, SaFAs, especially palmitic acid, are associated with increased risk of type 2 diabetes in an HIV- population [7]. Increased levels of PUFAs are associated with reduced risk of myocardial infarction [8] and death [9]. Furthermore, in vitro studies have demonstrated that SaFAs, but not unsaturated fatty acids, can activate the inflammasome within myeloid cells [10], can induce NFΚB signaling in macrophages [11], and can promote adhesion molecule expression on endothelial cell lines [12]. Conversely, PUFAs can block activation of the inflammasome [13, 14] and inhibit endothelial cell activation following exposure to lipopolysaccharide (LPS) [15]. Lysophosphatidylcholine (LPC) levels are increased in many disease settings, including CVD [16, 17], renal failure [18], and diabetes [19]. Based on its fatty acid composition, LPC can act as a pro- or anti-inflammatory molecule [17]. The relationship between inflammation and lipids is bidirectional [20], with inflammatory processes altering lipid levels, and several lipid species contributing to inflammation and cellular activation. Lysophosphatidylcholine is a major component of oxidized LDL (oxLDL) [21], which can activate monocytes in vitro [22, 23], and we have previously reported that oxLDL levels are increased in HIV-infected (HIV+) individuals and are associated with markers of monocyte activation [24]. Reductions in oxLDL levels are associated with improvements in carotid intima media thickness [25] and non-calcified plaque volume [26] in HIV+ individuals receiving statins.
Here, in a substudy of the AIDS Clinical Trials Group (ACTG) trials A5248/A5249s [27-30], using liquid chromatography tandem mass spectrometry (LC MS/ MS; Complex Lipid Panel, Metabolon), we examined the concentrations and fatty acid composition of lipid classes in plasma samples: 1) longitudinally in ART-naive HIV+ adults who initiated an ART regimen containing raltegravir (RAL), tenofovir (TDF), and emtricitabine (FTC), and 2) in samples from a single time point in an age and sex similar HIV- population. We hypothesized that infection with HIV and treatment with ART would alter the composition of the lipidome, and that these changes would be associated with markers of inflammation.
This study was approved by institutional review boards at all participating sites [27-30] and is registered with Clinicaltrials.gov (NCT00660972).
This pilot study A5248 was a prospective, open-label, multicenter study performed in the United States of America between June 2008 and April 2010 [27, 28]. Briefly, ART-naive subjects (n = 39) with plasma HIV-1 RNA viral load (VL) >10k and <300k copies/mL at screening were treated for 48 weeks with RAL (400 mg twice daily) and FTC/TDF (200 mg / 300 mg once daily). We selected 35 participants for this substudy who had available plasma samples at baseline (BL) and week 48 for analysis of their lipidome; all selected participants achieved virologic suppression by week 48. Samples from 13 age- and sex-matched HIV- subjects were analyzed for comparison.
Blood samples were collected in EDTA-containing tubes, centrifuged once, and plasma was frozen at -80oC until thawed and analyzed in batches.
Measurement of the concentration and composition of approximately 1,300 lipid metabolites was performed by Metabolon (True Mass Complex Lipid Panel, Metabolon, Research Triangle Park, NC). Lipids were extracted from plasma in methanol:dichloromethane in the presence of internal standards. The extracts were concentrated under nitrogen and reconstituted in 0.25 mL of 10mM ammonium acetate dichloromethane:methanol (50:50). The extracts were transferred to inserts and placed in vials for infusion-Mass Spectroscopy (MS) analysis, performed on a Shimazdu LC with nanoPEEk tubing and the Sciex SelexIon-5500 QTRAP. The samples were analyzed via both positive and negative mode electrospray. Lipid class concentrations (µM) were calculated from the sum of all molecular species within a class, and fatty acid compositions (mol%) were determined by calculating the proportion of each class comprised by individual fatty acids. The Surveyor program was used in data organization and provides the name for the most common/abundant fatty acid measured.
The Mehta laboratory performed advanced lipid phenotyping using NMR spectroscopy (Liposcience, Raleigh, NC) for lipid concentration, lipid particle size, and number as reported previously [29]; the lipoprotein insulin resistance (LIPR) score [31] was calculated by Liposcience Labcorp, Burlington, NC. The LPIR score combines information from large VLDL-P, small LDL-P, large HDL-P, VLDL, HDL and LDL particle sizes into a weighted algorithm that can be used to measure insulin resistance. A score of 0 is insulin sensitive, 100 is insulin resistant, and the 50th percentile has an LPIR of 45.
CD4+ and CD8+ T cells were identified by size, granularity, and staining with antibodies to CD4 or CD8. The following antibody-fluorochrome conjugates (and isotype controls) were used: anti-CD4 (Pacific Blue, Becton Dickinson (BD) Pharmingen, San Diego, CA), anti-CD8 (Peridinin-chlorophyll-protein Complex, PerCP, Franklin Lakes, NJ), anti-Ki-67 (phycoerythrin, PE, BD Pharmingen), anti HLA-DR (fluorescein isothiocyanate, FITC, BD Biosciences), and anti-CD38 (PE, BD Biosciences). For analysis of intracellular Ki-67, cells were incubated with FACS Permeabilizing Solution (BD Biosciences) for 15 minutes, washed and then stained with anti-Ki-67 antibody or with an isotype control antibody for 45 minutes in the dark. Cells were then washed and fixed with 1% formaldehyde and analyzed using an LSR II flow cytometer (BD).
Levels of soluble CD14 (sCD14), tumor necrosis factor receptor type 1 (TNFR1), and interleukin-6 (IL-6) were measured using Quantikine ELISA kits (all from R&D Systems Minneapolis, MN). Levels of D-dimer were measured using the Asserachrom D-DI immunoassay (Diagnostica Stago, Asnieres, France). Levels of leptin and adiponectin (R&D Systems) were also measured by ELISA.
Fisher’s Exact tests were used to test the association between HIV status and race or sex. The differences in the concentration and composition of total, free, and LPC lipid levels and age differences among HIV+ and HIV- donors were analyzed by 2-sample t tests, and the differences in these metabolic indices between baseline and week 48 of ART were analyzed by paired t tests. The associations among the levels of lipids and markers of immune activation were assessed by using Pearson correlations. Data analysis was performed in SAS 9.4 (SAS, Inc; Cary, NC).
We included in this study longitudinal samples from 35 HIV+ participants (untreated and after 48 weeks of ART) and, for comparison, samples from thirteen HIV- participants at a single time point. Demographic information is shown in Table 1. Among the HIV+ participants at baseline, the median CD4+ T-cell count and viral load were 259 cells/μL and 37,153 copies/mL; both of these indices improved after week 48 of ART (to 489 cells/μL and <48 copies/mL). Levels of LDL, HDL, TC, and TG are also shown in Table 1. As we have reported previously [29], among the HIV+ participants, median levels of LDL, HDL, TC, and TG all increased from baseline to week 48 (Table 1). Levels of adiponectin and leptin did not change significantly following 48 weeks of ART. The LPIR scores were slightly higher in HIV+ participants at baseline (P = 0.06) but were not different following 48 weeks of ART (P = 0.2) compared to LPIR scores among HIV- participants. Of the 32 HIV+ participants of whom we measured an LIPR score, 12 had an increase in their score following 48 weeks of ART; increases in this score have been reported to predict development of type 2 diabetes mellitus [32].
|
HIV-1 infected participants Baseline (n = 35) |
HIV-1 infected participants Week 48 (n = 35) |
HIV-1 uninfected participants (n = 13) |
Statistically different betweengroups |
|
|
Age (years) |
43 (23-58) |
44 (24-59) |
43 (23-58) |
P = 0.98 |
|
CD4+ T-cell count (cells/μL) |
259 (1-599) |
489 (87-1026) |
NA |
|
|
HIV Viral load (copies/mL) |
37,153 (6,637-619,797) |
48 (48-48) |
NA |
|
|
Race/Ethnicity (%) |
White = 18 (53%) Not White = 16 (47%) |
White = 9 (69%) Not white = 4 (31%) |
P = 0.35 |
|
|
Sex/Gender(%) |
Male = 32 (91%) Female = 3 (9%) |
Male = 10 (77%) Female = 3 (23%) |
P = 0.32 |
|
|
Total cholesterol (mg/dL) |
125 (87-208) |
142 (93-226) |
185 (93-266) |
P < 0.001,HIV-vs BL P = 0.005 HIV-vs Wk48 P = 0.004, BL vs Wk48 |
|
LDL (mg/dL) |
73 (51-154) |
84 (45-164) |
100 (34-176) |
P = 0.02, HIV-vs BL P = 0.17, HIV-vs Wk48 P = 0.02, BL vs Wk48 |
|
HDL (mg/dL) |
35 (0-56) |
41 (17-71) |
57 (41-103) |
P < 0.001, HIV-vs BL P < 0.001,HIV-vs Wk48 P = 0.004, BL vs Wk48 |
|
Triglycerides (mg/dL) |
72 (36-162) |
87 (30-200) |
89 (62-205) |
P = 0.48, HIV- vs BL P = 0.95, HIV- vs Wk48 P = 0.34, BL vs Wk48 |
|
Adiponectin (ng/mL) |
4,281 (558-14,652) |
3,599 (445-8,862) |
NA |
P = 0.1 |
|
Leptin (pg/mL) |
2,412 (324-81,415) |
5,855 (76-79,114) |
NA |
P = 0.06 |
|
Lipoprotein insulin resistance (LPIR) score |
52 (10-77) |
53 (10-86) |
42 (1-70) |
P = 0.06, HIV- vs BL P = 0.2, HIV- vs Wk48 P = 0.42, BL vs Wk48 |
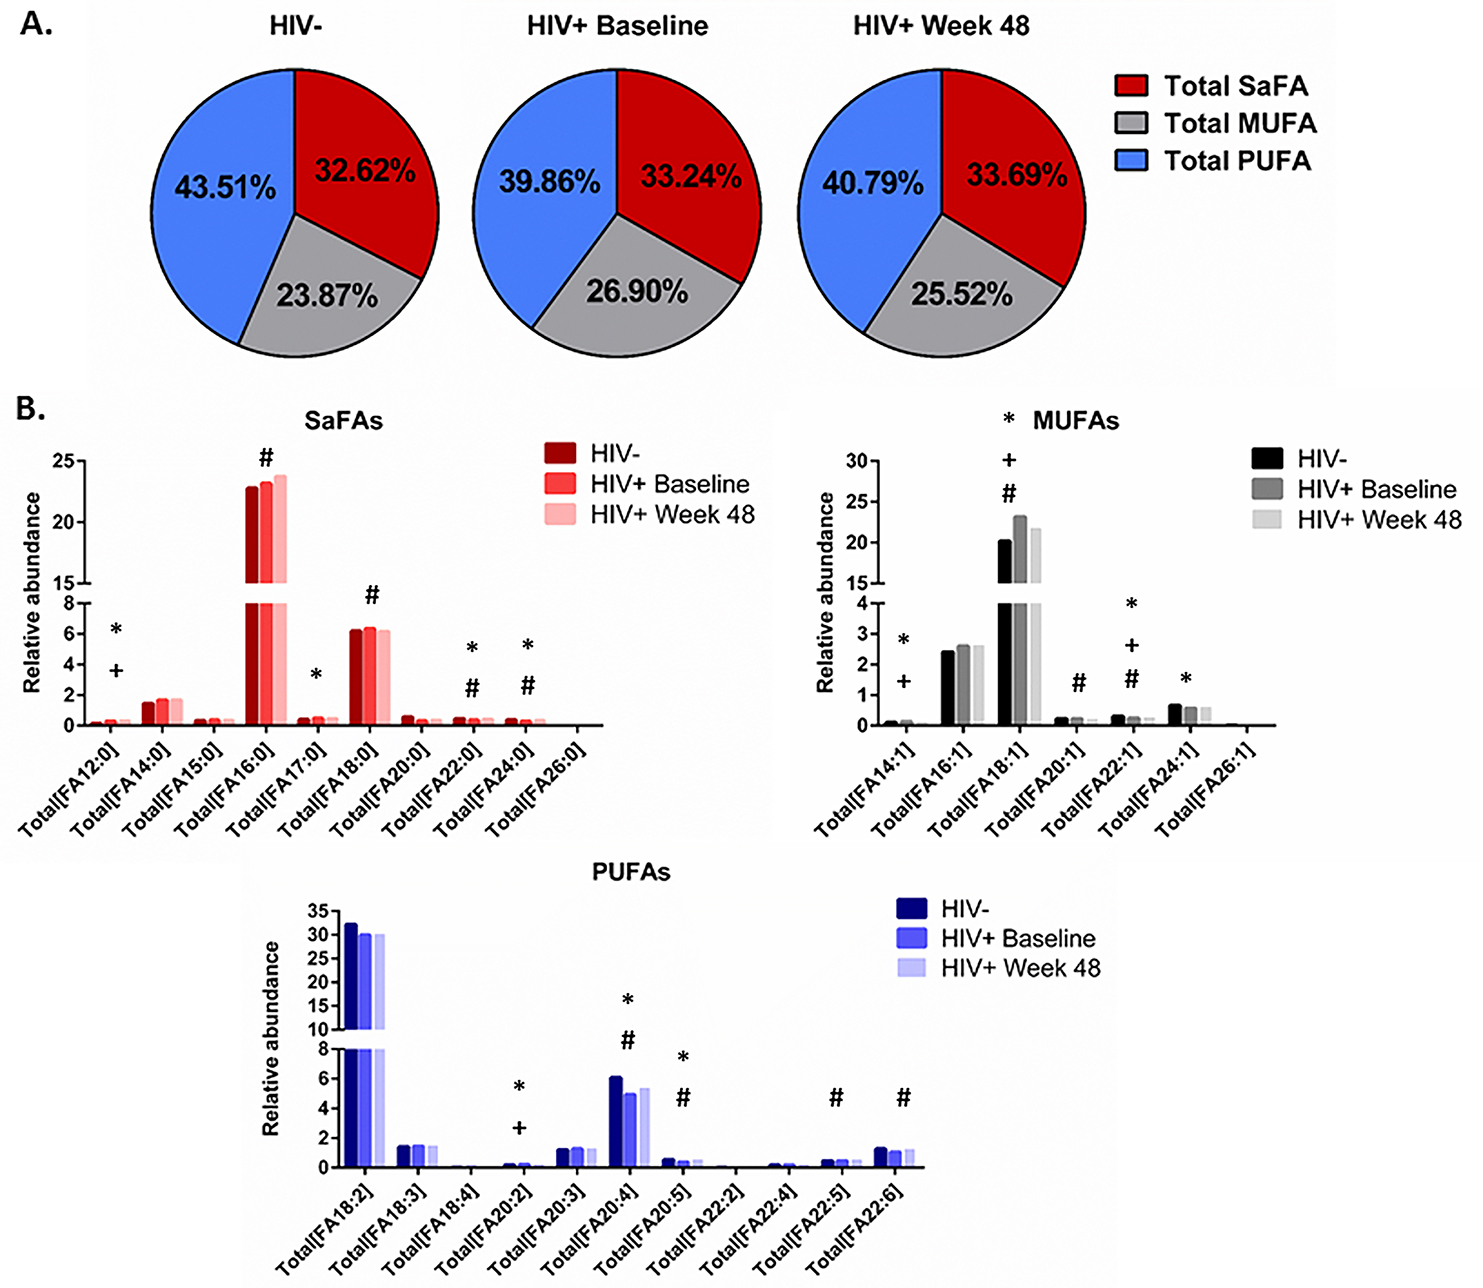
The concentrations of total and free saturated and unsaturated fatty acids are altered in HIV infection and by ART. The concentrations of several fatty acids differed significantly between treatment-naive HIV+ (baseline) and HIV- participants (Supplemental Table 1A, 1B). The overall concentration of free (non-esterified) fatty acids was decreased in HIV+ participants (298.8 µM) at baseline compared to levels in HIV- participants (442.6 µM, P = 0.03); these levels increased by week 48 of ART and were no longer significantly different (351.9 µM, P = 0.12). Levels of free oleic acid (18:1) and levels of several free PUFAs (linoleic acid 18:2, α-linoleic acid 18:3, docosatetraenoic acid 22:4, DPA 22:5, and DHA 22:6) tended to be lower in HIV+ baseline samples. Total fatty acid concentrations of arachidonic acid (20:4) and EPA (20:5) were also lower in HIV+ participants at baseline. Following 48 weeks of ART, levels of many free and total SaFAs, MUFAs, and PUFAs changed from baseline. Levels of free PUFAs (docosatetraenoic acid, DPA, and DHA) and levels of total arachidonic acid and EPA increased significantly from baseline and were no longer different from levels in HIV- participants (Supplemental Table 1A, 1B).
The saturated and unsaturated fatty acid compositions of total and free fatty acids are altered in HIV infection and by ART. We also report that the composition of total and free fatty acids in plasma differed in HIV- and treatment-naive HIV+ participants. Several SaFAs were enriched among total and free fatty acids in HIV infection at baseline compared to levels in HIV- participants (Figures 1 and 2, and Supplemental Tables 2A, 2B), including stearic acid. By comparison, several MUFAs and PUFAs were lower in HIV+ participants at baseline compared to levels in HIV- participants (Figures 1 and 2, and Supplemental Tables 2A, 2B) including free oleic acid (18:1) and α-linoleic acid (18:3) and total EPA (20:5). Many of these fatty acids (eg, stearic, arachidic, and behenic acid) decreased following ART; however, these values remained increased compared to levels measured in HIV- participants. Furthermore, levels of several total PUFAs (eg, EPA 20:5, DPA 22:5, and DHA 22:6) increased significantly from baseline following 48 weeks of ART (Figure 1B and 2B and Supplemental Table 2A, 2B).
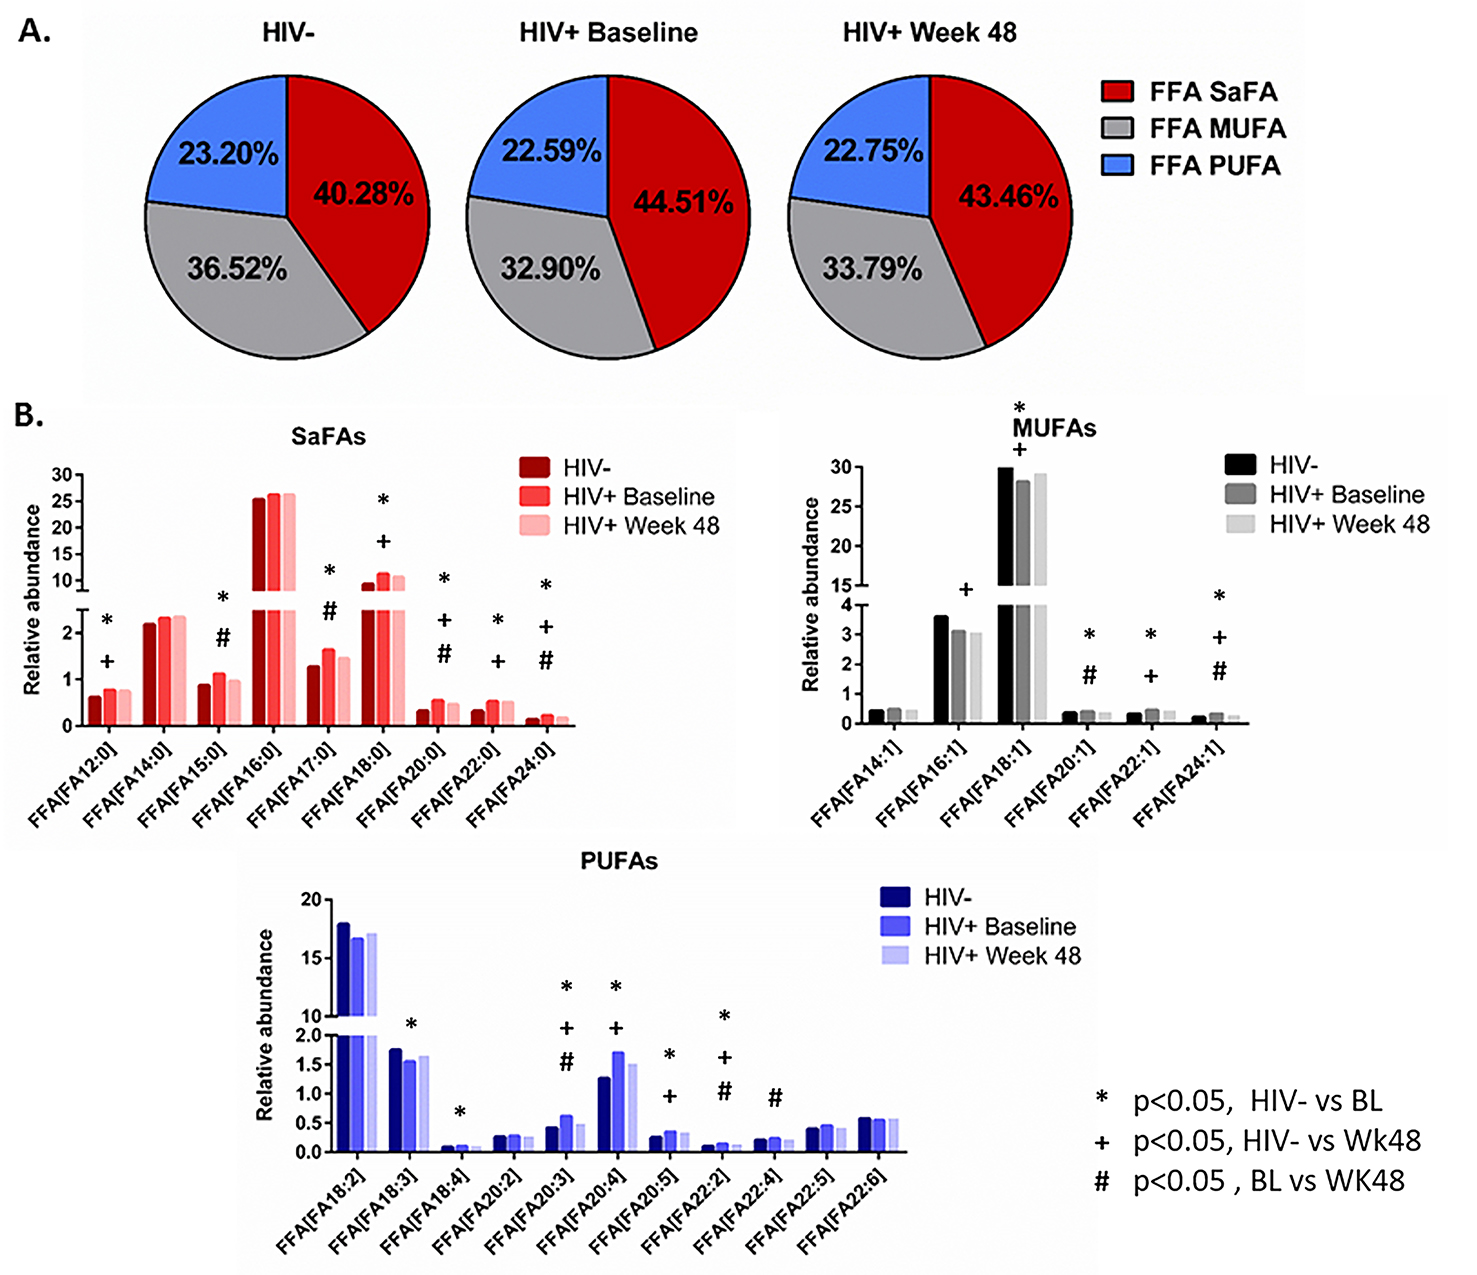
Figure 2. The fatty acid composition of free fatty acids is altered in HIV infection at baseline and week 48 compared to levels in HIV-uninfected participants. Plasma samples were thawed and the proportional representation (mol%) of A) SaFAs, MUFAs, and PUFAs and B) individual lipid molecules among “free” (non-esterified) lipids, were measured by the Complex Lipid Panel (Metabolon). Several changes in the proportional representation of SaFAs, MUFAs, and PUFAs were measured among samples from HIV- participants, and in samples from HIV+ participants pre-ART initiation (baseline) and following 48 weeks of ART. Mean levels are reported. Statistically significant differences among the subject groups are designated; an exploratory value of P<0.05 is used for a cutoff of significance.
Concentrations of total and free fatty acids are associated with markers of immune activation in HIV infection. We observed several relationships among the concentrations of free and total fatty acids and indices of immune activation in HIV+ participants. At baseline, concentrations of many free fatty acids: myristic acid (14:0, r = 0.35, P = 0.04), stearic acid (18:0, r = 0.36, P = 0.04), docosatetraenoic acid (22:4, r = 0.41, P = 0.01), and DPA (22:5, r = 0.48, P = 0.004) were directly related to CD4+ T- cell counts. Among total fatty acids, the concentrations of palmitic acid (16:0, r = 0.49, P = 0.003) stearic acid (18:0, r = 0.47, P = 0.005), linoleic acid (18:2, r = 0.52, P = 0.001), α-linoleic acid (18:3, r = 0.53, P = 0.001), and EPA (20:5, r = 0.35, P = 0.04) were positively correlated with sCD14 levels. The concentrations of total myristic (14:0) and pentadecylic acid (15:0) were associated with both IL-6 and TNFR1 levels. The concentration of total palmitic acid (16:0) was also related to levels of IL-6 (r = 0.33, P = 0.05) and TNFR1 (r = 0.39, P = 0.002), and the concentration of stearic acid (18:0) was also related to levels of TNFR1 (r=0.38, P = 0.02). The total fatty acid concentrations of vaccenic acid (18:1) and α-linoleic acid (18:3) were directly related to levels of TNFR1; total concentrations of 20:1, 20:2, 20:3, and 22:5 were also directly related to TNFR1 (P < 0.05 for all). Following 48 weeks of ART, several other relationships were identified. Among total fatty acids, the concentration of linoleic acid (18:2, r = -0.42, P = 0.015), α-linoleic acid (18:3, r = -0.31, P = 0.08), EPA (20:5, r =-0.31, P = 0.07), and erucic acid (22:1, r = -0.45, P = 0.007) tended to be inversely associated with levels of IL-6. Similarly, the free fatty acid concentration of EPA was also inversely related to IL-6 (r = -0.37, P = 0.04). Furthermore, following 48 weeks of ART, greater increases in the concentrations of total DPA (r = -0.40, P = 0.019), total DHA (r = -0.35, P = 0.04), and non-esterified DHA (r = 0.46, P = 0.006) were associated with greater declines in sCD14 (Figure 3).
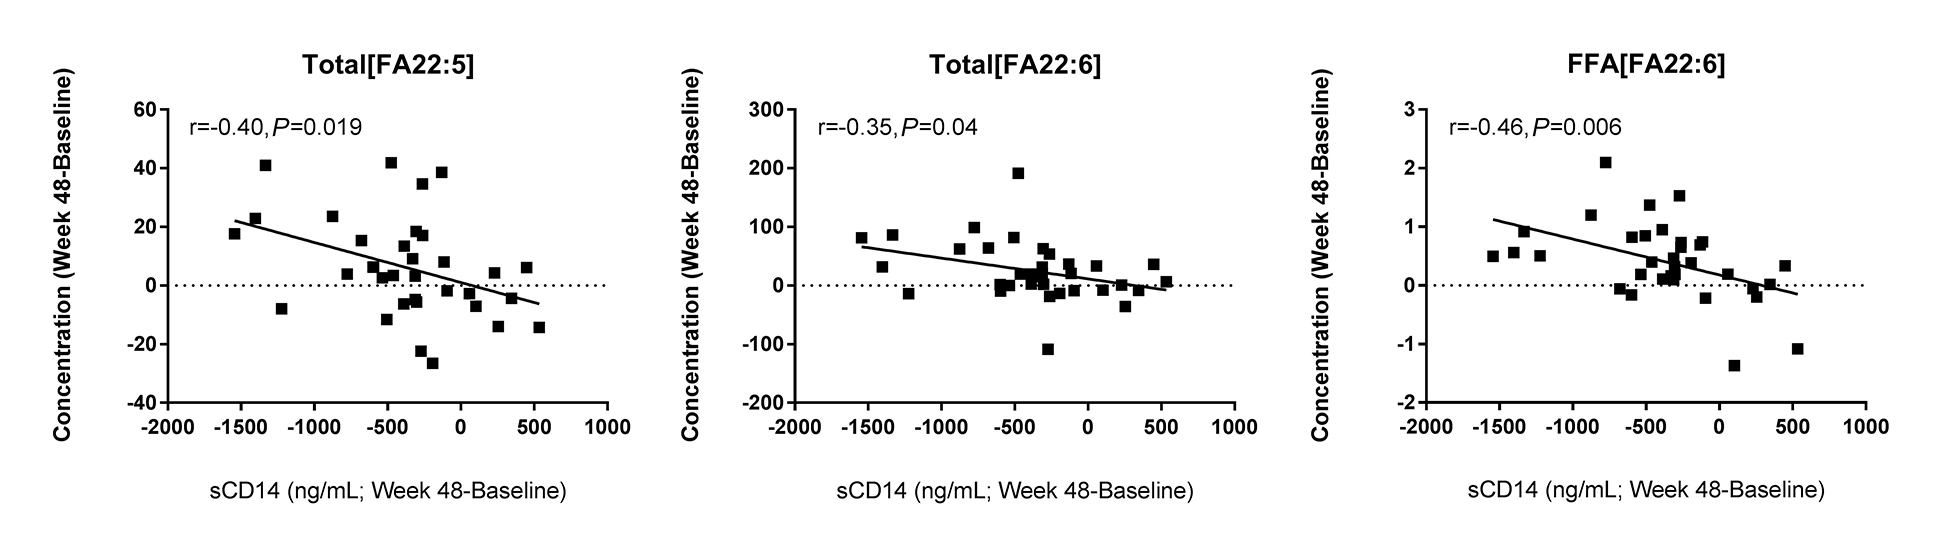
Figure 3. Changes in PUFA levels are associated with changes in sCD14 levels following ART. Plasma samples were thawed and levels of sCD14 were measured by ELISA. Greater increases in PUFA levels were associated with greater decreases in sCD14 levels. Pearson correlations among the changes in these indices (Week 48 - baseline) are reported.
The fatty acid composition of total and free fatty acids are associated with markers of immune activation in HIV infection. At baseline, the fatty acid composition of both free and total fatty acids were related to markers of immune activation and disease progression. The proportional representation of arachidonic acid (20:4) among total fatty acids was directly related to CD4+ T-cell counts (r = 0.35, P = 0.04) and inversely with viremia (-0.38, P = 0.025) and TNFR1 levels (-0.36, P = 0.03). The proportional representations of linoleic acid (18:2), erucic acid (18:1), and arachidonic acid (20:4) were all inversely related to levels of IL-6 and TNFR1 (P < 0.05). Following 48 weeks of ART, the proportional representation of palmitic acid (16:0) among the total fatty acids tended to be positively associated with levels of IL-6 (r = 0.43, P = 0.01), TNFR1 (r = 0.32, P = 0.06), and sCD14 (r = 0.32, P = 0.07). Among free fatty acids, the proportional representation of palmitic acid (16:0) was related to levels of TNFR1 (r = 0.41, P = 0.01). The proportional representations of free lauric acid (12:0) and erucic acid (22:1) were also directly related to levels of sCD14 at week 48 (P < 0.01).
The concentration and the fatty acid composition of LPC is altered in HIV infection and following ART. We next focused on changes in the overall concentration and composition of LPC, as increased levels of this lipid class are associated with CVD [16, 17], renal failure [18], and diabetes [19]. At both baseline and after 48 weeks of ART, the concentration of LPC was greater in HIV+ participants than levels among uninfected controls (202, 213.7, and 184 µM, respectively P=0.003 and 0.002). The concentration of LPC did not change significantly after 48 weeks of ART.
The fatty acid composition of LPC is important for its role in driving inflammation [17, 33, 34]. Therefore, we next asked if the fatty acid composition of LPC was altered by HIV infection and/or with ART. Overall, in HIV + participants at baseline and week 48, the fatty acid composition of LPC was enriched for SaFAs (70.45% and 70.66%, respectively) compared to that of HIV- participants (61.93%, P < 0.001 for both); we also measured a significantly lower proportion of PUFAs in LPC among HIV+ participants at baseline and week 48 (17.34% and 17.33%) compared to the proportion of PUFAs within LPCs in HIV- participants (24.76%, P < 0.001 for both, Figure 4A). Furthermore, the composition of LPC was enriched for specific SaFAs: lauric acid (12:0), palmitic acid (16:0), stearic acid (18:0), and arachidic acid (20:0) in HIV+ participants at baseline and at week 48 compared to the composition of LPC in HIV- participants (Figure 4B and Supplemental Table 3B). Conversely, the composition of LPC in HIV- participants was enriched for MUFAs and PUFAs, including: octadecaenoic acid (18:1), eicosenoic acid (20:1), linoleic acid (18:2), arachidonic acid (20:4), and EPA (20:5), compared to the composition of LPC in HIV+ participants at baseline and following 48 weeks of ART (Figure 4B). Treatment for 48 weeks with ART resulted in significant increases in the proportions of LPC molecules containing the SaFAs palmitic acid (16:0) and arachidic acid (20:0) and the PUFA eicosadienoic acid (20:2) compared to baseline. Treatment with ART reduced the proportional representation of stearic acid (18:0) among LPC molecules, but these levels remained increased compared to levels in HIV- participants. The concentrations of several SaFA-containing LPC molecules were increased in HIV+ participants at both baseline and following 48 weeks of ART, compared to levels in uninfected participants (Supplemental Table 3A).
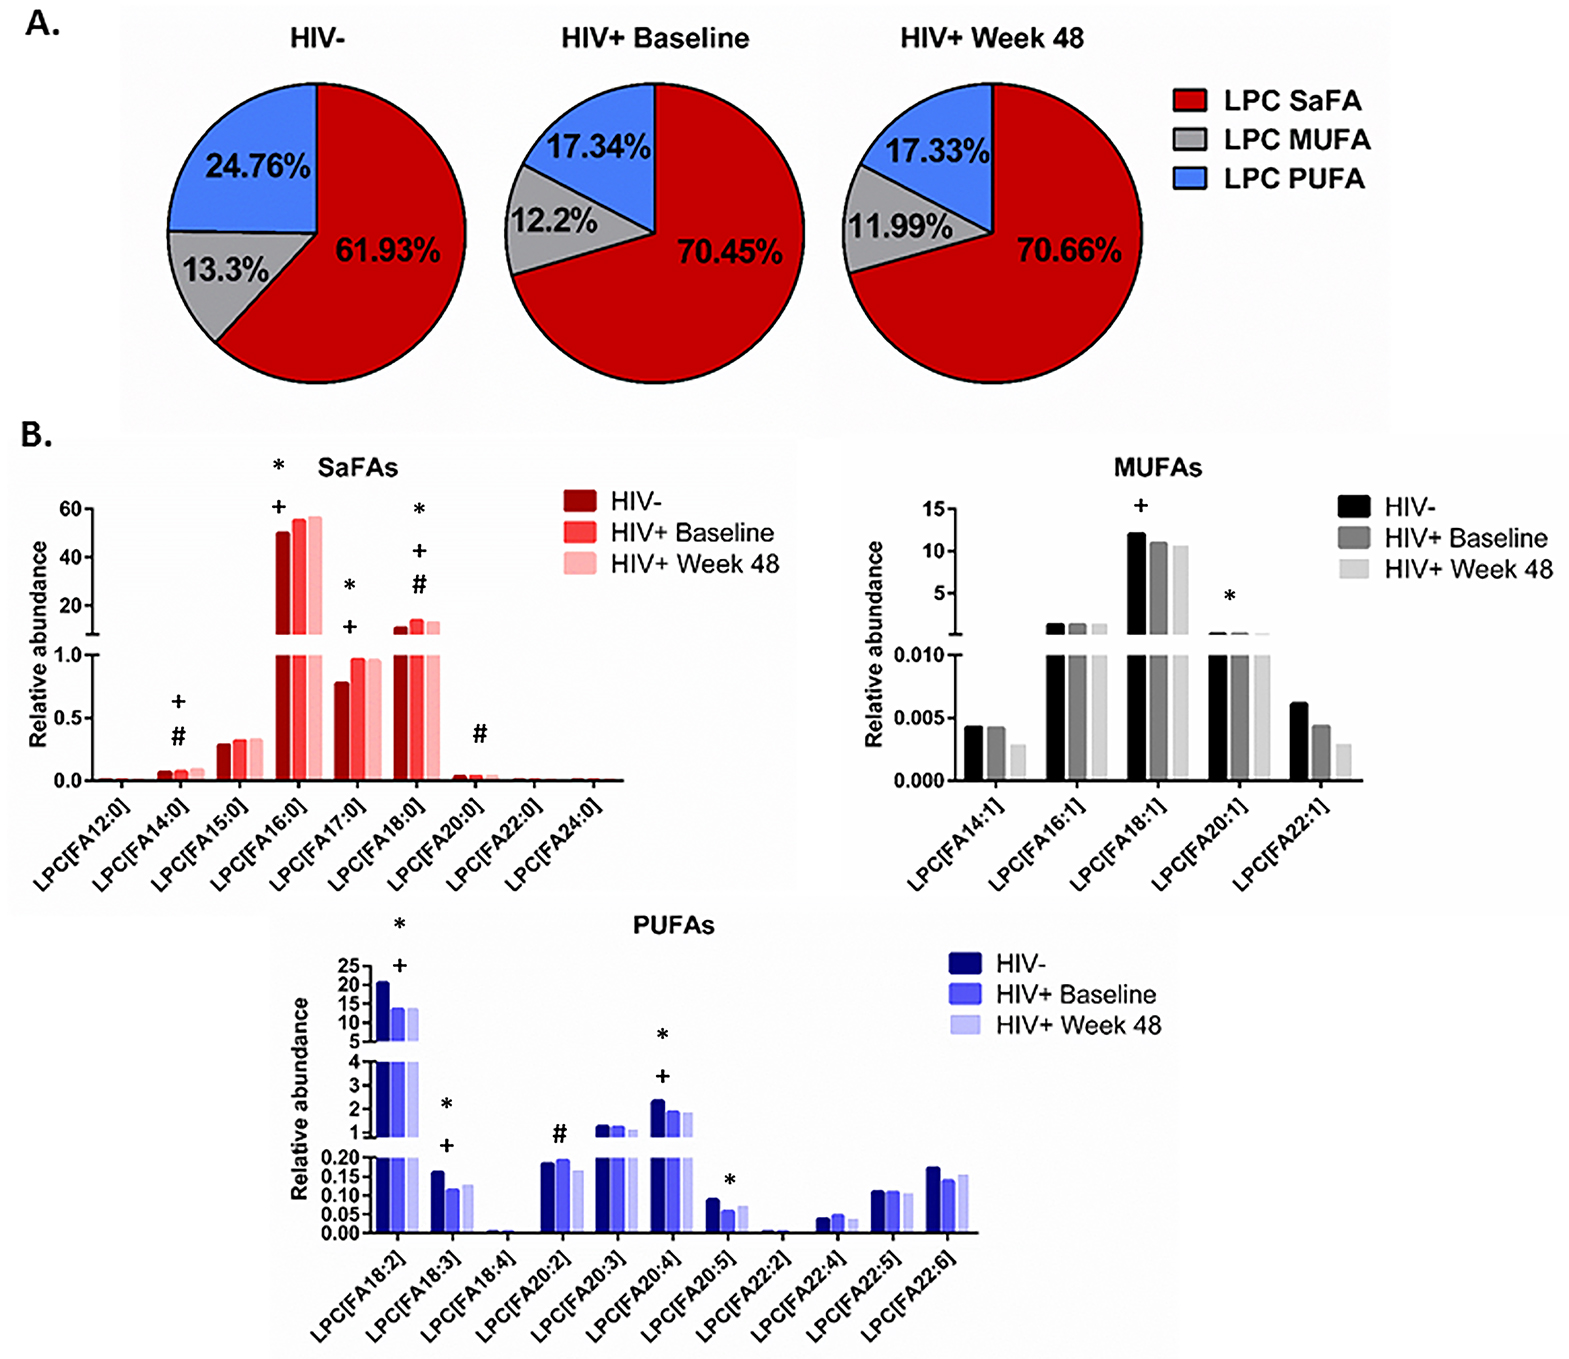
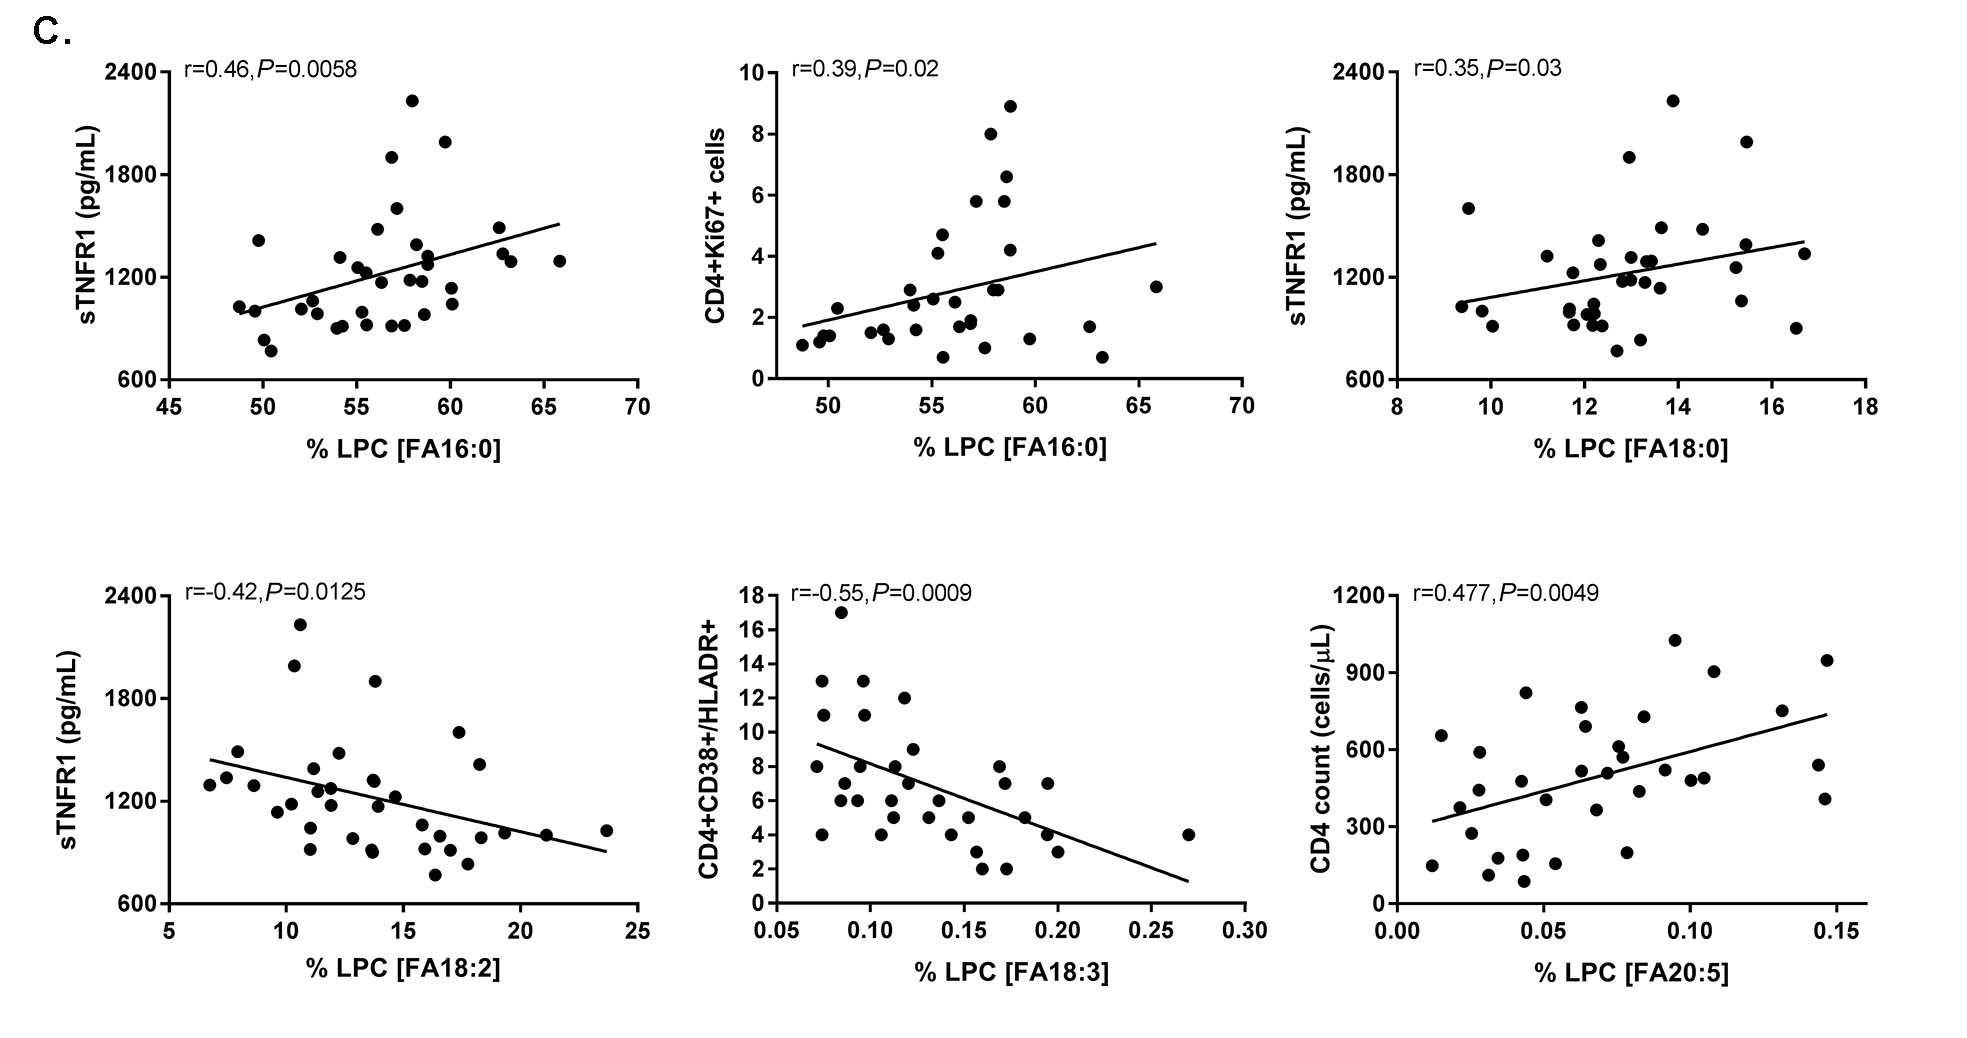
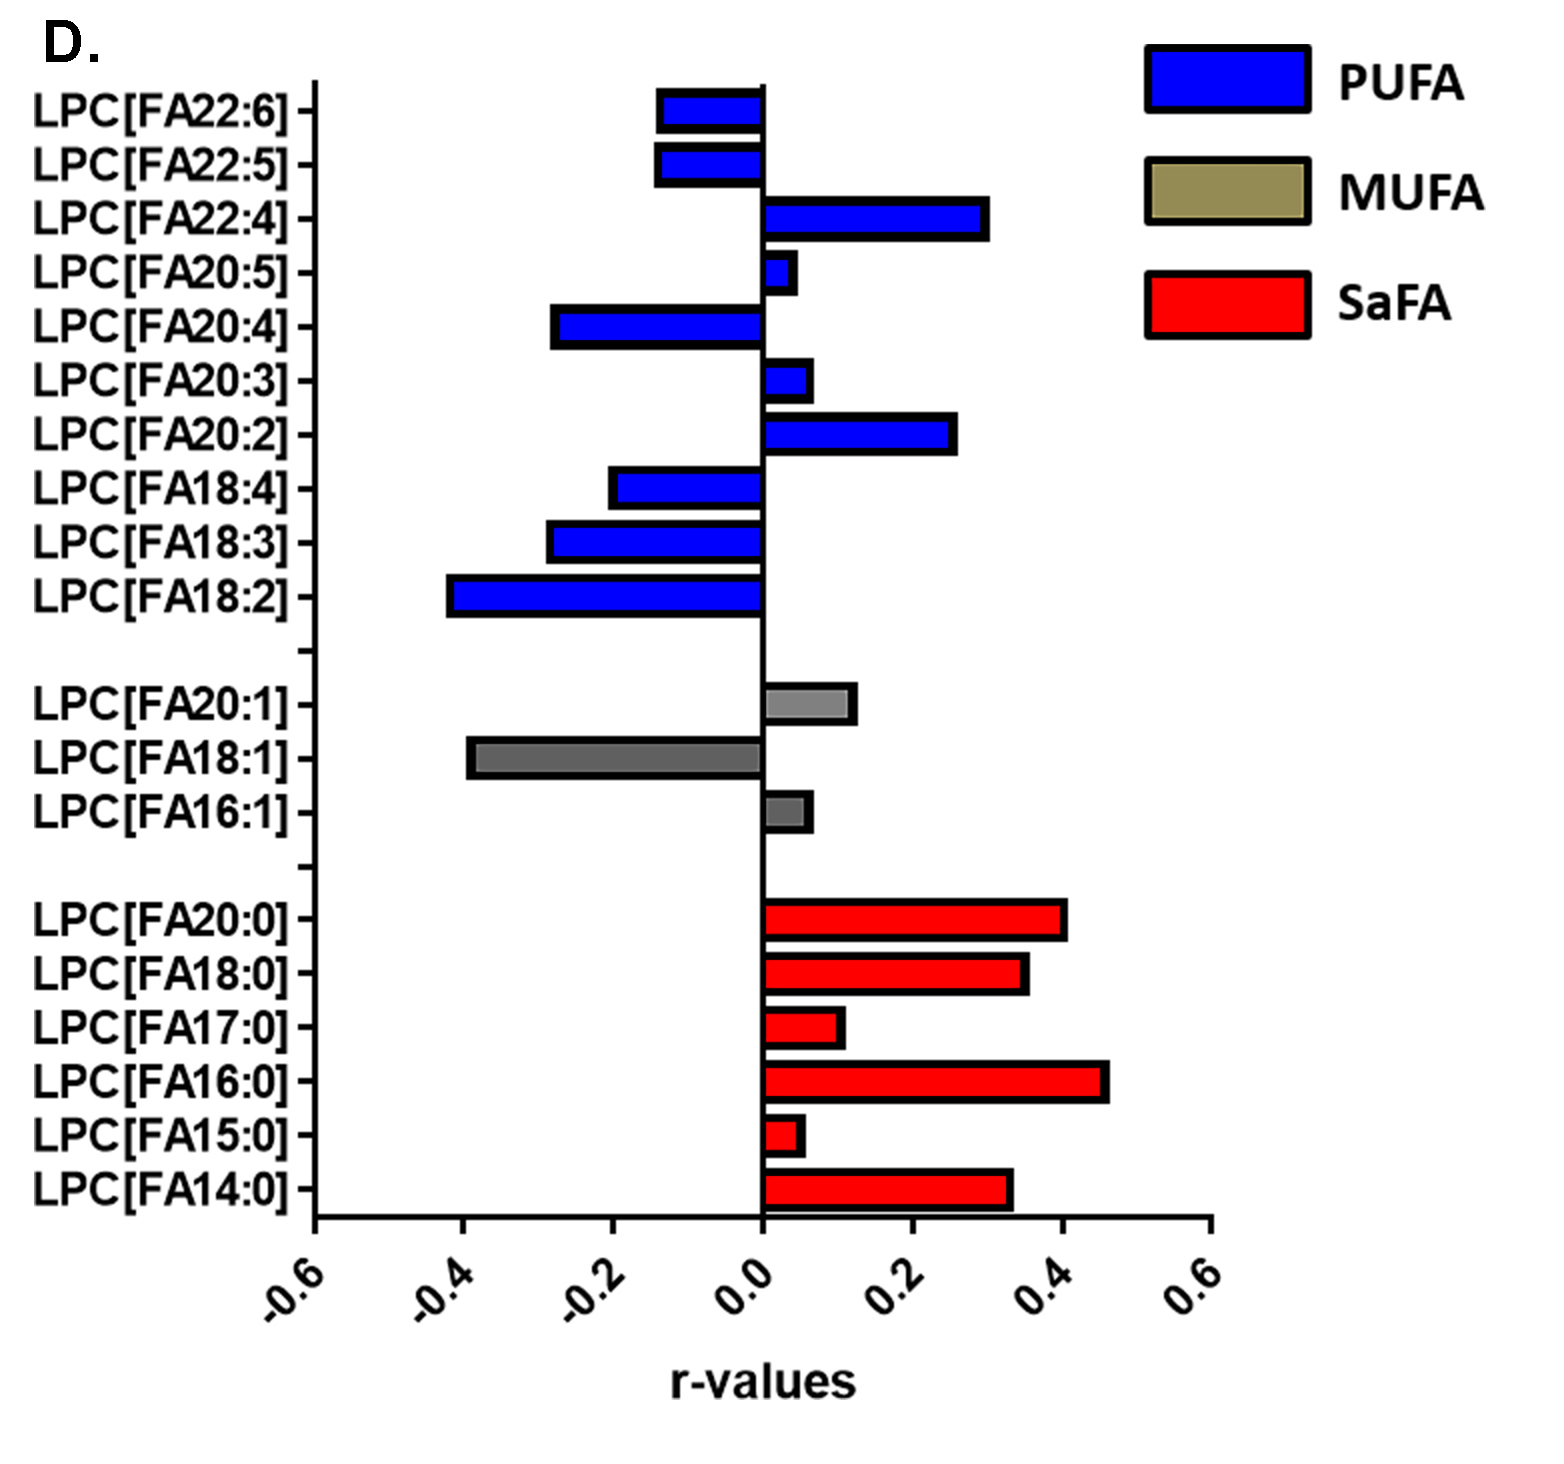
Figure 4. The fatty acid composition of LPC is altered in HIV infection at baseline and week 48 compared to levels in HIV-uninfected participants and is associated with markers of immune activation. Plasma samples were thawed and the proportional representation (mol%) of A) SaFAs, MUFAs, and PUFAs and B) individual lipid molecules among the lysophosphatidylcholine lipid class were measured by the Complex Lipid Panel (Metabolon). Several changes in the proportional representation of SaFAs, MUFAs, and PUFAs were measured among samples from HIV- participants, and in samples from HIV+ participants pre-ART initiation (baseline) and following 48 weeks of ART. Mean levels are reported. C) Plasma and cryopreserved peripheral blood mononuclear cell (PBMC) samples were thawed and levels of immune activation were measured by ELISA or by flow cytometry. Pearson correlation values are reported for relationships among immune activation/disease progression markers and lipid levels. Statistically significant differences among the participant groups are designated; an exploratory value of P<0.05 is used for a cutoff of significance. D) The fatty acid composition of LPC molecules is associated with levels of immune activation, including TNFR1. At 48 weeks, LPC molecules containing SaFAs (red) are directly related to levels of TNFR1; levels of PUFA containing LPC molecules (blue) are typically inversely related to TNFR1 levels.
Relationships exist among the concentration and composition of saturated and unsaturated fatty acid containing LPC and markers of inflammation. At baseline, the plasma concentration (µM) of LPC 20:5 tended to be inversely associated with viremia (r = -0.3, P = 0.07). Also at baseline, the proportional representation of LPC 16:1 was directly related to IL-6 levels (r = 0.44, P = 0.009) and the proportion of LPC 22:4 tended to be inversely related to the proportion of CD4+ T cells co-expressing CD38 and HLA-DR (r = -0.32 P = 0.07).
Following 48 weeks of ART, we found more relationships among plasma concentrations of LPC molecules, the proportional representation of fatty acids within LPC, and markers of immune activation. The plasma concentrations of LPC 14:0 (r= 0.4, P=0.02) and LPC 20:0 (r=0.37, P=0.03) were directly related to sCD14 levels; and the concentration of several PUFA containing LPCs (18:2, 18:3, 20:4, 20:5, 22:5, 22:6) were inversely related to levels of IL-6 (P < 0.05 for all). Plasma concentrations of LPC 20:4, 20:5, 22:5, and 22:6, were directly related to CD4+ T-cell counts (P < 0.05, for all). The proportional representation (composition, mol%) of several SaFA containing LPCs were also directly related to markers of inflammation at week 48. We observed a direct relationship between the mol% of LPC 14:0 and TNFR1 (r=0.33, P = 0.05) and sCD14 (r= 0.43, P = 0.01); the mol% of LPC 20:0 was directly related to levels of sCD14 (r=0.38, P=0.03), D-dimer (r = 0.46, P = 0.005), and TNFR1 levels (r = 0.4, P = 0.02). The proportional representation of LPC molecules that contain palmitic acid (16:0) was directly related to sTNFR1 (r = 0.46, P = 0.0058) and the percentage of CD4+Ki67+ cells (r = 0.39, P = 0.02, Figure 4C); levels of stearic acid (18:0) containing LPC were related to TNFR1 levels (r = 0.35, P = 0.03, Figure 4C).
The proportional representations of many PUFA-containing LPCs were inversely related to immune activation markers. The proportions of LPC 20:5, 22:5, and 22:6, were directly related to CD4+ T-cell counts (P < 0.01 for all). The proportion of LPC molecules containing 18:2 was inversely related to TNFR1 (r = -0.42, P = 0.0125, Figure 4C). The proportional representation of LPC 18:3 was inversely related to levels of D-Dimer and IL-6, the proportions of CD38+HLA-DR+ CD4+ (Figure 4C) and CD8+ cells, and the proportion of Ki67+ CD4+ T cells (not shown). In general, LPC molecules containing SaFAs were directly associated with markers of immune activation, while PUFA-containing LPC molecules were inversely related to levels of immune activation. Representative data for associations among LPC molecules and levels of TNFR1 are shown in Figure 4D.
This is a substudy of A5248, in which we previously reported longitudinal reductions in viremia [27] and immune activation [28, 30], and improvement in lipid particle size and cholesterol efflux [29] among study participants initiating ART; many of these indices improved over time, but did not approach levels measured in HIV- populations. Here, we extend those findings to report changes in SaFA, MUFA, and PUFA concentrations (µM) and composition (mol%) among total, free (non-esterified), and LPC lipid molecules, and associations among these indices and immune activation.
Infection with HIV and treatment with ART can alter lipid profiles [1, 2], but earlier studies have provided only a crude assessment of changes in lipids. Here, we measured the concentrations of lipid species and fatty acid composition of plasma samples in HIV+ individuals at baseline and 48 weeks following ART and compared these levels to those of an HIV-uninfected population. We have demonstrated that total and non-esterified SaFA levels and LPC molecules enriched for SaFAs may contribute to a pro-inflammatory environment in HIV infection, even during suppressive ART, and this may contribute to the development and progression of comorbidities associated with this population. The relationship between lipids and inflammation is complex; lipids, especially SaFAs [10] and oxidized lipids [22, 23], can promote inflammation, and chronic inflammation can alter lipid processing and transport [20].
The relationship between lipids and inflammation is complicated further by MUFAs and PUFAs, as these unsaturated lipids may reduce inflammation [13-15, 17]. Our findings corroborate that PUFAs within total fatty acids, free fatty acids, and LPC molecules appear to be anti-inflammatory, based on several inverse relationships among levels of PUFAs and inflammatory markers, as well as our finding that greater increases in PUFA levels were associated with greater declines in sCD14 levels. We report that the concentrations and the proportional representation of many SaFAs are increased, and the PUFAs are decreased, in ART-naive participants compared to those indices among HIV- participants. Following 48 weeks of ART, levels of many PUFAs, including EPA (20:5), DPA (22:5), and DHA (22:6), increased significantly and often approached levels measured in HIV- participants.
Levels of SaFAs, MUFAs, and PUFAs may be involved in the development and progression of several disease states, as levels of these lipids are altered among individuals with CVD, diabetes, metabolic syndrome, non-alcoholic steatohepatitis (NASH), and obesity in HIV- populations [4-8]. Furthermore, levels of stearic acid and total SaFAs are increased in patients with diabetes, while levels of total PUFAs are lower in these patients than among controls [7]. Serum levels of ω3 PUFAs, including EPA, are inversely related to soft plaque scores [5], and increased concentrations of PUFAs are associated with a decreased risk of non-fatal myocardial infarction in women [8] and an overall decrease in CVD risk, based on a meta-analysis by the American Heart Association [9].
Previous studies have also reported mechanistic details about potential pro- and anti-inflammatory effects of SaFAs and PUFAs, providing insights into how these lipids may directly alter disease courses. Exposure of myeloid cells in vitro to SaFAs, specifically stearic acid, can activate the inflammasome and induce IL-1β release [10]. Palmitic acid can also activate a macrophage cell line to express TNF-α by a TLR4 and NFKB dependent mechanism [11, 35]. Polyunsaturated fatty acids, on the other hand, including EPA and DHA, can inhibit inflammasome activation and induction of TNFα and IL-1β by TLR ligands [14]. Chronic inflammation underlies the progression of many diseases, including CVD and HIV [36]; and an imbalance in SaFAs and PUFAs may contribute to chronic inflammation [10]. Modulation of innate immune signaling by PUFAs may be important in HIV infection, as microbial translocation and recognition of microbial products by TLRs has been implicated in the persistence of inflammation during virologic control [36]. The temporal and causal relationships among changes in the lipidome and changes in inflammatory biomarkers cannot be adequately assessed in this preliminary study, but should be explored in the future. Of interest, more well-defined positive associations among SaFAs and inflammation, and inverse associations among PUFAs and inflammation, were identified at week 48 than were seen at baseline. This is potentially due to ART-induced reductions in other drivers of immune activation (ie, HIV replication, lymphocytopenia, and LPS) [28]
We also measured levels of LPC, a lipid class that contains one variable fatty acid chain and is derived from the partial hydrolysis of phosphatidylcholine. Levels of LPC are increased in several diseases, including CVD [16, 17] and diabetes [19]. We report for the first time, that the concentration of LPC was elevated in treatment naive, HIV+ participants and remains high following 48 weeks of ART compared to levels in HIV- participants. The levels in HIV+ participants are similar to those reported in HIV- patients with diabetes (~200 µM) [19]. The fatty acid composition of LPC molecules likely plays a role in function; LPC molecules that contain SaFAs are often pro-inflammatory, while LPC containing PUFAs can be anti-inflammatory [17]. The fatty acid composition of LPC has also been associated with CVD; species of LPC that contain PUFAs (20:3, 20:4, 22:6) were positively associated with stable, versus unstable, coronary artery disease [37]. Here, we demonstrate that among HIV+ participants, LPC molecules are enriched for SaFAs, including LPC 16:0, 17:0, and 18:0, while levels of PUFA containing LPC molecules are decreased, compared to levels in HIV- participants. Treatment with ART tended to decrease levels of SaFA containing LPCs and increase LPC containing PUFAs; however, levels of these individual LPC molecules did not often reach levels measured in HIV- participants. 17]; LPC is a component of oxLDL [21], a molecule that induces inflammatory cytokine expression through activation of the inflammasome [22, 23]. Vascular smooth muscle cells [38] and endothelial cells [34] can be activated by LPC to express pro-inflammatory cytokines. Human monocyte-derived dendritic cells can also be activated by LPC containing palmitic (16:0) and stearic acid (18:0) to increase costimulatory molecule expression and production of IL-8, IP-10, and MIP-1β [33]. In mice, intraperitoneal injection of saturated fatty acid (16:0 and 18:0) containing LPC molecules resulted in increased peritoneal inflammatory cytokine levels and leukocyte migration into tissue sites; administration of PUFA-enriched LPC (20:4, and 22:6) blocked these effects [33].In our current study, we report direct relationships among the concentrations and composition of several SaFAs among “free”, “total”, and LPC molecules and markers of immune activation and inflammation (including IL-6, sCD14, D-dimer, TNFR-1) that are predictive of morbidity and mortality in HIV infection [39-42]. In addition, levels of PUFAs were inversely related to markers of immune activation, and following 48 weeks of ART, greater increases in DPA (22:5) and DHA (22:6) were associated with greater decreases in sCD14 levels. While these associations do not prove causality, SaFAs and PUFAs have been reported to modulate activation of monocyte and endothelial cells [10, 12, 15], cell types that may be crucial for the development and progression of CVD. Thus, additional study is warranted to determine whether increases in PUFA levels directly modulate innate immune signaling in monocytes, reducing cellular activation. We have reported previously that levels of inflammation and immune activation improved following 48 weeks of ART, but did not often reach levels measured in HIV- participants, despite undetectable viral loads [28, 30]. Additional study is also needed to determine the extent to which alterations in the lipid species we report here account for residual inflammation in ART-treated populations. As we and others have shown, increased monocyte and endothelial cell activation in HIV+ individuals [43-47], detailed characterization of the in vivo and in vitro relationships among fatty acid species, and cellular activation may help elucidate the determinants of the increased risk of CVD reported in HIV infection. In our own preliminary, unpublished, in vitro work, we find that palmitic and stearic acid tend to enhance LPS-induced activation of endothelial cells and myeloid cells, while LPC molecules enriched for PUFAs tend to inhibit the effects of LPS.
This study has some limitations. First, we do not have information about socioeconomic status or the dietary intake of our study participants; diet likely plays an important role in plasma lipid profiles, but as we are comparing lipid levels in the same HIV+ participants over time, dramatic changes in diet are not likely. Similarly, we do not have information on body composition or metabolic hormone status for our participants, 2 aspects of cardiometabolic health that are affected by HIV infection and ART [48]. Our HIV- and HIV+ groups are not ideally matched, but we are encouraged by the findings that ART improved the lipid profile of the baseline HIV+ participants, causing week-48 profiles to be more similar to those measured in our HIV- participants. We predicted this outcome; that ART improves, but does not often “normalize” lipid profiles in individuals with persistent low level inflammation. The parent study was not powered to explore relationships among these lipid species and immune activation, and we did not correct for multiple comparisons in this initial, exploratory investigation. In addition, we do not have information on whether the participants in both groups were concurrently taking other immunomodulatory medications such as statins and aspirin. Because the HIV+ participants were all initiating the same ART regimen, we also do not know if similar findings would be seen in ART-treated individuals or whether or not other ART regimens would induce similar changes in lipid levels. Thus, findings of modest nominal statistical significance should be viewed as preliminary and exploratory, and drawing causal linkages between changes in lipids and inflammation should be done cautiously. Nonetheless, our findings suggest SaFAs in plasma, and particularly within the LPC class, may contribute to inflammation/immune activation in HIV infection, and that increases in PUFAs may contribute to decreasing inflammation following ART. Further studies investigating the complex interactions among lipid species, inflammation, and morbid outcomes in HIV infection are warranted.
The authors would like to thank the Bad Boys of Cleveland/the Cleveland Immunopathogenesis Consortium for their insights and feedback on this work, and the AIDS Clinical Trials Group A5248 study team, participants, and research sites.
N.T.F. has served as a paid consultant for Gilead Science Inc. M.M.L. has served as a paid consultant for Merck; D.R.K. has received consulting and speaking honoraria and grant support from Merck and Gilead. J.E.L. has served as a paid consultant to Gilead and Merck, and has received grant support from Gilead Sciences. For all other authors, no disclosures were declared.
All authors contributed to experimental design, data analysis, and writing of the manuscript.
1. Funderburg NT, Mehta NN. Lipid Abnormalities and Inflammation in HIV Inflection. Curr HIV/AIDS Rep. 2016;13(4):218-25. PubMed PMID: 27245605. Pubmed Central PMCID: PMC4977198. doi: 10.1007/s11904-016-0321-0
2. Lake JE, Currier JS. Metabolic disease in HIV infection. Lancet Infect Dis. 2013;13(11):964-75. PubMed PMID: 24156897. doi: 10.1016/S1473-3099(13)70271-8
3. Munger AM, Chow DC, Playford MP, Parikh NI, Gangcuangco LM, Nakamoto BK, Kallianpur KJ, Ndhlovu LC, Shikuma CM, Mehta NN. Characterization of Lipid Composition and High-Density Lipoprotein Function in HIV-Infected Individuals on Stable Antiretroviral Regimens. AIDS Res Hum Retroviruses. 2015;31(2):221-8. PubMed PMID: 25416403. Pubmed Central PMCID: 4313425. doi: 10.1089/AID.2014.0239
4. Martinelli N, Girelli D, Malerba G, Guarini P, Illig T, Trabetti E, Sandri M, Friso S, Pizzolo F, Schaeffer L, Heinrich J, Pignatti PF, Corrocher R, Olivieri O. FADS genotypes and desaturase activity estimated by the ratio of arachidonic acid to linoleic acid are associated with inflammation and coronary artery disease. Am J Clin Nutr. 2008;88(4):941-9. PubMed PMID: 18842780.
5. Ueeda M, Doumei T, Takaya Y, Shinohata R, Katayama Y, Ohnishi N, Takaishi A, Miyoshi T, Hirohata S, Kusachi S. Serum N-3 polyunsaturated fatty acid levels correlate with the extent of coronary plaques and calcifications in patients with acute myocardial infarction. Circ J. 2008;72(11):1836-43. PubMed PMID: 18812674.
6. de Almeida IT, Cortez-Pinto H, Fidalgo G, Rodrigues D, Camilo ME. Plasma total and free fatty acids composition in human non-alcoholic steatohepatitis. Clin Nutr. 2002;21(3):219-23. PubMed PMID: 12127930.
7. Hodge AM, English DR, O'Dea K, Sinclair AJ, Makrides M, Gibson RA, Giles GG. Plasma phospholipid and dietary fatty acids as predictors of type 2 diabetes: interpreting the role of linoleic acid. Am J Clin Nutr. 2007;86(1):189-97. PubMed PMID: 17616780.
8. Sun Q, Ma J, Campos H, Rexrode KM, Albert CM, Mozaffarian D, Hu FB. Blood concentrations of individual long-chain n-3 fatty acids and risk of nonfatal myocardial infarction. Am J Clin Nutr. 2008;88(1):216-23. PubMed PMID: 18614744.
9. Sacks FM, Lichtenstein AH, Wu JHY, Appel LJ, Creager MA, Kris-Etherton PM, Miller M, Rimm EB, Rudel LL, Robinson JG, Stone NJ, Van Horn LV, American Heart A. Dietary Fats and Cardiovascular Disease: A Presidential Advisory From the American Heart Association. Circulation. 2017. PubMed PMID: 28620111. doi: 10.1161/CIR.0000000000000510
10. Robblee MM, Kim CC, Porter Abate J, Valdearcos M, Sandlund KL, Shenoy MK, Volmer R, Iwawaki T, Koliwad SK. Saturated Fatty Acids Engage an IRE1alpha-Dependent Pathway to Activate the NLRP3 Inflammasome in Myeloid Cells. Cell Rep. 2016;14(11):2611-23. PubMed PMID: 26971994. doi: 10.1016/j.celrep.2016.02.053
11. Suganami T, Tanimoto-Koyama K, Nishida J, Itoh M, Yuan X, Mizuarai S, Kotani H, Yamaoka S, Miyake K, Aoe S, Kamei Y, Ogawa Y. Role of the Toll-like receptor 4/NF-kappaB pathway in saturated fatty acid-induced inflammatory changes in the interaction between adipocytes and macrophages. Arterioscler Thromb Vasc Biol. 2007;27(1):84-91. PubMed PMID: 17082484. doi: 10.1161/01.ATV.0000251608.09329.9a
12. Reissig D, Rassoul F, Salvetter J, Wagner O, Richter V. Effect of fatty acids on expression of endothelial leukocyte adhesion molecules. Eur J Nutr. 2003;42(4):224-7. PubMed PMID: 12923654. doi: 10.1007/s00394-003-0408-4
13. Yan Y, Jiang W, Spinetti T, Tardivel A, Castillo R, Bourquin C, Guarda G, Tian Z, Tschopp J, Zhou R. Omega-3 fatty acids prevent inflammation and metabolic disorder through inhibition of NLRP3 inflammasome activation. Immunity. 2013;38(6):1154-63. PubMed PMID: 23809162. doi: 10.1016/j.immuni.2013.05.015
14. Oh DY, Talukdar S, Bae EJ, Imamura T, Morinaga H, Fan W, Li P, Lu WJ, Watkins SM, Olefsky JM. GPR120 is an omega-3 fatty acid receptor mediating potent anti-inflammatory and insulin-sensitizing effects. Cell. 2010;142(5):687-98. PubMed PMID: 20813258. Pubmed Central PMCID: PMC2956412. doi: 10.1016/j.cell.2010.07.041
15. Yamada H, Yoshida M, Nakano Y, Suganami T, Satoh N, Mita T, Azuma K, Itoh M, Yamamoto Y, Kamei Y, Horie M, Watada H, Ogawa Y. In vivo and in vitro inhibition of monocyte adhesion to endothelial cells and endothelial adhesion molecules by eicosapentaenoic acid. Arterioscler Thromb Vasc Biol. 2008;28(12):2173-9. PubMed PMID: 18948636. doi: 10.1161/ATVBAHA.108.171736
16. Wells IC, Peitzmeier G, Vincent JK. Lecithin: cholesterol acyltransferase and lysolecithin in coronary atherosclerosis. Exp Mol Pathol. 1986;45(3):303-10. PubMed PMID: 3466803.
17. Akerele OA, Cheema SK. Fatty acyl composition of lysophosphatidylcholine is important in atherosclerosis. Med Hypotheses. 2015. PubMed PMID: 26604024. doi: 10.1016/j.mehy.2015.10.013
18. Sasagawa T, Suzuki K, Shiota T, Kondo T, Okita M. The significance of plasma lysophospholipids in patients with renal failure on hemodialysis. J Nutr Sci Vitaminol (Tokyo). 1998;44(6):809-18. PubMed PMID: 10197312.
19. Rabini RA, Galassi R, Fumelli P, Dousset N, Solera ML, Valdiguie P, Curatola G, Ferretti G, Taus M, Mazzanti L. Reduced Na(+)-K(+)-ATPase activity and plasma lysophosphatidylcholine concentrations in diabetic patients. Diabetes. 1994;43(7):915-9. PubMed PMID: 8013757.
20. Tall AR, Yvan-Charvet L. Cholesterol, inflammation and innate immunity. Nat Rev Immunol. 2015;15(2):104-16. PubMed PMID: 25614320. doi: 10.1038/nri3793
21. Wu R, Huang YH, Elinder LS, Frostegard J. Lysophosphatidylcholine is involved in the antigenicity of oxidized LDL. Arterioscler Thromb Vasc Biol. 1998;18(4):626-30. PubMed PMID: 9555869.
22. Sheedy FJ, Grebe A, Rayner KJ, Kalantari P, Ramkhelawon B, Carpenter SB, Becker CE, Ediriweera HN, Mullick AE, Golenbock DT, Stuart LM, Latz E, Fitzgerald KA, Moore KJ. CD36 coordinates NLRP3 inflammasome activation by facilitating intracellular nucleation of soluble ligands into particulate ligands in sterile inflammation. Nat Immunol. 2013;14(8):812-20. PubMed PMID: 23812099. Pubmed Central PMCID: 3720827. doi: 10.1038/ni.2639
23. Stewart CR, Stuart LM, Wilkinson K, van Gils JM, Deng J, Halle A, Rayner KJ, Boyer L, Zhong R, Frazier WA, Lacy-Hulbert A, El Khoury J, Golenbock DT, Moore KJ. CD36 ligands promote sterile inflammation through assembly of a Toll-like receptor 4 and 6 heterodimer. Nat Immunol. 2010;11(2):155-61. PubMed PMID: 20037584. Pubmed Central PMCID: 2809046. doi: 10.1038/ni.1836
24. Zidar DA, Juchnowski S, Ferrari B, Clagett B, Pilch-Cooper HA, Rose S, Rodriguez B, McComsey GA, Sieg SF, Mehta NN, Lederman MM, Funderburg NT. Oxidized LDL levels are increased in HIV infection and may drive monocyte activation. J Acquir Immune Defic Syndr. 2015. PubMed PMID: 25647528. doi: 10.1097/QAI.0000000000000566
25. Hileman CO, Turner R, N TF, Semba RD, McComsey GA. Changes in oxidized lipids drive the improvement in monocyte activation and vascular disease after statin therapy in HIV. Aids. 2016;30(1):65-73. PubMed PMID: 26731754. doi: 10.1097/QAD.0000000000000885
26. Nou E, Lu MT, Looby SE, Fitch KV, Kim EA, Lee H, Hoffmann U, Grinspoon SK, Lo J. Serum oxidized low-density lipoprotein decreases in response to statin therapy and relates independently to reductions in coronary plaque in patients with HIV. Aids. 2016;30(4):583-90. PubMed PMID: 26558731. doi: 10.1097/QAD.0000000000000946
27. Andrade A, Rosenkranz SL, Cillo AR, Lu D, Daar ES, Jacobson JM, Lederman M, Acosta EP, Campbell T, Feinberg J, Flexner C, Mellors JW, Kuritzkes DR, Team ACTGA. Three distinct phases of HIV-1 RNA decay in treatment-naive patients receiving raltegravir-based antiretroviral therapy: ACTG A5248. J Infect Dis. 2013;208(6):884-91. PubMed PMID: 23801609. Pubmed Central PMCID: 3749011. doi: 10.1093/infdis/jit272
28. Funderburg NT, Andrade A, Chan ES, Rosenkranz SL, Lu D, Clagett B, Pilch-Cooper HA, Rodriguez B, Feinberg J, Daar E, Mellors J, Kuritzkes D, Jacobson JM, Lederman MM. Dynamics of immune reconstitution and activation markers in HIV+ treatment-naive patients treated with raltegravir, tenofovir disoproxil fumarate and emtricitabine. PLoS One. 2013;8(12):e83514. PubMed PMID: 24367599. Pubmed Central PMCID: 3867440. doi: 10.1371/journal.pone.0083514
29. Funderburg NT, Xu D, Playford MP, Joshi AA, Andrade A, Kuritzkes DR, Lederman MM, Mehta NN. Treatment of HIV infection with a raltegravir-based regimen increases LDL levels, but improves HDL cholesterol efflux capacity. Antivir Ther. 2016. PubMed PMID: 27740536. doi: 10.3851/IMP3091
30. McCausland MR, Juchnowski SM, Zidar DA, Kuritzkes DR, Andrade A, Sieg SF, Lederman MM, Funderburg NT. Altered Monocyte Phenotype in HIV-1 Infection Tends to Normalize with Integrase-Inhibitor-Based Antiretroviral Therapy. PLoS One. 2015;10(10):e0139474. PubMed PMID: 26430882. Pubmed Central PMCID: PMC4591977. doi: 10.1371/journal.pone.0139474
31. Shalaurova I, Connelly MA, Garvey WT, Otvos JD. Lipoprotein insulin resistance index: a lipoprotein particle-derived measure of insulin resistance. Metab Syndr Relat Disord. 2014;12(8):422-9. PubMed PMID: 24959989. Pubmed Central PMCID: PMC4175429. doi: 10.1089/met.2014.0050
32. Dugani SB, Akinkuolie AO, Paynter N, Glynn RJ, Ridker PM, Mora S. Association of Lipoproteins, Insulin Resistance, and Rosuvastatin With Incident Type 2 Diabetes Mellitus : Secondary Analysis of a Randomized Clinical Trial. JAMA Cardiol. 2016;1(2):136-45. PubMed PMID: 27347563. Pubmed Central PMCID: PMC4918085. doi: 10.1001/jamacardio.2016.0096
33. Bach G, Perrin-Cocon L, Gerossier E, Guironnet-Paquet A, Lotteau V, Inchauspe G, Fournillier A. Single lysophosphatidylcholine components exhibit adjuvant activities in vitro and in vivo. Clin Vaccine Immunol. 2010;17(3):429-38. PubMed PMID: 20071492. Pubmed Central PMCID: PMC2837973. doi: 10.1128/CVI.00420-09
34. Takahashi M, Okazaki H, Ogata Y, Takeuchi K, Ikeda U, Shimada K. Lysophosphatidylcholine induces apoptosis in human endothelial cells through a p38-mitogen-activated protein kinase-dependent mechanism. Atherosclerosis. 2002;161(2):387-94. PubMed PMID: 11888522
35. Suganami T, Nishida J, Ogawa Y. A paracrine loop between adipocytes and macrophages aggravates inflammatory changes: role of free fatty acids and tumor necrosis factor alpha. Arterioscler Thromb Vasc Biol. 2005;25(10):2062-8. PubMed PMID: 16123319. doi: 10.1161/01.ATV.0000183883.72263.13
36. Lederman MM, Funderburg NT, Sekaly RP, Klatt NR, Hunt PW. Residual immune dysregulation syndrome in treated HIV infection. Adv Immunol. 2013;119:51-83. PubMed PMID: 23886064. doi: 10.1016/B978-0-12-407707-2.00002-3
37. Meikle PJ, Wong G, Tsorotes D, Barlow CK, Weir JM, Christopher MJ, MacIntosh GL, Goudey B, Stern L, Kowalczyk A, Haviv I, White AJ, Dart AM, Duffy SJ, Jennings GL, Kingwell BA. Plasma lipidomic analysis of stable and unstable coronary artery disease. Arterioscler Thromb Vasc Biol. 2011;31(11):2723-32. PubMed PMID: 21903946. doi: 10.1161/ATVBAHA.111.234096
38. Aiyar N, Disa J, Ao Z, Ju H, Nerurkar S, Willette RN, Macphee CH, Johns DG, Douglas SA. Lysophosphatidylcholine induces inflammatory activation of human coronary artery smooth muscle cells. Mol Cell Biochem. 2007;295(1-2):113-20. PubMed PMID: 16896535. doi: 10.1007/s11010-006-9280-x
39. Hunt PW, Sinclair E, Rodriguez B, Shive C, Clagett B, Funderburg N, Robinson J, Huang Y, Epling L, Martin JN, Deeks SG, Meinert CL, Van Natta ML, Jabs DA, Lederman MM. Gut epithelial barrier dysfunction and innate immune activation predict mortality in treated HIV infection. J Infect Dis. 2014;210(8):1228-38. PubMed PMID: 24755434. Pubmed Central PMCID: 4192038. doi: 10.1093/infdis/jiu238
40. Kalayjian RC, Machekano RN, Rizk N, Robbins GK, Gandhi RT, Rodriguez BA, Pollard RB, Lederman MM, Landay A. Pretreatment levels of soluble cellular receptors and interleukin-6 are associated with HIV disease progression in subjects treated with highly active antiretroviral therapy. J Infect Dis. 2010;201(12):1796-805. PubMed PMID: 20446847. Pubmed Central PMCID: 2873127. doi: 10.1086/652750
41. Kuller LH, Tracy R, Belloso W, De Wit S, Drummond F, Lane HC, Ledergerber B, Lundgren J, Neuhaus J, Nixon D, Paton NI, Neaton JD. Inflammatory and coagulation biomarkers and mortality in patients with HIV infection. PLoS Med. 2008;5(10):e203. PubMed PMID: 18942885.
42. Sandler NG, Wand H, Roque A, Law M, Nason MC, Nixon DE, Pedersen C, Ruxrungtham K, Lewin SR, Emery S, Neaton JD, Brenchley JM, Deeks SG, Sereti I, Douek DC. Plasma levels of soluble CD14 independently predict mortality in HIV infection. J Infect Dis. 2011;203(6):780-90. PubMed PMID: 21252259. Pubmed Central PMCID: 3071127. doi: 10.1093/infdis/jiq118
43. Ross AC, Rizk N, O'Riordan MA, Dogra V, El-Bejjani D, Storer N, Harrill D, Tungsiripat M, Adell J, McComsey GA. Relationship between inflammatory markers, endothelial activation markers, and carotid intima-media thickness in HIV-infected patients receiving antiretroviral therapy. Clin Infect Dis. 2009;49(7):1119-27. PubMed PMID: 19712036.
44. Kulkarni MB, E; Gabriel, J; Amburgy, T; Mayne, E; Zidar D; Maierhofer, C; Norris Turner, A; Bazan, J; Koletar, S; Lederman, M; Sieg, S; Funderburg,N. Altered Monocyte and Endothelial Cell Adhesion Molecule Expression is linked to Vascular Inflammation in HIV-infection Open Forum Infectious Diseases. 2016. doi: 10.1093/ofid/ofw224
45. Maisa A, Hearps AC, Angelovich TA, Pereira CF, Zhou J, Shi MD, Palmer CS, Muller WA, Crowe SM, Jaworowski A. Monocytes from HIV-infected individuals show impaired cholesterol efflux and increased foam cell formation after transendothelial migration. Aids. 2015;29(12):1445-57. PubMed PMID: 26244384. doi: 10.1097/QAD.0000000000000739
46. Westhorpe CL, Dufour EM, Maisa A, Jaworowski A, Crowe SM, Muller WA. Endothelial cell activation promotes foam cell formation by monocytes following transendothelial migration in an in vitro model. Exp Mol Pathol. 2012;93(2):220-6. PubMed PMID: 22609311. Pubmed Central PMCID: 3408785. S0014-4800(12)00078-0 [pii]. doi: 10.1016/j.yexmp.2012.03.014
47. Burdo TH, Lo J, Abbara S, Wei J, DeLelys ME, Preffer F, Rosenberg ES, Williams KC, Grinspoon S. Soluble CD163, a novel marker of activated macrophages, is elevated and associated with noncalcified coronary plaque in HIV-infected patients. J Infect Dis. 2011;204(8):1227-36. PubMed PMID: 21917896. Pubmed Central PMCID: 3203384. doi: 10.1093/infdis/jir520
48. Willig AL, Overton ET. Metabolic Consequences of HIV: Pathogenic Insights. Curr HIV/AIDS Rep. 2014. PubMed PMID: 24390642. doi: 10.1007/s11904-013-0191-7
|
Type |
Lipid Number |
Common Name |
HIV- (n = 13 |
HIV+ Baseline (n = 35) |
HIV+ Week 48 (n = 35) |
P values |
|||||
|
Concentration ( μ M) |
StD |
Concentration ( μ M) |
StD |
Concentration ( μ M) |
StD |
HIV- v HIV+ Baseline |
HIV- v HIV+ Week 48 |
HIV + Baseline v Week 48 |
|||
|
SaFA |
Total[FA12:0] |
Lauric Acid |
16.12 |
7.46 |
33.96 |
33.54 |
39.77 |
55.93 |
0.0051 |
0.019 |
0.58 |
|
SaFA |
Total[FA14:0] |
Myristic Acid |
170.22 |
84.34 |
198.50 |
123.33 |
215.48 |
175.26 |
0.37 |
0.24 |
0.46 |
|
SaFA |
Total[FA15:0] |
Pentadecylic Acid |
36.04 |
14.00 |
41.64 |
23.95 |
41.30 |
29.86 |
0.32 |
0.33 |
0.86 |
|
SaFA |
Total[FA16:0] |
Palmitic Acid |
2663.13 |
573.89 |
2654.08 |
924.25 |
2795.67 |
1153.88 |
0.97 |
0.60 |
0.31 |
|
SaFA |
Total[FA17:0] |
Margaric Acid |
46.64 |
13.53 |
55.65 |
28.39 |
54.31 |
29.26 |
0.15 |
0.22 |
0.73 |
|
SaFA |
Total[FA18:0] |
Stearic Acid |
722.38 |
163.34 |
714.94 |
218.48 |
711.97 |
241.36 |
0.90 |
0.87 |
0.93 |
|
SaFA |
Total[FA20:0] |
Arachidic Acid |
65.11 |
92.69 |
34.50 |
11.57 |
36.40 |
12.10 |
0.26 |
0.29 |
0.24 |
|
SaFA |
Total[FA22:0] |
Behenic Acid |
52.26 |
15.15 |
39.25 |
11.37 |
44.15 |
10.38 |
0.012 |
0.093 |
0.0074 |
|
SaFA |
Total[FA24:0] |
Lignoceric Acid |
42.78 |
14.65 |
30.75 |
8.51 |
33.58 |
7.39 |
0.014 |
0.048 |
0.024 |
|
SaFA |
Total[FA26:0] |
Cerotic Acid |
0.53 |
0.14 |
0.47 |
1.36 |
0.46 |
0.12 |
0.15 |
0.092 |
0.70 |
|
MUFA |
Total[FA14:1] |
Myristoleic Acid |
11.75 |
5.62 |
15.48 |
11.81 |
15.87 |
13.73 |
0.15 |
0.15 |
0.85 |
|
MUFA |
Total[FA16:1] |
Palmitoleic Acid |
283.65 |
102.04 |
313.76 |
197.72 |
320.79 |
205.12 |
0.50 |
0.41 |
0.81 |
|
MUFA |
Total[FA18:1] |
Oleic Acid |
2357.10 |
502.91 |
2702.77 |
1136.79 |
2579.16 |
1121.12 |
0.15 |
0.35 |
0.39 |
|
MUFA |
Total[FA20:1] |
Gondoic Acid |
26.10 |
10.59 |
25.30 |
12.57 |
22.96 |
7.73 |
0.83 |
0.34 |
0.096 |
|
MUFA |
Total[FA22:1] |
Erucic Acid |
35.47 |
6.29 |
25.90 |
6.70 |
28.84 |
6.79 |
0.00013 |
0.0042 |
0.0029 |
|
MUFA |
Total[FA24:1] |
Nervonic Acid |
75.46 |
12.42 |
61.58 |
17.97 |
64.74 |
15.70 |
0.0050 |
0.020 |
0.14 |
|
MUFA |
Total[FA26:1] |
Hexacosanoic Acid |
0.95 |
0.21 |
0.75 |
0.22 |
0.78 |
0.22 |
0.0089 |
0.025 |
0.36 |
|
PUFA |
Total[FA18:2] |
Linoleic Acid |
3763.40 |
871.88 |
3341.16 |
909.24 |
3390.61 |
834.08 |
0.15 |
0.20 |
0.67 |
|
PUFA |
Total[FA18:3] |
α-Linolenic Acid |
163.59 |
38.41 |
169.58 |
2.99 |
174.45 |
94.37 |
0.75 |
0.57 |
0.74 |
|
PUFA |
Total[FA18:4] |
Stearidonic Acid |
2.38 |
1.21 |
1.74 |
1.14 |
2.01 |
0.96 |
0.11 |
0.34 |
0.28 |
|
PUFA |
Total[FA20:2] |
Eicosadienoic Acid |
20.73 |
4.25 |
24.78 |
10.61 |
23.61 |
8.70 |
0.065 |
0.13 |
0.38 |
|
PUFA |
Total[FA20:3] |
Dihomo-γ-linolenic Acid |
138.54 |
33.48 |
142.23 |
55.31 |
148.12 |
60.14 |
0.78 |
0.49 |
0.52 |
|
PUFA |
Total[FA20:4] |
Arachidonic Acid |
695.40 |
144.85 |
548.13 |
194.01 |
615.45 |
239.93 |
0.0082 |
0.17 |
0.015 |
|
PUFA |
Total[FA20:5] |
Eicosapentanoic Acid |
60.60 |
16.62 |
44.03 |
28.05 |
61.12 |
35.16 |
0.017 |
0.95 |
0.0056 |
|
PUFA |
Total[FA22:2] |
Docosadienoic Acid |
2.64 |
5.33 |
1.18 |
0.60 |
1.20 |
0.31 |
0.34 |
0.35 |
0.82 |
|
PUFA |
Total[FA22:4] |
Docosatetraenoic Acid |
18.54 |
6.13 |
20.16 |
7.59 |
20.43 |
9.92 |
0.45 |
0.43 |
0.82 |
|
PUFA |
Total[FA22:5] |
Docosapentaenoic Acid |
51.67 |
11.14 |
51.35 |
17.08 |
57.81 |
22.01 |
0.94 |
0.21 |
0.031 |
|
PUFA |
Total[FA22:6] |
Docosahexaenoic Acid |
144.96 |
52.61 |
115.92 |
56.99 |
141.66 |
72.49 |
0.11 |
0.86 |
0.0045 |
Supplementary Table 1B
|
Type |
Lipid Number |
Common Name |
HIV- (n = 13) |
HIV+ Baseline (n = 35) |
HIV+ Week 48 (n = 35) |
P values |
|||||
|
Concentration ( μ M) |
StD |
Concentration ( μ M) |
StD |
Concentration ( μ M |
StD |
HIV- v HIV+ Baseline |
HIV- v HIV+ Week 48 |
HIV + Baseline v Week 48 |
|||
|
SaFA |
FFA[FA12:0] |
Lauric Acid |
2.24 |
0.44 |
2.13 |
0.87 |
2.49 |
0.99 |
0.59 |
0.23 |
0.14 |
|
SaFA |
FFA[FA14:0] |
Myristic Acid |
8.39 |
2.49 |
6.79 |
3.49 |
7.96 |
2.42 |
0.088 |
0.60 |
0.13 |
|
SaFA |
FFA[FA15:0] |
Pentadecylic Acid |
3.18 |
0.57 |
3.01 |
0.81 |
3.20 |
0.54 |
0.40 |
0.91 |
0.15 |
|
SaFA |
FFA[FA16:0] |
Palmitic Acid |
97.48 |
26.35 |
76.75 |
30.87 |
91.26 |
27.01 |
0.030 |
0.48 |
0.035 |
|
SaFA |
FFA[FA17:0] |
Margaric Acid |
4.70 |
1.00 |
4.49 |
1.02 |
4.86 |
0.97 |
0.52 |
0.62 |
0.095 |
|
SaFA |
FFA[FA18:0] |
Stearic Acid |
35.98 |
10.62 |
32.15 |
11.39 |
36.75 |
10.25 |
0.29 |
0.82 |
0.083 |
|
SaFA |
FFA[FA20:0] |
Arachidic Acid |
1.19 |
0.21 |
1.44 |
0.31 |
1.54 |
0.30 |
0.0032 |
1.07E-04 |
0.095 |
|
SaFA |
FFA[FA22:0] |
Behenic Acid |
1.23 |
0.33 |
1.43 |
0.63 |
1.66 |
1.12 |
0.15 |
0.045 |
0.32 |
|
SaFA |
FFA[FA24:0] |
Lignoceric Acid |
0.52 |
0.12 |
0.58 |
0.13 |
0.57 |
0.16 |
0.20 |
0.33 |
0.74 |
|
MUFA |
FFA[FA14:1] |
Myristoleic Acid |
1.65 |
0.51 |
1.34 |
0.68 |
1.48 |
0.35 |
0.094 |
0.27 |
0.31 |
|
MUFA |
FFA[FA16:1] |
Palmitoleic Acid |
14.13 |
5.67 |
9.62 |
6.47 |
10.85 |
3.95 |
0.027 |
0.072 |
0.34 |
|
MUFA |
FFA[FA18:1] |
Oleic Acid |
127.95 |
50.51 |
87.53 |
50.64 |
105.19 |
41.91 |
0.022 |
0.16 |
0.11 |
|
MUFA |
FFA[FA20:1] |
Gondoic Acid |
1.41 |
0.49 |
1.17 |
0.47 |
1.31 |
0.39 |
0.14 |
0.51 |
0.19 |
|
MUFA |
FFA[FA22:1] |
Erucic Acid |
1.25 |
0.46 |
1.31 |
0.63 |
1.52 |
0.56 |
0.73 |
0.10 |
0.17 |
|
MUFA |
FFA[FA24:1] |
Nervonic Acid |
0.75 |
0.15 |
0.89 |
0.37 |
0.90 |
0.23 |
0.072 |
0.011 |
0.85 |
|
PUFA |
FFA[FA18:2] |
Linoleic Acid |
72.14 |
28.99 |
51.24 |
28.46 |
61.17 |
25.13 |
0.037 |
0.24 |
0.092 |
|
PUFA |
FFA[FA18:3] |
α-Linolenic Acid |
7.03 |
2.85 |
4.80 |
3.18 |
5.81 |
2.30 |
0.029 |
0.18 |
0.094 |
|
PUFA |
FFA[FA18:4] |
Stearidonic Acid |
0.31 |
0.06 |
0.28 |
0.06 |
0.30 |
0.04 |
0.100 |
0.61 |
0.022 |
|
PUFA |
FFA[FA20:2] |
Eicosadienoic Acid |
1.02 |
0.31 |
0.80 |
0.31 |
0.91 |
0.25 |
0.039 |
0.24 |
0.097 |
|
PUFA |
FFA[FA20:3] |
Dihomo-γ-linolenic Acid |
1.59 |
0.42 |
1.62 |
0.89 |
1.61 |
0.35 |
0.85 |
0.89 |
0.89 |
|
PUFA |
FFA[FA20:4] |
Arachidonic Acid |
4.84 |
1.41 |
4.66 |
1.43 |
5.07 |
1.59 |
0.70 |
0.64 |
0.14 |
|
PUFA |
FFA[FA20:5] |
Eicosapentanoic Acid |
0.94 |
0.18 |
0.92 |
0.19 |
1.06 |
0.24 |
0.83 |
0.056 |
0.0010 |
|
PUFA |
FFA[FA22:2] |
Docosadienoic Acid |
0.38 |
0.10 |
0.39 |
0.16 |
0.41 |
0.09 |
0.86 |
0.51 |
0.65 |
|
PUFA |
FFA[FA22:4] |
Docosatetraenoic Acid |
0.80 |
0.25 |
0.63 |
0.15 |
0.70 |
0.17 |
0.042 |
0.23 |
0.040 |
|
PUFA |
FFA[FA22:5] |
Docosapentaenoic Acid |
1.51 |
0.44 |
1.24 |
0.36 |
1.40 |
0.35 |
0.060 |
0.41 |
0.0132 |
|
PUFA |
FFA[FA22:6] |
Docosahexaenoic Acid |
2.21 |
0.80 |
1.56 |
0.74 |
1.97 |
1.00 |
0.020 |
0.40 |
7.17E-04 |
Supplemental Table 1. The concentration of total and free fatty acids is altered in HIV infection at baseline and week 48 compared to levels in HIV-uninfected donors. Plasma samples were thawed and the concentration (µM) of A) total and B) free (non-esterified) fatty acids were measured by the Complex Lipid Panel (Metabolon). Several changes in the concentrations of SaFAs, MUFAs, and PUFAs were measured among samples from HIV-uninfected participants, and in samples from HIV-infected individuals pre-ART initiation (baseline) and following 48 weeks of ART. Mean levels and standard deviations are reported. Statistically significant differences among the participant groups are designated in bold text; an exploratory value of P < 0.05 is used for a cutoff of significance.
|
Type |
Lipid Number |
Common Name |
HIV- (n = 13) |
HIV+ Baseline (n = 35) |
HIV+ Week 48 (n = 35) |
P values |
|||||
|
Composition (mol%) |
StD |
Composition (mol%)) |
StD |
Composition (mol%) |
StD |
HIV- v HIV+ Baseline |
HIV- v HIV+ Week 48 |
HIV + Baseline v Week 48 |
|||
|
SaFA |
Total[FA12:0]] |
Lauric Acid |
0.14 |
0.049 |
0.29 |
0.22 |
0.30 |
0.22 |
0.00042 |
0.0037 |
0.93 |
|
SaFA |
Total[FA14:0] |
Myristic Acid |
1.43 |
0.57 |
1.66 |
0.64 |
1.68 |
0.64 |
0.25 |
0.24 |
0.87 |
|
SaFA |
Total[FA15:0] |
Pentadecylic Acid |
0.31 |
0.11 |
0.36 |
0.13 |
0.34 |
0.13 |
0.22 |
0.35 |
0.56 |
|
SaFA |
Total[FA16:0] |
Palmitic Acid |
22.78 |
1.75 |
23.18 |
1.50 |
23.75 |
1.50 |
0.47 |
0.12 |
0.0410 |
|
SaFA |
Total[FA17:0] |
Margaric Acid |
0.40 |
0.10 |
0.48 |
0.12 |
0.45 |
0.12 |
0.035 |
0.12 |
0.18 |
|
SaFA |
Total[FA18:0] |
Stearic Acid |
6.18 |
0.81 |
6.33 |
0.69 |
6.15 |
0.69 |
0.57 |
0.88 |
0.067 |
|
SaFA |
Total[FA20:0] |
Arachidic Acid |
0.56 |
0.77 |
0.31 |
0.050 |
0.32 |
0.050 |
0.26 |
0.28 |
0.27 |
|
SaFA |
Total[FA22:0] |
Behenic Acid |
0.45 |
0.11 |
0.36 |
0.092 |
0.40 |
0.092 |
0.014 |
0.13 |
0.012 |
|
SaFA |
Total[FA24:0] |
Lignoceric Acid |
0.37 |
0.11 |
0.28 |
0.070 |
0.31 |
0.070 |
0.018 |
0.071 |
0.040 |
|
SaFA |
Total[FA26:0] |
Cerotic Acid |
0.0050 |
0.0010 |
0.0040 |
0.0010 |
0.0040 |
0.0010 |
0.37 |
0.23 |
0.64 |
|
MUFA |
Total[FA14:1] |
Myristoleic Acid |
0.10 |
0.034 |
0.13 |
0.055 |
0.12 |
0.06 |
0.045 |
0.065 |
0.87 |
|
MUFA |
Total[FA16:1] |
Palmitoleic Acid |
2.41 |
0.69 |
2.60 |
0.89 |
2.62 |
0.89 |
0.44 |
0.37 |
0.88 |
|
MUFA |
Total[FA18:1] |
Oleic Acid |
20.17 |
1.59 |
23.15 |
2.83 |
21.72 |
2.83 |
4.77E-05 |
0.015 |
0.0093 |
|
MUFA |
Total[FA20:1] |
Gondoic Acid |
0.23 |
0.086 |
0.22 |
0.045 |
0.20 |
0.045 |
0.75 |
0.29 |
0.013 |
|
MUFA |
Total[FA22:1] |
Erucic Acid |
0.31 |
0.054 |
0.24 |
0.061 |
0.26 |
0.061 |
7.18E-04 |
0.011 |
0.015 |
|
MUFA |
Total[FA22:1] |
Nervonic Acid |
0.66 |
0.11 |
0.57 |
0.16 |
0.59 |
0.16 |
0.031 |
0.11 |
0.30 |
|
MUFA |
Total[FA26:1] |
Hexacosanoic Acid |
0.0080 |
0.0030 |
0.0070 |
0.0020 |
0.0070 |
0.0020 |
0.096 |
0.15 |
0.53 |
|
PUFA |
Total[FA18:2] |
Linoleic Acid |
32.21 |
3.97 |
29.93 |
3.82 |
30.08 |
4.42 |
0.090 |
0.12 |
0.83 |
|
PUFA |
Total[FA18:3] |
α-Linolenic Acid |
1.41 |
0.28 |
1.43 |
0.39 |
1.44 |
0.36 |
0.85 |
0.76 |
0.87 |
|
PUFA |
Total[FA18:4] |
Stearidonic Acid |
0.021 |
0.0090 |
0.015 |
0.0060 |
0.017 |
0.0060 |
0.075 |
0.29 |
0.16 |
|
PUFA |
Total[FA20:2] |
Eicosadienoic Acid |
0.18 |
0.031 |
0.21 |
0.047 |
0.21 |
0.037 |
0.0055 |
0.025 |
0.16 |
|
PUFA |
Total[FA20:3] |
Dihomo-γ-linolenic Acid |
1.19 |
0.22 |
1.26 |
0.30 |
1.28 |
0.32 |
0.43 |
0.30 |
0.69 |
|
PUFA |
Total[FA20:4] |
Arachidonic Acid |
6.07 |
1.35 |
4.93 |
1.30 |
5.34 |
1.47 |
0.016 |
0.12 |
0.041 |
|
PUFA |
Total[FA20:5] |
Eicosapentanoic Acid |
0.54 |
0.17 |
0.39 |
0.22 |
0.52 |
0.24 |
0.017 |
0.72 |
0.0035 |
|
PUFA |
Total[FA22:2] |
Docosadienoic Acid |
0.02 |
0.04 |
0.01 |
0.0040 |
0.011 |
0.0030 |
0.35 |
0.36 |
0.76 |
|
PUFA |
Total[FA22:4] |
Docosatetraenoic Acid |
0.16 |
0.047 |
0.18 |
0.042 |
0.18 |
0.059 |
0.24 |
0.36 |
0.73 |
|
PUFA |
Total[FA22:5] |
Docosapentaenoic Acid |
0.45 |
0.12 |
0.46 |
0.085 |
0.50 |
0.093 |
0.94 |
0.27 |
0.027 |
|
PUFA |
Total[FA22:6] |
Docosahexaenoic Acid |
1.26 |
0.47 |
1.05 |
0.50 |
1.24 |
0.56 |
0.18 |
0.87 |
0.0016 |
Supplementary Table 2B
|
Type |
Lipid Number |
Common Name |
HIV- (n = 13) |
HIV+ Baseline (n = 35) |
HIV+ Week 48 (n = 35) |
P values |
|||||
|
Composition (mol%) |
StD |
Composition (mol%) |
StD |
Composition (mol%) |
StD |
HIV- v HIV+ Baseline |
HIV- v HIV+ Week 48 |
HIV + Baseline v Week 48 |
|||
|
SaFA |
FFA[FA12:0] |
Lauric Acid |
0.61 |
0.16 |
0.78 |
0.30 |
0.75 |
0.29 |
0.017 |
0.042 |
0.69 |
|
SaFA |
FFA[FA14:0] |
Myristic Acid |
2.19 |
0.35 |
2.32 |
0.41 |
2.35 |
0.55 |
0.29 |
0.26 |
0.77 |
|
SaFA |
FFA[FA15:0] |
Pentadecylic Acid |
0.87 |
0.23 |
1.12 |
0.44 |
0.97 |
0.23 |
0.014 |
0.21 |
0.042 |
|
SaFA |
FFA[FA16:0] |
Palmitic Acid |
25.28 |
2.26 |
26.20 |
1.80 |
26.17 |
2.20 |
0.21 |
0.24 |
0.95 |
|
SaFA |
FFA[FA17:0] |
Margaric Acid |
1.27 |
0.32 |
1.64 |
0.39 |
1.45 |
0.31 |
0.0025 |
0.092 |
0.016 |
|
SaFA |
FFA[FA18:0] |
Stearic Acid |
9.28 |
1.04 |
11.17 |
1.46 |
10.64 |
1.37 |
2.25E-05 |
9.50E-04 |
0.061 |
|
SaFA |
FFA[FA20:0] |
Arachidic Acid |
0.32 |
0.08 |
0.54 |
0.17 |
0.46 |
0.11 |
5.71E-07 |
5.27E-05 |
0.012 |
|
SaFA |
FFA[FA22:0] |
Behenic Acid |
0.32 |
0.06 |
0.52 |
0.25 |
0.51 |
0.39 |
6.88E-05 |
0.0096 |
0.81 |
|
SaFA |
FFA[FA24:0] |
Lignoceric Acid |
0.14 |
0.04 |
0.22 |
0.09 |
0.18 |
0.07 |
4.27E-05 |
0.046 |
0.013 |
|
MUFA |
FFA[FA14:1] |
Myristoleic Acid |
0.43 |
0.09 |
0.46 |
0.11 |
0.44 |
0.13 |
0.30 |
0.73 |
0.36 |
|
MUFA |
FFA[FA16:1] |
Palmitoleic Acid |
3.59 |
0.79 |
3.10 |
0.60 |
3.07 |
0.52 |
0.061 |
0.045 |
0.82 |
|
MUFA |
FFA[FA18:1] |
Oleic Acid |
31.62 |
3.11 |
28.15 |
3.30 |
29.20 |
3.12 |
0.0026 |
0.026 |
0.15 |
|
MUFA |
FFA[FA20:1] |
Gondoic Acid |
0.36 |
0.04 |
0.41 |
0.06 |
0.38 |
0.05 |
0.0025 |
0.15 |
0.011 |
|
MUFA |
FFA[FA22:1] |
Erucic Acid |
0.32 |
0.07 |
0.45 |
0.15 |
0.43 |
0.09 |
2.35E-04 |
8.23E-05 |
0.52 |
|
MUFA |
FFA[FA24:1] |
Nervonic Acid |
0.20 |
0.04 |
0.33 |
0.19 |
0.27 |
0.05 |
2.88E-04 |
6.27E-05 |
0.034 |
|
PUFA |
FFA[FA18:2] |
Linoleic Acid |
17.89 |
2.02 |
16.63 |
2.37 |
17.11 |
2.41 |
0.079 |
0.27 |
0.27 |
|
PUFA |
FFA[FA18:3] |
α-Linolenic Acid |
1.75 |
0.21 |
1.55 |
0.38 |
1.64 |
0.33 |
0.029 |
0.21 |
0.15 |
|
PUFA |
FFA[FA18:4] |
Stearidonic Acid |
0.08 |
0.02 |
0.10 |
0.03 |
0.09 |
0.03 |
0.024 |
0.31 |
0.072 |
|
PUFA |
FFA[FA20:2] |
Eicosadienoic Acid |
0.26 |
0.02 |
0.28 |
0.04 |
0.26 |
0.04 |
0.097 |
0.93 |
0.068 |
|
PUFA |
FFA[FA20:3] |
Dihomo-γ-linolenic Acid |
0.42 |
0.07 |
0.62 |
0.45 |
0.48 |
0.12 |
0.015 |
0.028 |
0.049 |
|
PUFA |
FFA[FA20:4] |
Arachidonic Acid |
1.26 |
0.22 |
1.70 |
0.54 |
1.51 |
0.54 |
2.29E-04 |
0.028 |
0.085 |
|
PUFA |
FFA[FA20:5] |
Eicosapentanoic Acid |
0.25 |
0.06 |
0.35 |
0.13 |
0.33 |
0.10 |
0.0012 |
0.0060 |
0.36 |
|
PUFA |
FFA[FA22:2] |
Docosadienoic Acid |
0.10 |
0.02 |
0.14 |
0.03 |
0.12 |
0.02 |
4.12E-05 |
0.012 |
0.0020 |
|
PUFA |
FFA[FA22:4] |
Docosatetraenoic Acid |
0.21 |
0.04 |
0.23 |
0.06 |
0.21 |
0.04 |
0.137 |
0.98 |
0.030 |
|
PUFA |
FFA[FA22:5] |
Docosapentaenoic Acid |
0.40 |
0.08 |
0.45 |
0.14 |
0.42 |
0.10 |
0.095 |
0.51 |
0.11 |
|
PUFA |
FFA[FA22:6] |
Docosahexaenoic Acid |
0.58 |
0.17 |
0.54 |
0.16 |
0.58 |
0.22 |
0.53 |
0.98 |
0.21 |
Supplemental Table 2. The fatty acid composition of total fatty acids and free fatty acids is altered in HIV infection at baseline and week 48 compared to levels in HIV-uninfected donors. Plasma samples were thawed and the proportional representation (mol%) of A) total and B) free fatty acids were measured by the Complex Lipid Panel (Metabolon). Several changes in the proportional representation of SaFAs, MUFAs, and PUFAs were measured among samples from HIV- participants, and in samples from HIV+participants pre-ART initiation (baseline) and following 48 weeks of ART. Mean levels and standard deviations are reported. Statistically significant differences among the participant groups are designated in bold text; an exploratory value of P < 0.05 is used for a cutoff of significance.
Supplementary Table 3A
|
Type |
Lipid Number |
Common Name |
HIV- (n = 13) |
HIV+ Baseline (n = 35) |
HIV+ Week 48 (n = 35) |
p values |
|||||
|
Concentration ( μ M) |
StD |
Concentration ( μ M) |
StD |
Concentration ( μ M) |
StD |
HIV- v HIV+ Baseline |
HIV- v HIV+ Week 48 |
HIV + Baseline v Week 48 |
|||
|
SaFA |
LPC[FA12:0] |
Lauric Acid |
0.010 |
0.012 |
0.0040 |
0.0020 |
0.0090 |
0.0040 |
0.39 |
0.87 |
0.089 |
|
SaFA |
LPC[FA14:0] |
Myristic Acid |
0.12 |
0.060 |
0.15 |
0.11 |
0.19 |
0.089 |
0.18 |
0.0040 |
0.033 |
|
SaFA |
LPC[FA15:0] |
Pentadecylic Acid |
0.49 |
0.17 |
0.65 |
0.33 |
0.70 |
0.31 |
0.035 |
0.0050 |
0.31 |
|
SaFA |
LPC[FA16:0] |
Palmitic Acid |
87.90 |
25.46 |
111.83 |
40.27 |
120.95 |
36.46 |
0.020 |
0.0013 |
0.092 |
|
SaFA |
LPC[FA17:0] |
Margaric Acid |
1.36 |
0.36 |
1.96 |
0.75 |
2.053 |
0.66 |
5.20E-04 |
3.46E-05 |
0.40 |
|
SaFA |
LPC[FA18:0] |
Stearic Acid |
18.70 |
5.31 |
27.94 |
10.88 |
27.55 |
8.78 |
3.18E-04 |
1.53E-04 |
0.79 |
|
SaFA |
LPC[FA20:0] |
Arachidic Acid |
0.056 |
0.016 |
0.070 |
0.026 |
0.061 |
0.022 |
0.034 |
0.36 |
0.086 |
|
SaFA |
LPC[FA22:0] |
Behenic Acid |
0.0070 |
0.0040 |
0.0060 |
0.0030 |
0.0080 |
0.0040 |
0.45 |
0.92 |
0.17 |
|
SaFA |
LPC[FA24:0] |
Lignoceric Acid |
0.0080 |
0.0030 |
0.0050 |
0.0020 |
0.0060 |
0.0050 |
0.057 |
0.40 |
0.20 |
|
MUFA |
LPC[FA14:1] |
Myristoleic Acid |
0.0070 |
0.0060 |
0.0090 |
0.0050 |
0.0060 |
0.0030 |
0.54 |
0.70 |
0.14 |
|
MUFA |
LPC[FA16:1] |
Palmitoleic Acid |
2.24 |
1.18 |
2.50 |
1.051 |
2.73 |
0.97 |
0.49 |
0.19 |
0.13 |
|
MUFA |
LPC[FA18:1] |
Oleic Acid |
21.81 |
10.41 |
21.98 |
7.54 |
22.66 |
6.60 |
0.96 |
0.79 |
0.54 |
|
MUFA |
LPC[FA20:1] |
Gondoic Acid |
0.14 |
0.043 |
0.19 |
0.077 |
0.19 |
0.070 |
0.0065 |
0.0062 |
0.87 |
|
MUFA |
LPC[FA22:1] |
Erucic Acid |
0.010 |
0.007 |
0.0080 |
0.0060 |
0.0070 |
0.0050 |
0.62 |
0.50 |
0.75 |
|
MUFA |
LPC[FA24:1] |
Nervonic Acid |
0.012 |
0.011 |
0.0070 |
0.0050 |
0.0050 |
0.0020 |
0.39 |
0.25 |
0.91 |
|
PUFA |
LPC[FA18:2] |
Linoleic Acid |
37.076 |
16.42 |
27.15 |
10.29 |
28.81 |
9.44 |
0.059 |
0.11 |
0.33 |
|
PUFA |
LPC[FA18:3] |
α-Linolenic Acid |
0.30 |
0.21 |
0.23 |
0.098 |
0.27 |
0.12 |
0.26 |
0.64 |
0.079 |
|
PUFA |
LPC[FA18:4] |
Stearidonic Acid |
0.0060 |
0.0020 |
0.0070 |
0.006 |
0.0070 |
0.0040 |
0.63 |
0.52 |
0.24 |
|
PUFA |
LPC[FA20:2] |
Eicosadienoic Acid |
0.34 |
0.18 |
0.39 |
0.15 |
0.35 |
0.15 |
0.41 |
0.81 |
0.23 |
|
PUFA |
LPC[FA20:3] |
Dihomo-γ-linolenic Acid |
2.29 |
1.32 |
2.53 |
1.28 |
2.41 |
0.87 |
0.58 |
0.76 |
0.58 |
|
PUFA |
LPC[FA20:4] |
Arachidonic Acid |
0.40 |
1.39 |
3.73 |
1.58 |
3.95 |
1.45 |
0.51 |
0.83 |
0.39 |
|
PUFA |
LPC[FA20:5] |
Eicosapentanoic Acid |
0.15 |
0.055 |
0.115 |
0.085 |
0.150 |
0.083 |
0.12 |
0.96 |
0.061 |
|
PUFA |
LPC[FA22:2] |
Docosadienoic Acid |
0.0070 |
0.0050 |
0.0060 |
0.0050 |
0.0080 |
0.0050 |
0.87 |
0.62 |
0.11 |
|
PUFA |
LPC[FA22:4] |
Docosatetraenoic Acid |
0.066 |
0.040 |
0.093 |
0.059 |
0.080 |
0.052 |
0.075 |
0.31 |
0.30 |
|
PUFA |
LPC[FA22:5] |
Docosapentaenoic Acid |
0.192 |
0.085 |
0.215 |
0.113 |
0.225 |
0.095 |
0.45 |
0.26 |
0.64 |
|
PUFA |
LPC[FA22:6] |
Docosahexaenoic Acid |
0.29 |
0.12 |
0.27 |
0.14 |
0.32 |
0.16 |
0.58 |
0.49 |
0.099 |
Supplementary Table 3B
|
Type |
Lipid Number |
Common Name |
HIV- (n< = 13) |
HIV+ Baseline (n = 35) |
HIV+ Week 48 (n = 35) |
P values |
|||||
|
Composition (mol%) |
StD |
Concentration (μM) |
StD |
Composition (mol%) |
StD |
HIV- v HIV+ Baseline |
HIV- v HIV+ Week 48 |
HIV + Baseline v Week 48 |
|||
|
SaFA |
LPC[FA12:0] |
Lauric Acid |
0.008 |
0.009 |
0.002 |
0.001 |
0.005 |
0.003 |
0.3266 |
0.5996 |
0.2919 |
|
SaFA |
LPC[FA14:0] |
Myristic Acid |
0.067 |
0.029 |
0.072 |
0.029 |
0.087 |
0.025 |
0.6399 |
0.0462 |
0.0165 |
|
SaFA |
LPC[FA15:0] |
Pentadecylic Acid |
0.284 |
0.091 |
0.317 |
0.096 |
0.332 |
0.094 |
0.2737 |
0.2116 |
0.7408 |
|
SaFA |
LPC[FA16:0] |
Palmitic Acid |
50.042 |
4.539 |
55.277 |
4.693 |
56.399 |
4.113 |
0.0019 |
0.0003 |
0.0787 |
|
SaFA |
LPC[FA17:0] |
Margaric Acid |
0.778 |
0.135 |
0.965 |
0.172 |
0.954 |
0.150 |
0.0005 |
0.0007 |
0.6723 |
|
SaFA |
LPC[FA18:0] |
Stearic Acid |
10.724 |
1.964 |
13.785 |
1.626 |
12.873 |
1.804 |
0.0001 |
0.0026 |
0.0004 |
|
SaFA |
LPC[FA20:0] |
Arachidic Acid |
0.032 |
0.008 |
0.036 |
0.012 |
0.029 |
0.009 |
0.3177 |
0.2367 |
0.0133 |
|
SaFA |
LPC[FA22:0] |
Behenic Acid |
0.005 |
0.003 |
0.003 |
0.001 |
0.004 |
0.002 |
0.2204 |
0.4191 |
0.1874 |
|
SaFA |
LPC[FA24:0] |
Lignoceric Acid |
0.004 |
0.002 |
0.002 |
0.001 |
0.003 |
0.002 |
0.0592 |
0.1912 |
0.1640 |
|
MUFA |
LPC[FA14:1] |
Myristoleic Acid |
0.004 |
0.004 |
0.004 |
0.002 |
0.003 |
0.002 |
0.9659 |
0.3991 |
0.1167 |
|
MUFA |
LPC[FA16:1] |
Palmitoleic Acid |
1.226 |
0.297 |
1.219 |
0.244 |
1.265 |
0.240 |
0.9439 |
0.6700 |
0.3306 |
|
MUFA |
LPC[FA18:1] |
Oleic Acid |
11.990 |
1.881 |
10.885 |
1.296 |
10.640 |
1.463 |
0.0680 |
0.0313 |
0.2703 |
|
MUFA |
LPC[FA20:1] |
Gondoic Acid |
0.078 |
0.020 |
0.093 |
0.021 |
0.088 |
0.026 |
0.0407 |
0.1989 |
0.3561 |
|
MUFA |
LPC[FA22:1] |
Erucic Acid |
0.006 |
0.005 |
0.004 |
0.004 |
0.003 |
0.002 |
0.5120 |
0.2240 |
0.3894 |
|
MUFA |
LPC[FA24:1] |
Nervonic Acid |
0.007 |
0.006 |
0.004 |
0.002 |
0.003 |
0.001 |
0.3029 |
0.1949 |
0.8425 |
|
PUFA |
LPC[FA18:2] |
Linoleic Acid |
20.426 |
3.979 |
13.587 |
3.791 |
13.703 |
3.936 |
0.00003 |
0.00003 |
0.8332 |
|
PUFA |
LPC[FA18:3] |
g-Linolenic Acid |
0.160 |
0.057 |
0.114 |
0.042 |
0.128 |
0.046 |
0.0169 |
0.0815 |
0.1460 |
|
PUFA |
LPC[FA18:4] |
Stearidonic Acid |
0.003 |
0.001 |
0.004 |
0.003 |
0.004 |
0.002 |
0.8744 |
0.7580 |
0.2968 |
|
PUFA |
LPC[FA20:2] |
Eicosadienoic Acid |
0.183 |
0.058 |
0.193 |
0.042 |
0.165 |
0.048 |
0.6029 |
0.3250 |
0.0159 |
|
PUFA |
LPC[FA20:3] |
Dihomo-γ-linolenic Acid |
1.254 |
0.337 |
1.236 |
0.470 |
1.129 |
0.300 |
0.8836 |
0.2553 |
0.2134 |
|
PUFA |
LPC[FA20:4] |
Arachidonic Acid |
2.334 |
0.639 |
1.864 |
0.629 |
1.841 |
0.480 |
0.0336 |
0.0216 |
0.7866 |
|
PUFA |
LPC[FA20:5] |
Eicosapentanoic Acid |
0.088 |
0.036 |
0.058 |
0.043 |
0.070 |
0.038 |
0.0220 |
0.1580 |
0.1274 |
|
PUFA |
LPC[FA22:2] |
Docosadienoic Acid |
0.004 |
0.003 |
0.003 |
0.003 |
0.004 |
0.004 |
0.6110 |
0.8964 |
0.1057 |
|
PUFA |
LPC[FA22:4] |
Docosatetraenoic Acid |
0.037 |
0.021 |
0.046 |
0.028 |
0.038 |
0.020 |
0.2481 |
0.9451 |
0.1250 |
|
PUFA |
LPC[FA22:5] |
Docosapentaenoic Acid |
0.108 |
0.034 |
0.108 |
0.053 |
0.106 |
0.037 |
0.9786 |
0.8145 |
0.7999 |
|
PUFA |
LPC[FA22:6] |
Docosahexaenoic Acid |
0.171 |
0.077 |
0.137 |
0.067 |
0.155 |
0.083 |
0.1729 |
0.5134 |
0.2314 |
Supplemental Table 3. The fatty acid composition and concentration of lysophosphatidylcholine (LPC) molecules is altered in HIV infection at baseline and week 48 compared to levels in HIV-uninfected donors. Plasma samples were thawed and A) the proportional representation (mol%) and B) concentration (µM) of LPC molecules were measured by the Complex Lipid Panel (Metabolon). Several changes in the proportional representation of SaFAs, MUFAs, and PUFAs were measured among samples from HIV- participants, and in samples from HIV+ participants pre-ART initiation (baseline) and following 48 weeks of ART. Mean levels and standard deviations are reported. Statistically significant differences among the participant groups are designated in bold text; an exploratory value of P < 0.05 is used for a cutoff of significance.