Robin L.P. Jump1,2, David Kraft1, Kelly Hurless1, Alex Polinkovsky1, and Curtis J. Donskey1,2
1
Department of Medicine, Infectious Diseases Division, Case Western Reserve
University School of Medicine, Cleveland, OH
2
Geriatric Research, Education and Clinical Center, Cleveland Veterans
Affairs Medical Center, Cleveland, OH
Curtis J. Donskey
Geriatric Research Education and Clinical Center
Cleveland VA Medical Center
10701 East Blvd.
Cleveland, OH 44106
(216) 791-3800 ext. 4788
Curtis.Donskey@va.gov
Background: The glycylcycline antibiotic tigecycline may have a relatively low propensity to promote Clostridium difficile infection in part because it causes less disruption of the indigenous intestinal microbiota than other broad-spectrum antibiotics. We used a mouse model to compare the effects of tigecycline versus other commonly used antibiotics on colonization resistance to C. difficile and on the metabolic functions of the intestinal microbiota.
Methods: To assess in vivo colonization resistance to C. difficile , mice were challenged with oral C. difficile spores 1, 7, or 12 days after completion of 3 days of treatment with subcutaneous saline, tigecycline, ceftriaxone, piperacillin-tazobactam, or linezolid. Levels of bacterial metabolites in fecal specimens of mice treated with the same antibiotics were analyzed using non-targeted metabolic profiling by gas chromatograph (GC)/mass spectrometry (MS) and ultra-high performance liquid chromatography-tandem MS (UPLC-MS/MS).
Results: All of the antibiotics disrupted colonization resistance to C. difficile when challenge occurred 2 days after treatment. Only piperacillin/tazobactam mice had disturbed colonization resistance at 7 days after treatment. All of the antibiotics altered fecal metabolites in comparison to controls, but tigecycline caused significantly less alteration than the other antibiotics, including less suppression of multiple amino acids, bile acids, and lipid metabolites.
Conclusions: Tigecycline, linezolid, and ceftriaxone caused transient disruption of colonization resistance to C. difficile, whereas piperacillin/tazobactam caused disruption that persisted for 7 days post-treatment. Tigecycline caused less profound alteration of fecal bacterial metabolites than the other antibiotics, suggesting that the relatively short period of disruption of colonization resistance might be related in part to reduced alteration of the metabolic functions of the microbiota.
Keywords: Tigecycline; Clostridium difficile; ceftriaxone; piperacillin/tazobactam; linezolid; metabolomics; colonization resistance
Antimicrobial therapy plays a central role in the pathogenesis of Clostridium difficile infection (CDI). Nearly all antibiotics have been associated with the development of CDI, but clindamycin, cephalosporins, penicillins, and fluoroquinolones are generally considered the agents that pose the greatest risk [1]. Several recent studies suggest that antibiotics with inhibitory activity against C. difficile (eg, piperacillin/tazobactam) might be less likely than non-inhibitory antibiotics to promote CDI [1-3]. However, the potential to prevent CDI through selective prescription of agents with inhibitory activity against C. difficile may be limited if these agents also disrupt the indigenous microbiota of the colon. For example, piperacillin/tazobactam inhibits colonization by C. difficile in mice during treatment, but promotes growth and toxin production if exposure occurs during the period of recovery of the anaerobic microbiota [1].
Tigecycline is a broad-spectrum glycylcycline antibiotic that is administered intravenously. For several reasons, it is plausible that tigecycline might have a relatively low propensity to promote CDI in comparison to other broad-spectrum antibiotics. First, tigecycline has potent activity against C. difficile and is excreted in significant concentrations in bile (median fecal concentration in human volunteers, 5.6 mg/kg on day 8 of administration) [4]. In a human gut model, tigecycline inhibited growth and toxin production by C. difficile [5]. In mice, tigecycline inhibited establishment of colonization, but did not reduce concentrations of C. difficile once high-density colonization was established [6-7]. Second, there is some evidence that tigecycline may cause relatively limited disruption of the indigenous microbiota of the colon, with sparing of Bacteroides spp. [4, 6]. However, in some studies, tigecycline has caused significant alteration of the microbiota, including Bacteroides spp. [5, 7-8]. Finally, tigecycline inhibits protein synthesis and has been shown to inhibit C. difficile toxin production and sporulation in mice [8].
In addition to providing colonization resistance, the intestinal microbiota provide a number of metabolic functions that benefit the host [9-10]. In mice, we demonstrated that recovery of colonization resistance to C. difficile after clindamycin or piperacillin/tazobactam treatment coincided with restoration of pretreatment levels of several fecal bacterial metabolites [9]. Here we used the same mouse model to test the hypothesis that tigecycline causes less alteration of fecal bacterial metabolites and colonization resistance to C. difficile compared to other broad-spectrum antibiotics. The impact of the antibiotics on levels of bacterial metabolites in fecal specimens was examined using non-targeted metabolic profiling by gas chromatograph (GC)/mass spectrometry (MS) and ultra-high performance liquid chromatography-tandem MS (UPLC-MS/MS).
The C. difficile strain studied was ATCC 43593, a nontoxigenic strain from the American Type Culture Collection (ATCC). We prepared spores as previously described [11], growing C. difficile on Duncan and Strong agar. Harvested using sterile swabs, the spores underwent alcohol shock followed by sonication to break up vegetative material. The minimum inhibitory concentrations (MICs) of tigecycline, piperacillin-tazobactam, linezolid, and ceftriaxone were < 0.012 µg/mL, < 1 µg/mL, < 0.05 µg/mL, and > 256 µg/mL, respectively, as determined by broth dilution.
The Animal Care Committee of the Cleveland Veterans Affairs Medical Center approved the experimental protocol. The experimentation was performed in compliance with the U.S. Department of Health and Human Services Guide for the Care and Use of Laboratory Animals. Female CF-1 mice weighing 25 to 30 g (Harlan Sprague-Dawley, Indianapolis, IN) were housed in individual cages. Mice received daily subcutaneous injections (0.2 mL total volume) of saline, tigecycline (0.05 mg/day), ceftriaxone (1 mg/day), piperacillin-tazobactam (8 mg/day), or linezolid (0.6 mg/day) for 3 days. The antibiotic doses were equal to the usual human doses administered over a 24-hour period (milligrams of antibiotic per gram of body weight). At 2, 7, or 9 days after the final antibiotic dose, mice were administered 103 CFU C. difficile spores (ATCC 43593) in 0.4 mL of sterile water by oral gavage. Mice (6 per group) received daily treatment with the antibiotics as noted above and fecal specimens were collected prior to treatment on day 3 of treatment, and at 2- to 5-day intervals after the final antibiotic dose, for analysis of the intestinal microbiota and stool metabolites.
To quantify the burden of C. difficile, fresh stool samples were collected on days 1, 3, and 7 after the administration of spores. Samples were transferred to an anaerobic chamber (Coy Laboratories, Grass Lake, Michigan), emulsified 1:10 (weight/volume) in pre-reduced phosphate-buffered saline (PBS), serially diluted, and plated on pre-reduced cycloserine-cefoxitin-brucella agar containing 0.1% taurocholic acid and 5 mg/mL lysozyme (C. difficile Brucella Agar [CDBA]) [11]. Fresh stool specimens were used for quantitative culture of enterococci and facultative Gram-negative bacilli. The specimens were emulsified in 5-fold (weight/volume) pre-reduced phosphate-buffered saline. Serially diluted aliquots were inoculated onto selective agar. Plates were incubated at 37°C for 48 hours and CFU per gram of stool were calculated.
Analysis of metabolic compounds in fecal specimens was conducted by Metabolon, Inc. (Durham, NC) using the methods described previously [9, 12-13]. Fecal samples underwent a methanol extraction, and the resulting extract was divided into fractions for analysis using GC/MS, UPLC-MS/MS (positive mode), and UPLC-MS/MS (negative mode). The UPLC-MS/MS platform utilized an Acquity UPLC (Waters, Milford, CA) with a Waters UPLC BEH C18-column 2.1 × 100 mm, 1.7 μm and a ThermoFisher LTQ mass spectrometer, which included an electrospray ionization source and a linear ion-trap mass analyzer. The instrumentation was set to monitor for positive ions in acidic extracts or negative ions in basic extracts through independent injections. The instrument was set to scan 99–1000 m/z and alternated between MS and MS/MS scans. Samples destined for analysis by GC-MS were dried under vacuum desiccation for a minimum of 18 hours prior to being derivatized using bis(trimethylsilyl) trifluoroacetamide. Derivatized samples were separated on a 5% phenyldimethyl silicone column with helium as carrier gas and a temperature ramp from 60° to 340°C within a 17-min period. All samples were analyzed on a Thermo-Finnigan Trace DSQ fast-scanning single-quadrupole MS operated at unit mass resolving power with electron impact ionization and a 50–750 atomic mass unit scan range.
Metabolites were identified by automated comparison of the ion features in the experimental samples to a reference library of chemical standard entries that included retention time, molecular weight (m/z), preferred adducts, and in-source fragments as well as associated MS spectra, and were curated by visual inspection for quality control using software developed at Metabolon. Identification of known chemical entities was based on comparison to metabolomic library entries of more than 2,400 purified standards. An additional 5,300 mass spectral entries have been created for structurally unnamed biochemicals, which have been identified by virtue of their recurrent nature (both chromatographic and mass spectral). Peaks were quantified using area under the curve. Raw area counts for each metabolite in each sample were normalized to correct for variation resulting from instrument inter-day tuning differences by the median value for each run-day; therefore the medians were set to 1.0 for each run. This preserved variation between samples but allowed metabolites of widely different raw peak areas to be compared on a similar graphical scale. Missing values were imputed with the observed minimum after normalization. Biochemicals were mapped to pathways using the Kyoto Encyclopedia of Genes and Genomes (KEGG) database [14] or the Human Metabolome Database [15].
Analysis of variance (ANOVA) with repeated measures was used to compare concentrations of microbiota species or groups of control versus antibiotic-treated mice. To account for multiple comparisons in each group we applied Bonferroni’s correction and considered P < 0.005 to be statistically significant. For the metabolite analysis, ANOVA with repeated measures was performed after log transformation to identify compounds that differed significantly between control and antibiotic-treated groups. The fold change in the concentrations of the compounds determined to be of importance in distinguishing antibiotic-treated versus control mice in comparison to the baseline levels was graphed over time. For purposes of analysis, we considered compounds with a 10-fold or greater increase or decrease in antibiotic-treated mice versus control mice to be meaningful. Data analyses were performed using R software (version 2.10.1).
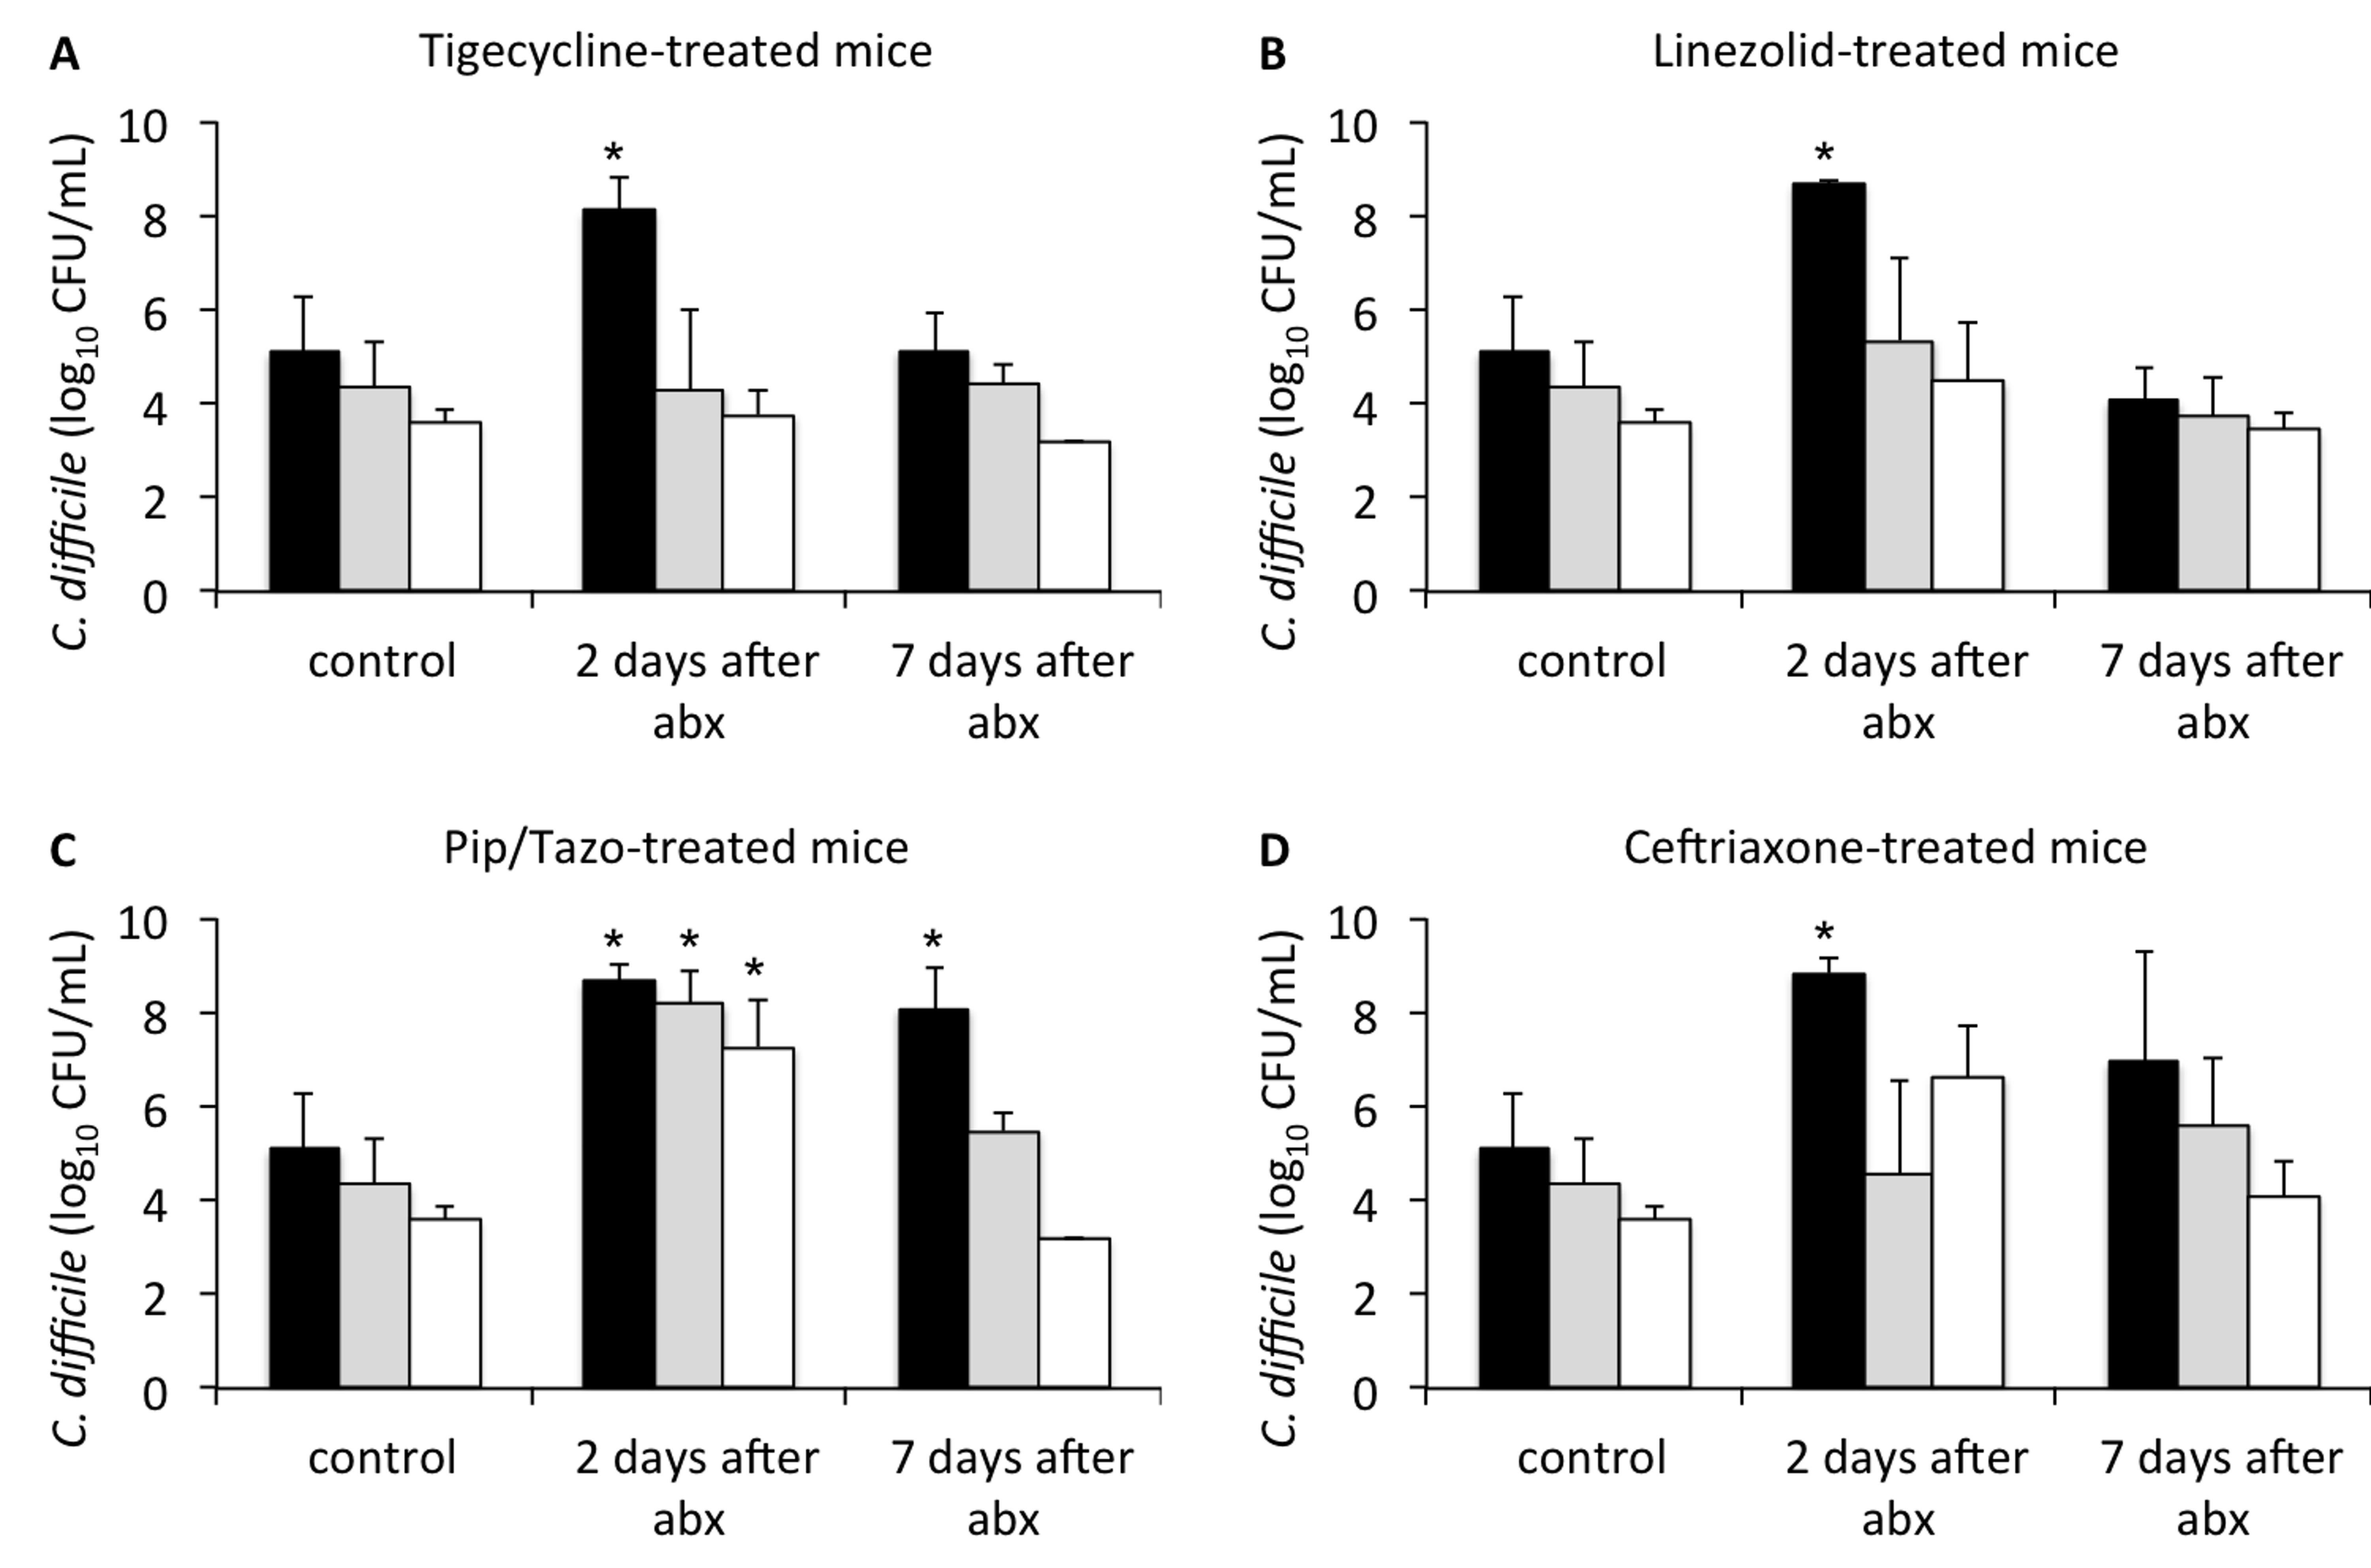
Figure 1 shows the effect of antibiotic treatment on the establishment of colonization with C. difficile when mice were challenged 2 or 7 days after the last antibiotic dose. In comparison to saline controls, mice in all of the antibiotic groups initially developed high concentrations of C. difficile in stool (P < 0.005) when challenged 2 days after the last antibiotic dose. Mice treated with piperacillin/tazobactam and challenged 7 days after the last antibiotic dose also developed significant overgrowth of C. difficile in comparison to controls (P < 0.001), whereas those treated with tigecycline, linezolid, or ceftriaxone did not. At 9 days after the last antibiotic dose, none of the treatment groups developed overgrowth of C. difficile after challenge by oral gavage (data not shown).
Figure 1. Timing of recovery of in vivo colonization resistance following antibiotic treatment. Mice (3 per group at each time point) were challenged with 104 colony-forming units of non-toxigenic Clostridium difficile spores by orogastric gavage 2 or 7 days following treatment with 3 days of daily subcutaneous tigecycline (A), linezolid (B), piperacillin/tazobactam (C), or ceftriaxone (D). Concentrations of C. difficile in feces were measured by quantitative cultures 1 (black bars), 3 (grey bars), or 7 (white bars) days following challenge. *P < 0.005 indicates comparison of antibiotic-treated mice to control animals at the corresponding time point after C. difficile challenge. Error bars represent standard error. Results are shown for 1 of 2 duplicate experiments. Abx, antibiotics, Pip/Tazo, piperacillin/tazobactam.
As shown in Figure 2A, in comparison to controls, tigecycline promoted overgrowth of enterococci during treatment, with recovery to levels not significantly different from controls by 6 days after the last antibiotic dose. In comparison to controls, linezolid, piperacillin/tazobactam, and ceftriaxone resulted in significantly reduced levels of enterococci during treatment (P < 0.01), with a subsequent rebound after discontinuation of treatment to concentrations significantly higher than controls (P < 0.01). As shown in Figure 2B, piperacillin/tazobactam and ceftriaxone suppressed levels of facultative Gram-negative bacilli during treatment (P < 0.001), whereas tigecycline and linezolid promoted overgrowth (P < 0.01).
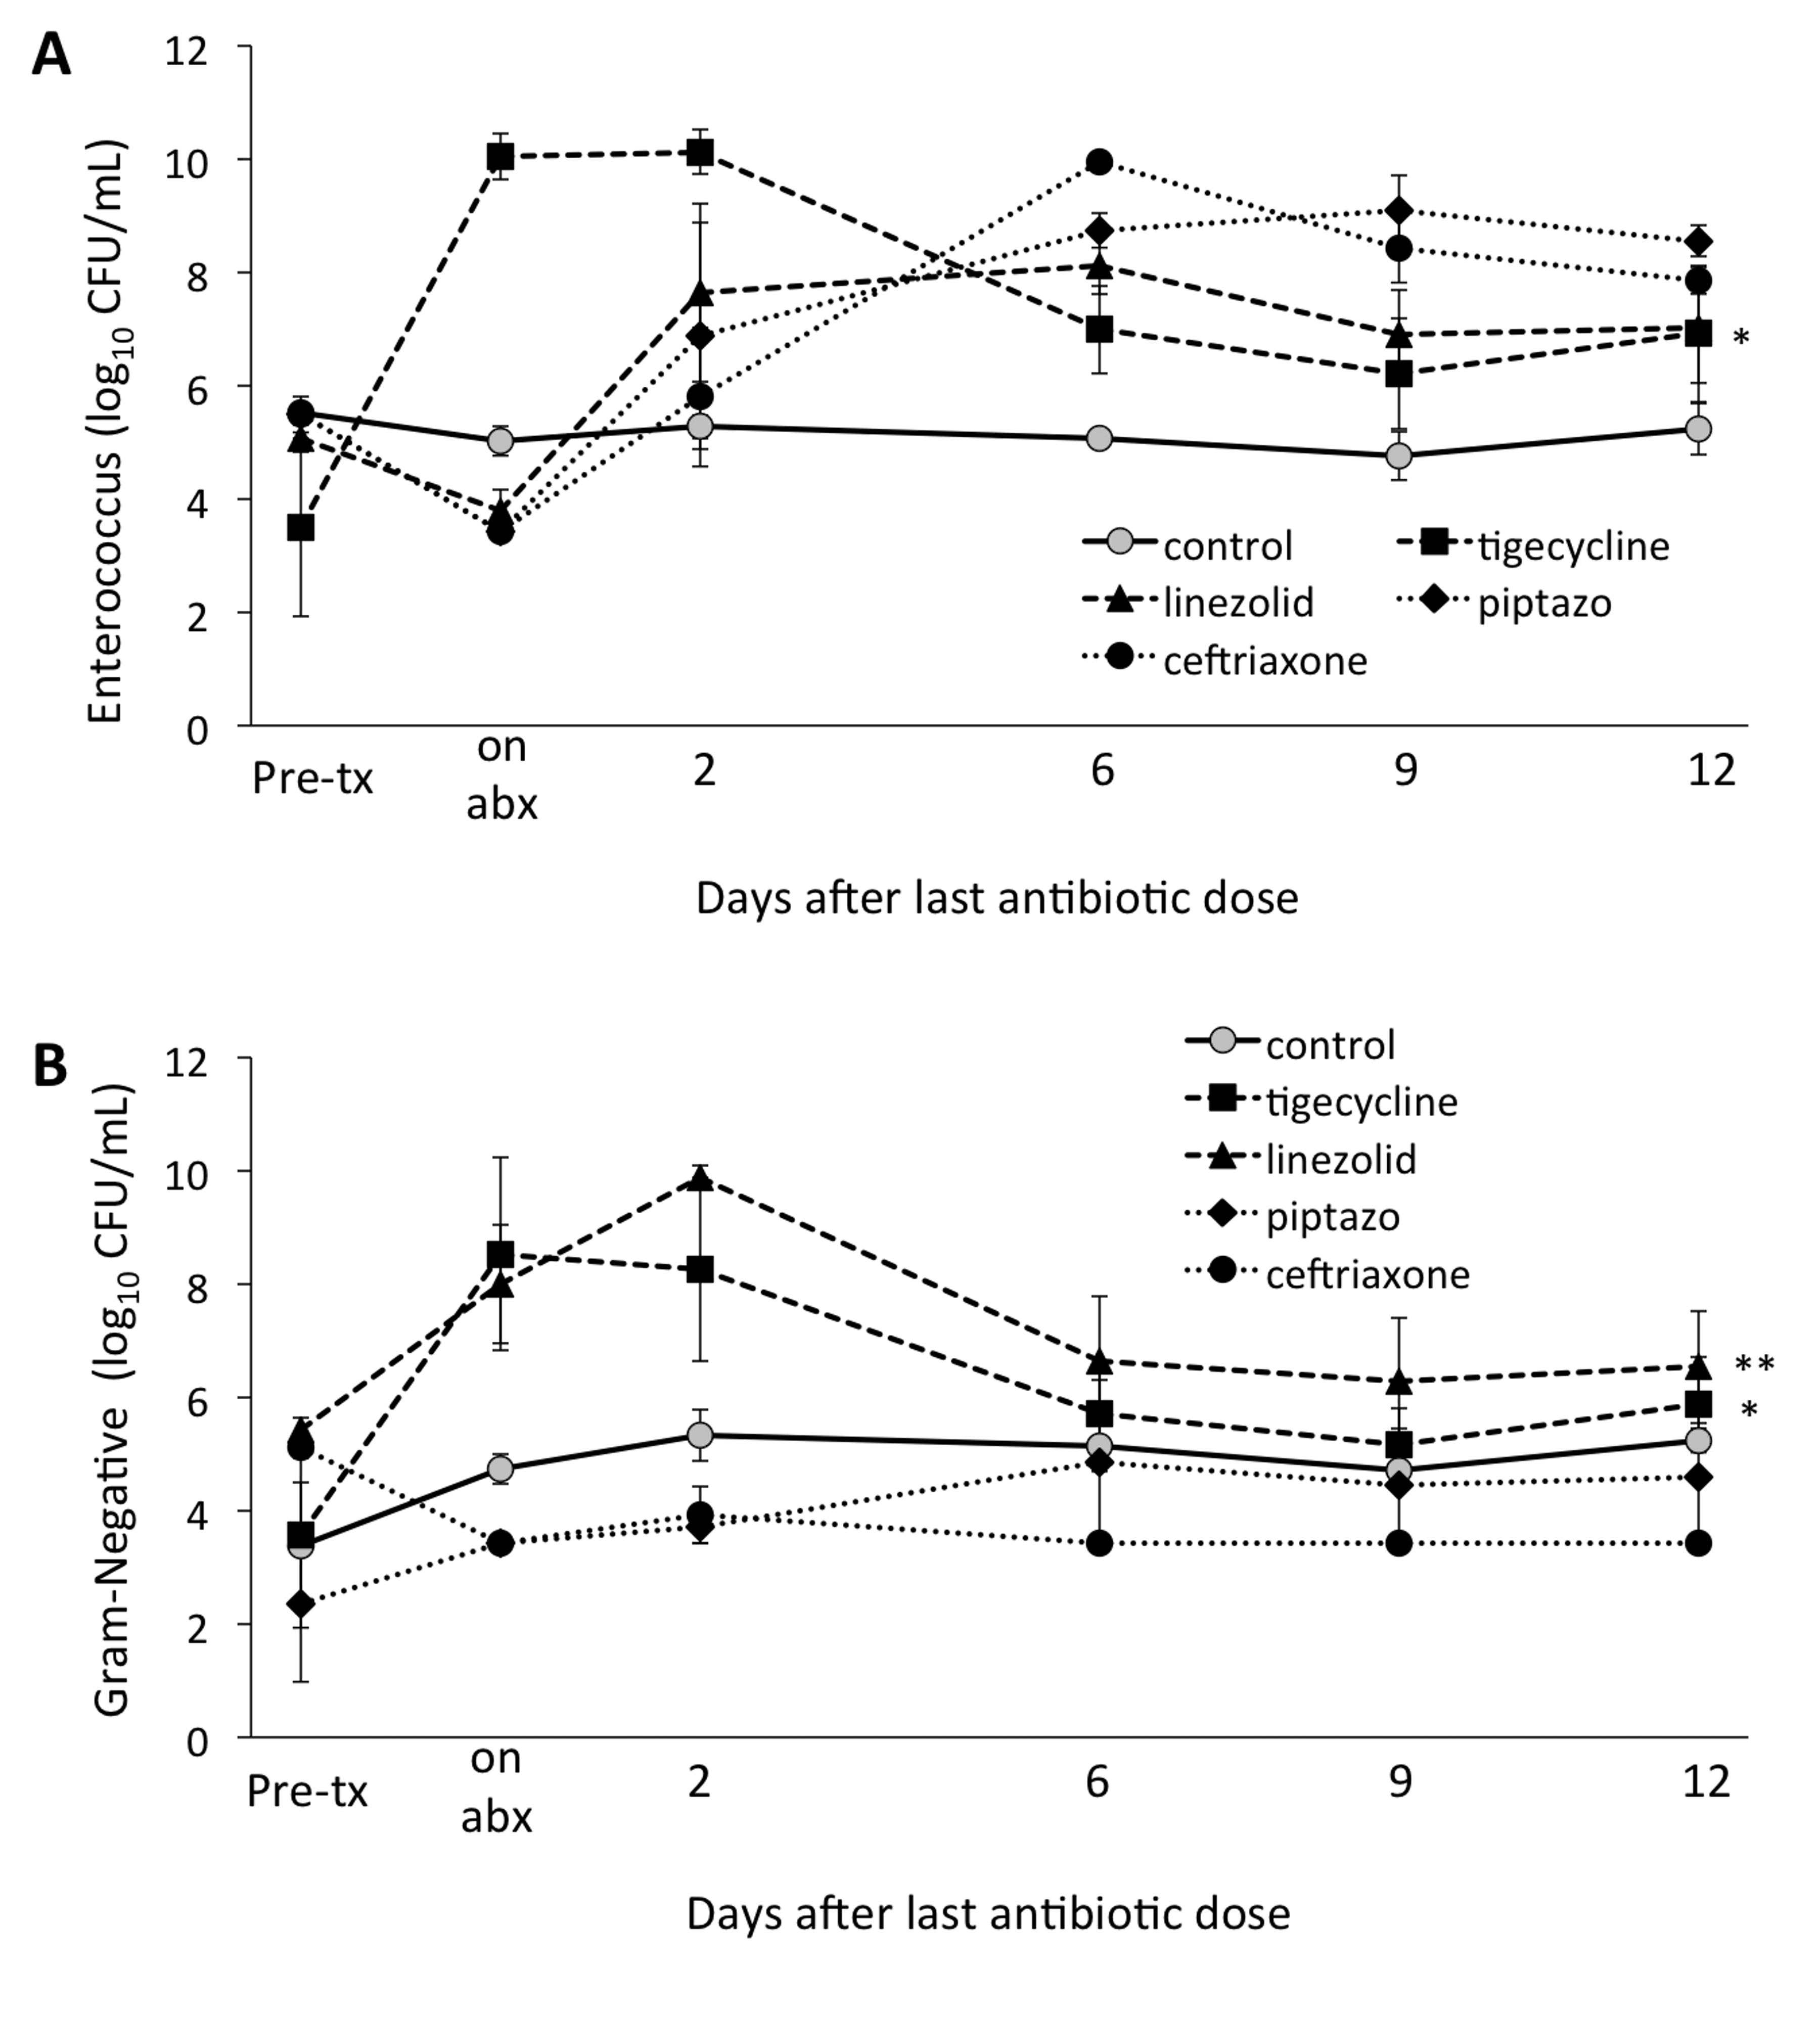
Figure 2. Timing of recovery of enterococci (A) and facultative Gram-negative bacilli (B) by quantitative culture following antibiotic treatment. Mice (6 per group) received subcutaneous antibiotics or normal saline for 3 days. Quantitative cultures were used to measure total enterococci or facultative Gram-negative bacilli in fecal specimens collected either before treatment, during or following treatment. In both panels, * indicates P < 0.05 for tigecycline-treated animals compared to control animals over the course of the experiment, specifically from antibiotic exposure through day 12 after the last antibiotic dose. In panel B, ** indicates P < 0.005 for linezolid-treated animals compared to control animals, also over the course of the experiment. Error bars represent standard error. Abx, antibiotics; pip/tazo, piperacillin/tazobactam.
Five-hundred fifteen compounds were identified in the fecal samples. Figure 3 shows the number of metabolites exhibiting a 10-fold or greater increase or decrease in concentration in comparison to baseline. Each of the antibiotics resulted in 10-fold increases in 20 or more compounds during treatment (day 3) and on day 2 after treatment, but fewer than 10 compounds remained elevated 10-fold by day 12 after treatment. Piperacillin/tazobactam, ceftriaxone, and linezolid treatment resulted in transient 10-fold decreases in concentrations of 50 or more compounds, whereas tigecycline caused such changes in only 18 compounds.
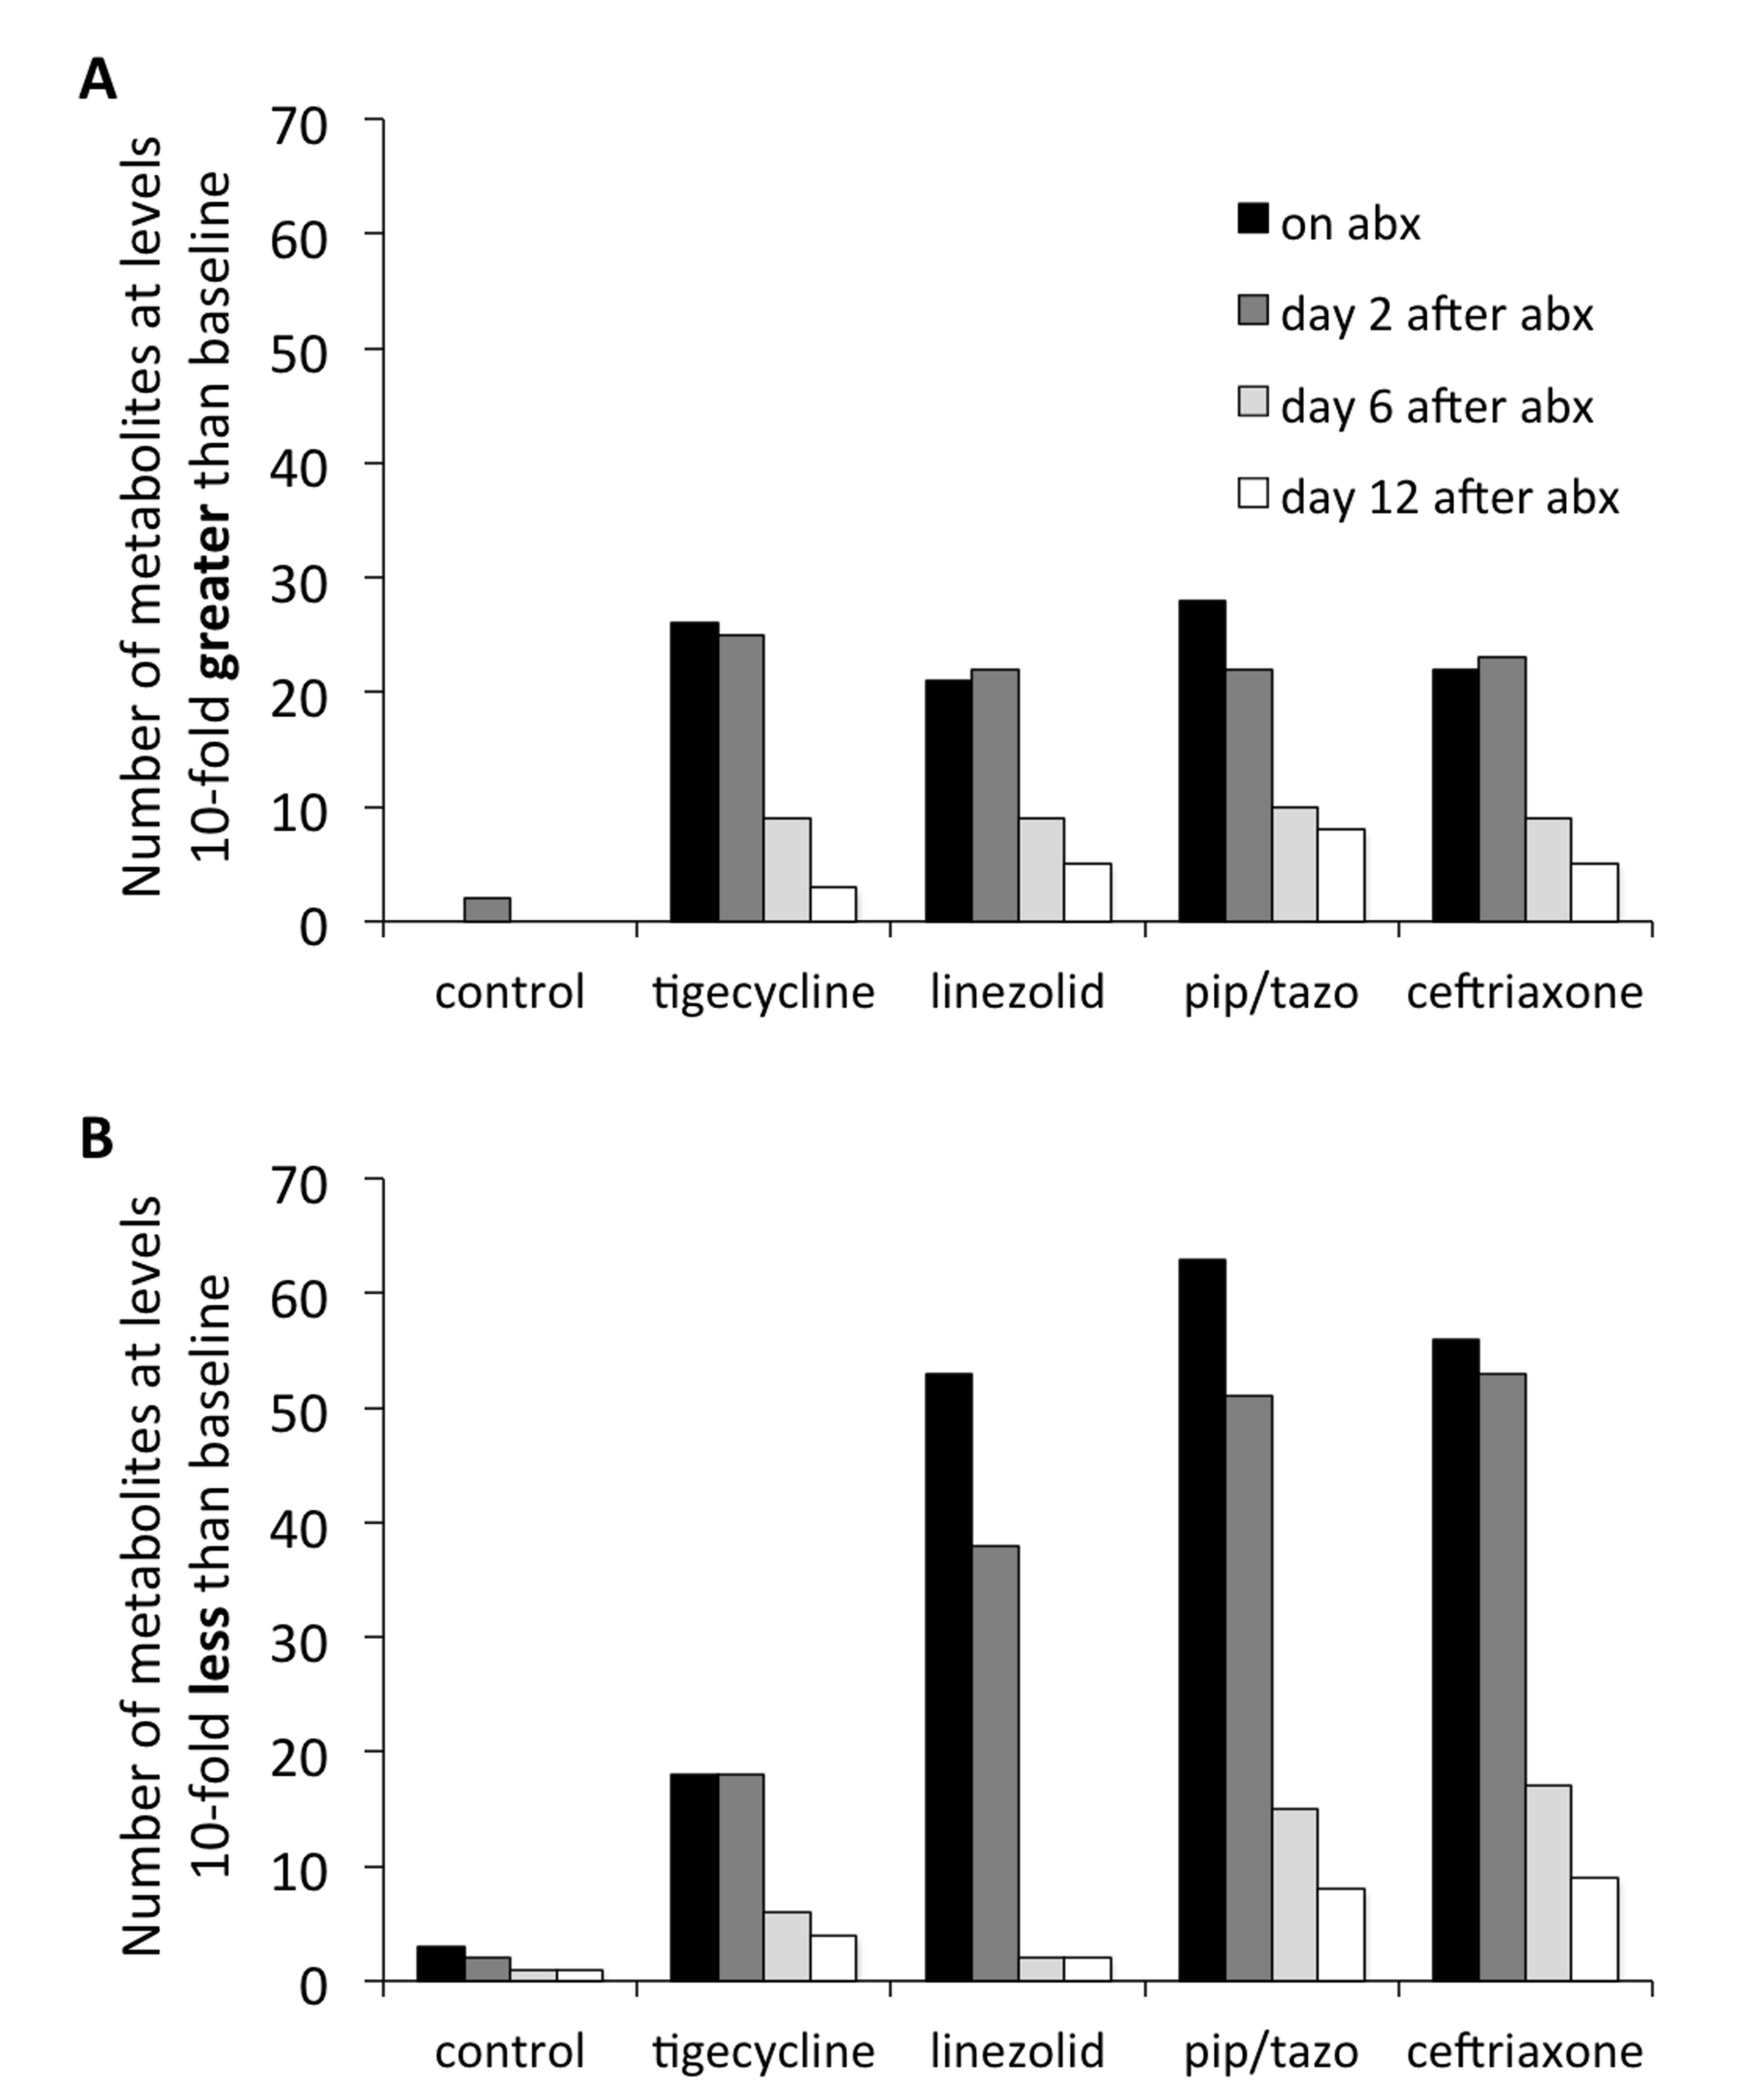
Figure 3. Impact of antibiotic treatment on fecal metabolites. Numbers of fecal metabolites with a 10-fold increase (A) or decrease (B) compared to control animals during antibiotic treatment (black bars) and at 2 days (dark grey bars), 6 days (light grey bars), and 12 days (white bars) following antibiotics. Abx, antibiotics, pip/tazo, piperacillin/tazobactam.
Table 1 provides an overview of the metabolic super-pathways in which 10-fold or greater alterations in fecal metabolites occurred in mice treated with the 3 antibiotics causing the most profound alteration (ie, piperacillin/tazobactam, ceftriaxone, and linezolid) or in all 4 antibiotics. The metabolic sub-pathways and names of the metabolites are shown in Table 2. In contrast to the other antibiotics, tigecycline caused less suppression of a wide range of amino acid, bile acid, and lipid metabolites. Figure 4 provides examples of the impact of the antibiotics on scaled intensity of specific compounds. Table S1 shows the metabolites analyzed and the effect of antibiotic treatment expressed as a ratio of the metabolites detected in the fecal material of treated animals versus control animals at each time point.
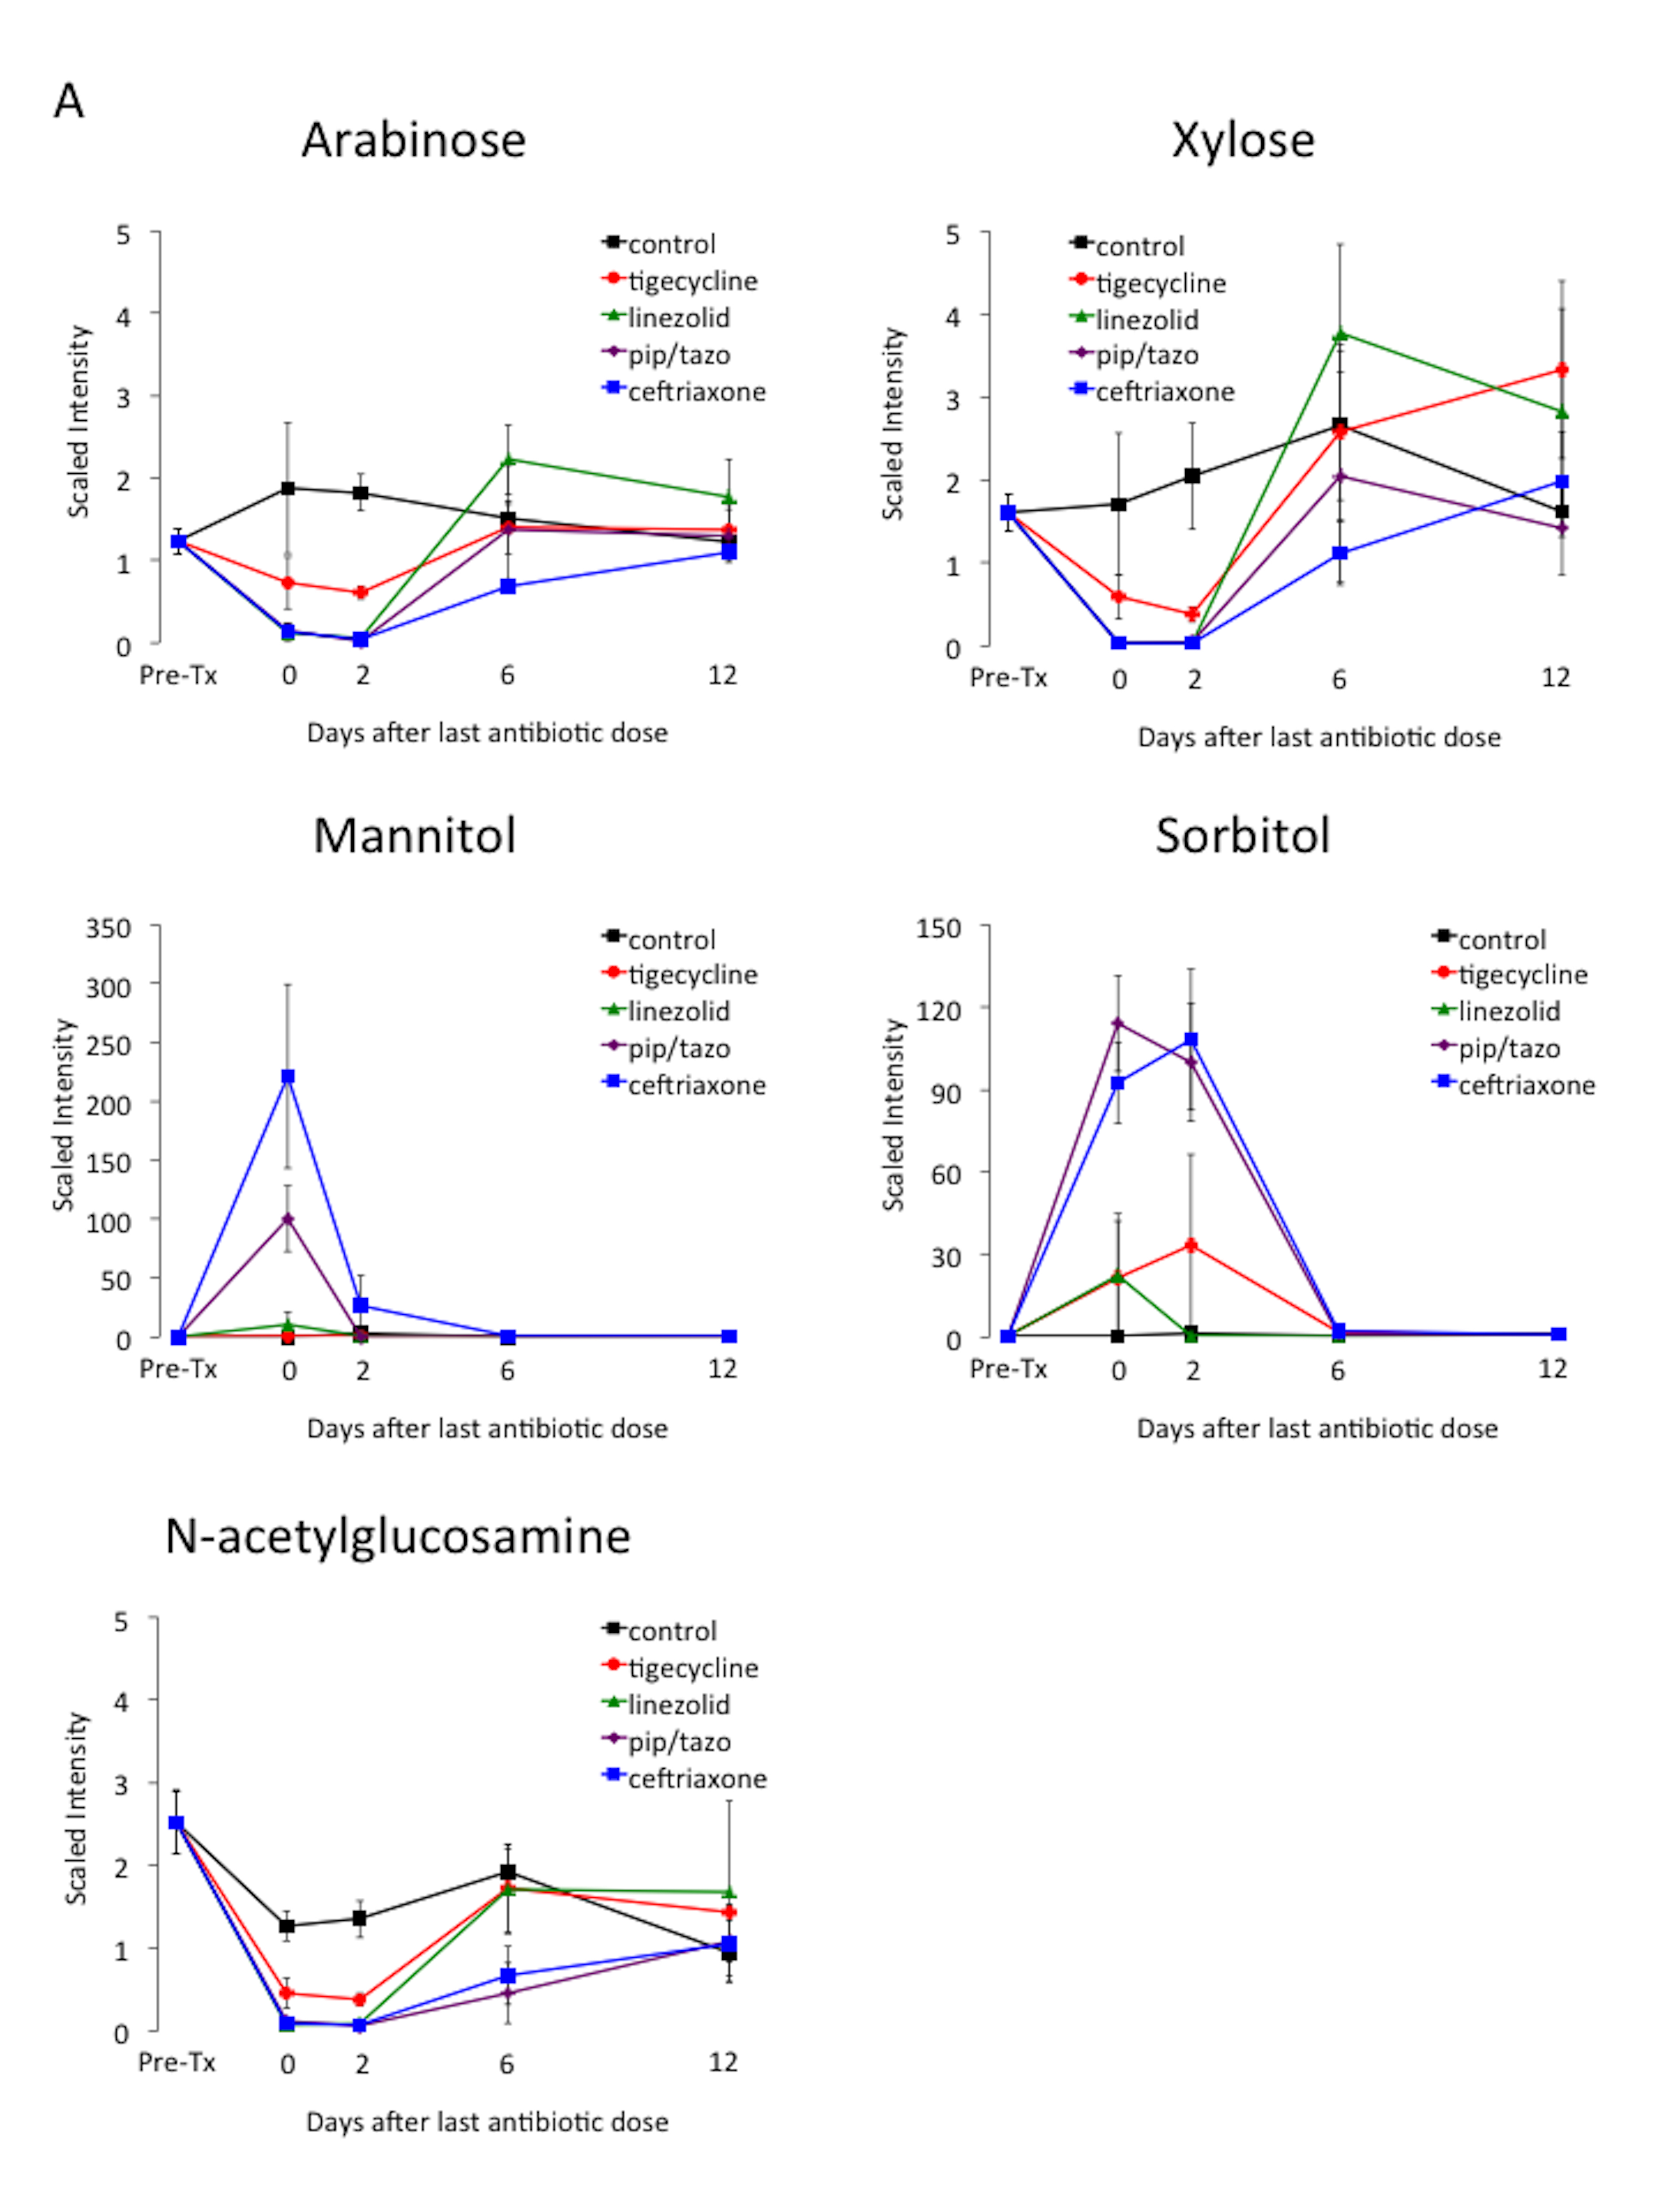
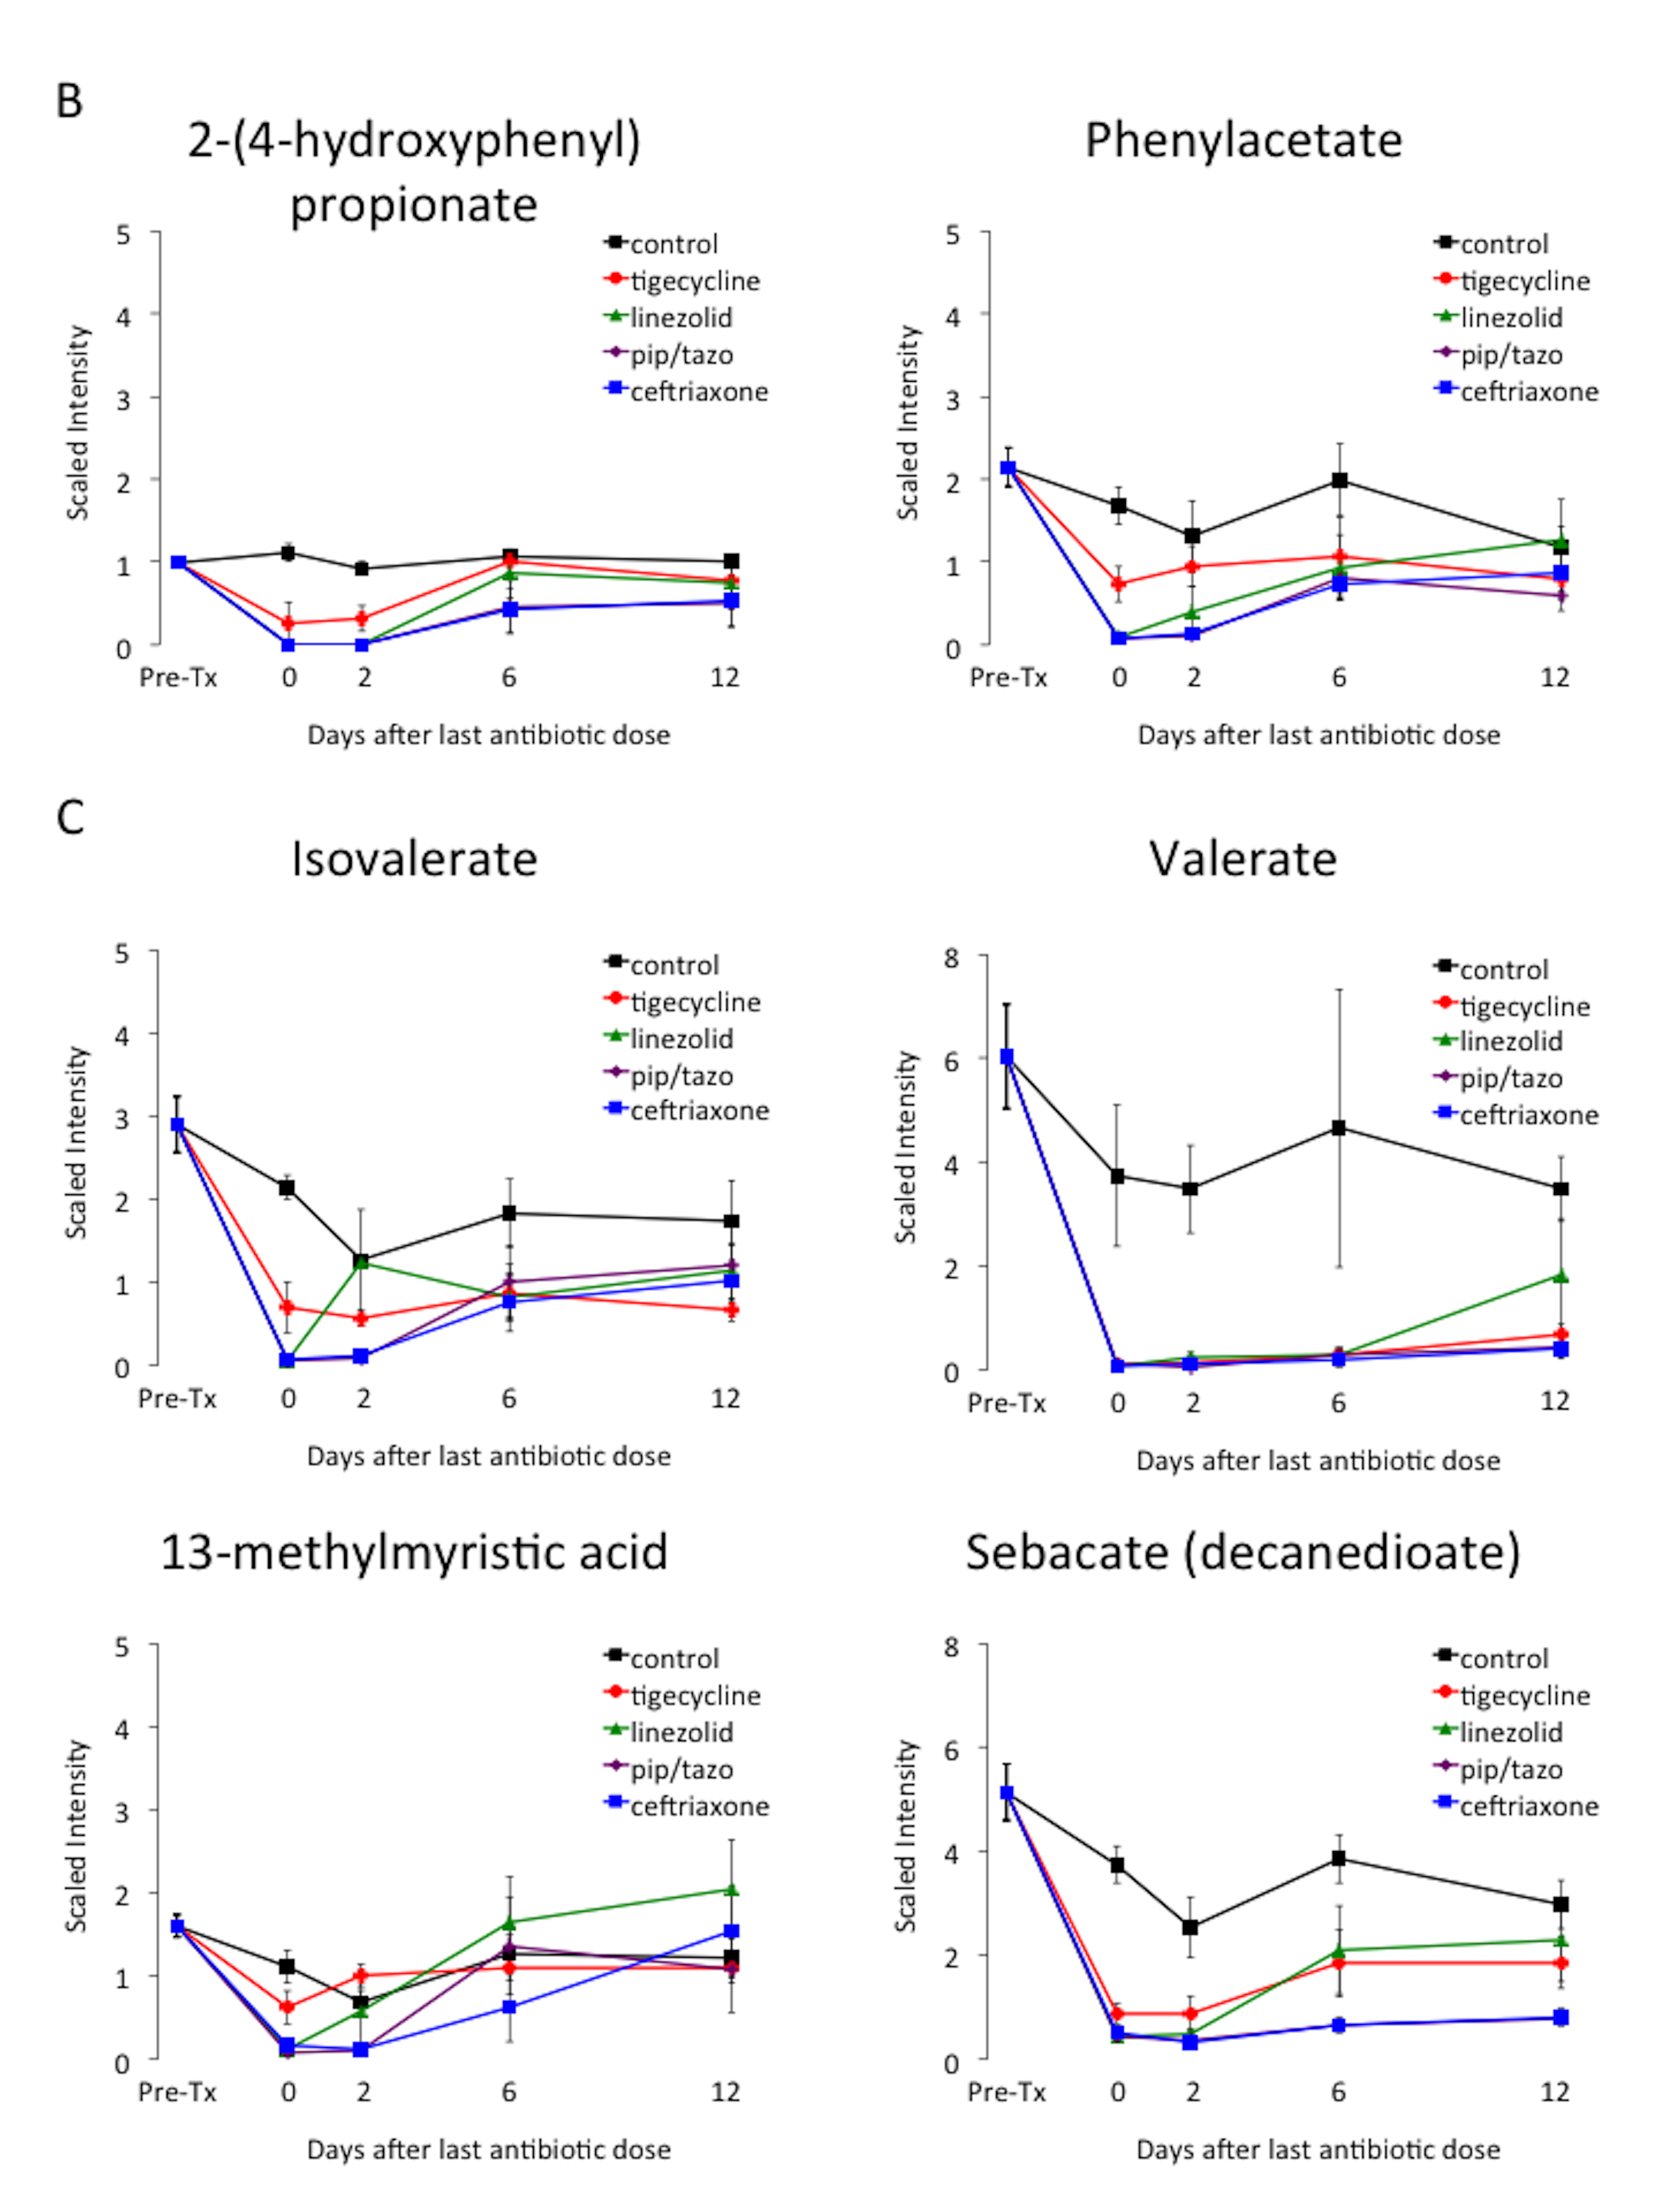
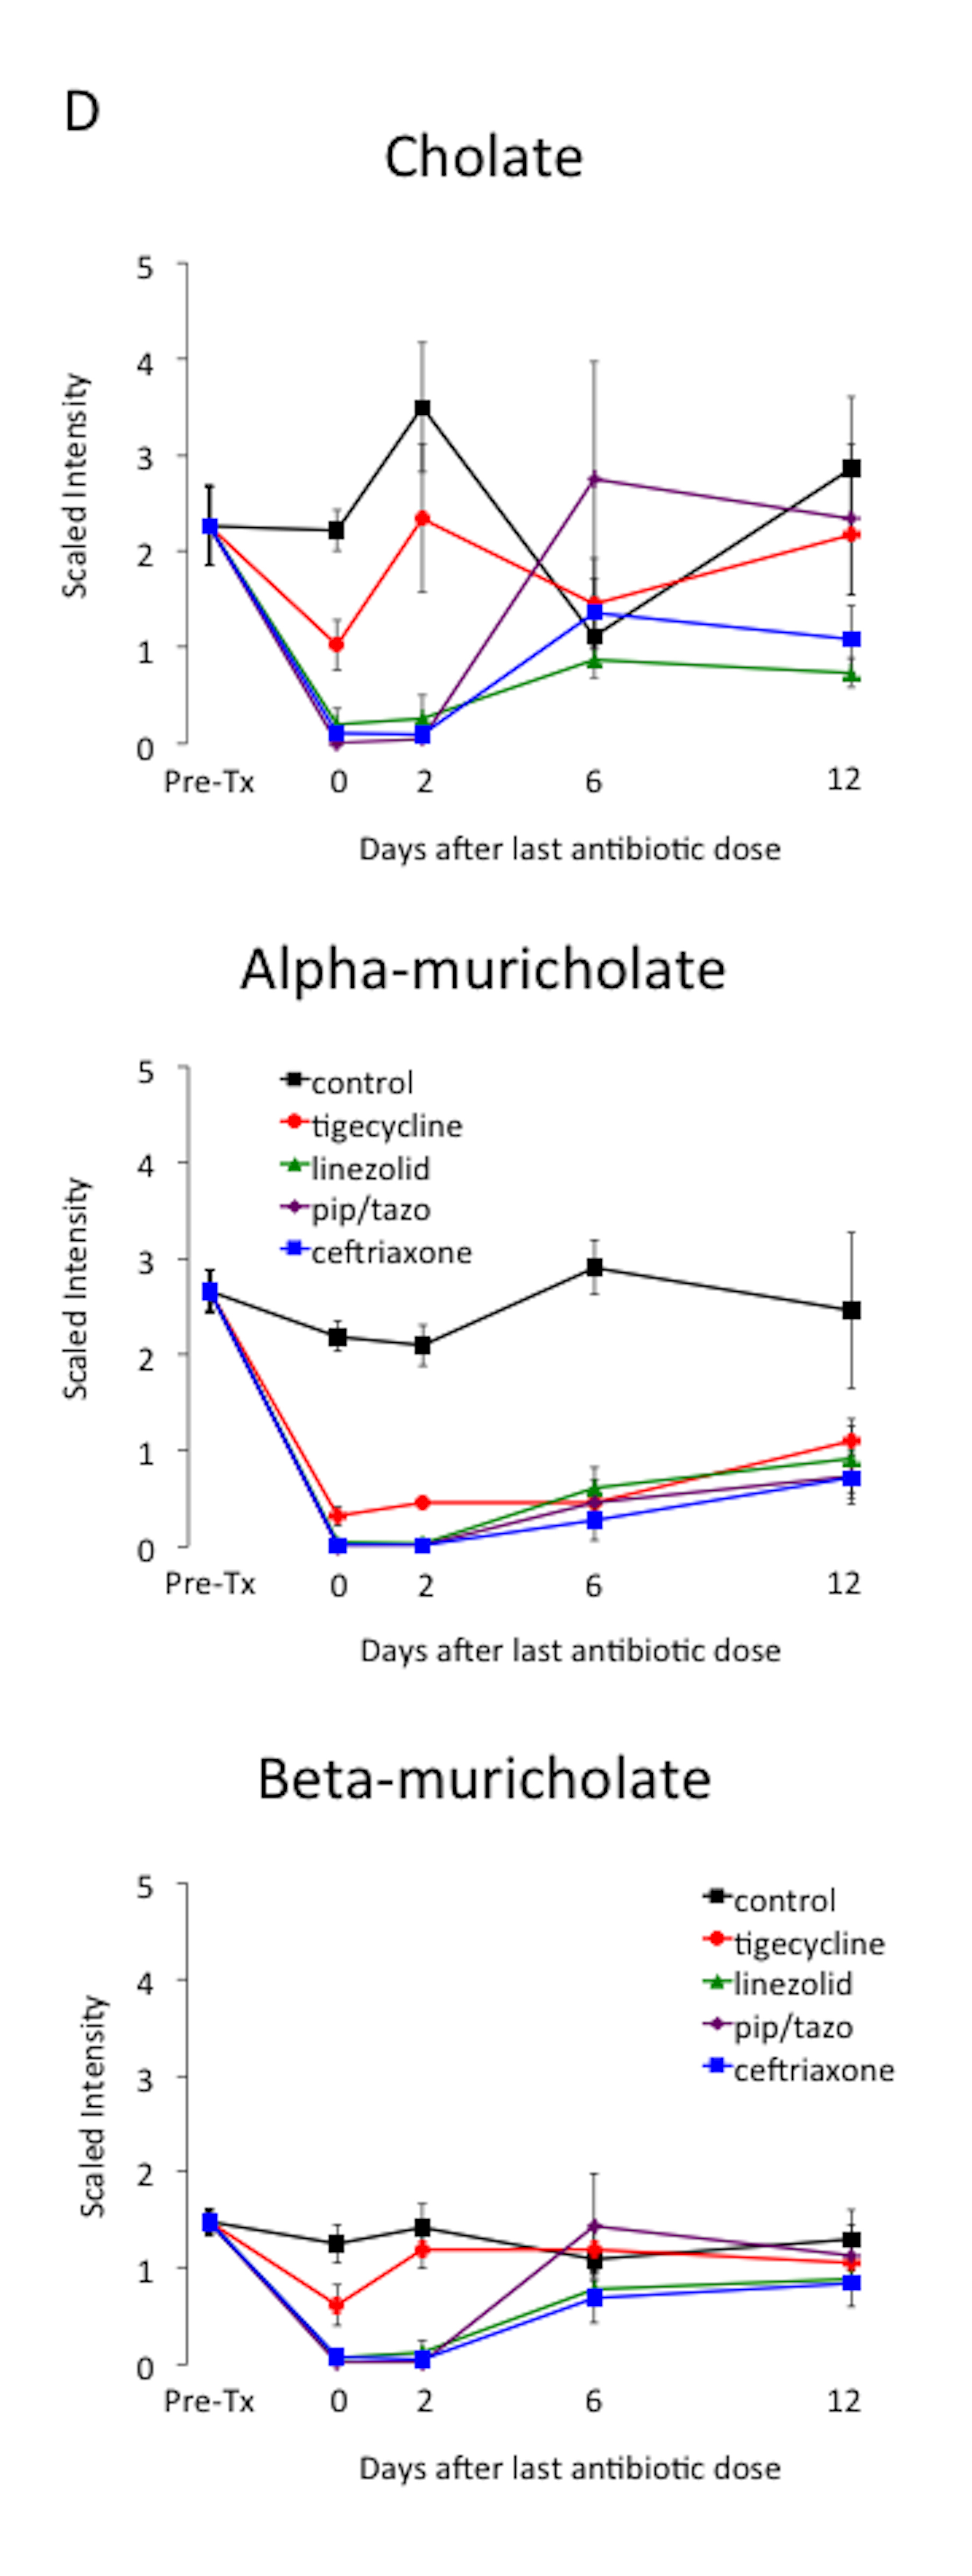
Figure 4. Changes in levels of fecal metabolites. Mice (4 per group at each time point) received subcutaneous antibiotics or saline for 3 days. Changes in the level of selected compounds from several different metabolic pathways: (A) carbohydrates; (B) phenylalanine and tyrosine; (C) fatty acids; and (D) bile acids. Error bars represent standard error. Pre-Tx, pre-antibiotic baseline. Pip/tazo, piperacillin/tazobactam.
Table 1. SuperPathways of Fecal Metabolites That Show a 10-fold Change vs. Baselinea
|
10-fold decrease |
10-fold increase |
|||||
|
Metabolic SuperPathwayb |
3 abxc |
4 abx |
total |
3abxc |
4abx |
Total |
|
Amino Acid |
7 |
1 |
8 |
|||
|
Carbohydrate |
3 |
2 |
5 |
2 |
2 |
4 |
|
Lipids, Bile Acids |
6 |
1 |
7 |
|||
|
Lipids, other |
5 |
0 |
5 |
|||
|
Nucleotides |
1 |
0 |
1 |
|||
|
Peptides |
1 |
1 |
2 |
|||
|
Xenobiotics |
3 |
0 |
3 |
2 |
3 |
5 |
Table 2. Metabolic Subpathways and Biochemicals of Fecal Metabolites That Show a 10-fold Change vs. Baselinea
|
Super-Pathway |
Sub-Pathway |
Biochemical Name |
Tigecycline |
Linezolid |
Piperacillin/tazobactam |
Ceftriaxone |
|
Amino acid |
Glycine, serine and threonine metabolism |
sarcosine (N-Methylglycine) |
1b |
1 |
1 |
|
|
Amino acid |
Phenylalanine and tyrosine metabolism |
2-(4-hydroxyphenyl)propionate |
1 |
1 |
1 |
|
|
Amino acid |
Phenylalanine and tyrosine metabolism |
4-hydroxyphenylacetate |
1 |
1 |
1 |
|
|
Amino acid |
Phenylalanine and tyrosine metabolism |
phenylacetate |
1 |
1 |
1 |
|
|
Amino acid |
Urea cycle; arginine-, proline-, metabolism |
2-aminopentanoate |
1 |
1 |
1 |
|
|
Amino acid |
Urea cycle; arginine and proline metabolism |
5-aminovalerate |
1 |
1 |
1 |
1 |
|
Amino acid |
Valine, leucine, and isoleucine metabolism |
3-methyl-2-oxobutyrate |
1 |
1 |
1 |
|
|
Amino acid |
Valine, leucine, and isoleucine metabolism |
4-methyl-2-oxopentanoate |
1 |
1 |
1 |
|
|
Carbohydrate |
Amino-sugars metabolism |
N-acetylglucosamine |
1 |
1 |
1 |
|
|
Carbohydrate |
Amino-sugars metabolism |
N-acetylneuraminate |
1 |
1 |
1 |
1 |
|
Carbohydrate |
Fructose, mannose, galactose, starch, and sucrose metabolism |
galactinol |
10 |
10 |
10 |
|
|
Carbohydrate |
Fructose, mannose, galactose, starch, and sucrose metabolism |
mannitol |
10 |
10 |
10 |
|
|
Carbohydrate |
Fructose, mannose, galactose, starch, and sucrose metabolism |
N-acetylmuramate |
1 |
1 |
1 |
1 |
|
Carbohydrate |
Fructose, mannose, galactose, starch, and sucrose metabolism |
raffinose |
10 |
10 |
10 |
10 |
|
Carbohydrate |
Fructose, mannose, galactose, starch, and sucrose metabolism |
sorbitol |
10 |
10 |
10 |
10 |
|
Carbohydrate |
Nucleotide sugars, pentose metabolism |
arabinose |
1 |
1 |
1 |
|
|
Carbohydrate |
Nucleotide sugars, pentose metabolism |
xylose |
1 |
1 |
1 |
|
|
Lipid |
Bile acid metabolism |
12-dehydrocholate |
1 |
1 |
1 |
1 |
|
Lipid |
Bile acid metabolism |
3-dehydrocholate |
1 |
1 |
1 |
|
|
Lipid |
Bile acid metabolism |
7,12-diketolithocholate |
1 |
1 |
1 |
|
|
Lipid |
Bile acid metabolism |
alpha-muricholate |
1 |
1 |
1 |
|
|
Lipid |
Bile acid metabolism |
beta-muricholate |
1 |
1 |
1 |
|
|
Lipid |
Bile acid metabolism |
cholate |
1 |
1 |
1 |
|
|
Lipid |
Bile acid metabolism |
lithocholate [6-oxo or 7-keto] |
1 |
1 |
1 |
|
|
Lipid |
Fatty acid metabolism |
isovalerate |
1 |
1 |
1 |
|
|
Lipid |
Fatty acid, branched |
13-methylmyristic acid |
1 |
1 |
1 |
|
|
Lipid |
Fatty acid, dicarboxylate |
sebacate (decanedioate) |
1 |
1 |
1 |
|
|
Lipid |
Long-chain fatty acid |
conjugated linoleate (18:2n7; 9Z,11E) |
1 |
1 |
1 |
|
|
Lipid |
Sphingolipid |
3-ketosphinganine |
1 |
1 |
1 |
|
|
Nucleotide |
Purine metabolism, guanine-containing |
guanine |
1 |
1 |
1 |
|
|
Peptide |
Dipeptide |
pyroglutamylvaline |
10 |
10 |
10 |
|
|
Peptide |
gamma-glutamyl |
gamma-glutamylisoleucine |
10 |
10 |
10 |
10 |
|
Xenobiotics |
Food component/plant |
dihydroferulic acid |
1 |
1 |
1 |
|
|
Xenobiotics |
Food component/plant |
ferulate |
1 |
1 |
1 |
|
|
Xenobiotics |
Food component/plant |
Isobar: dihydrocaffeate, 3,4-dihydroxycinnamate |
1 |
1 |
1 |
|
|
Xenobiotics |
Food component/plant |
melezitose |
10 |
10 |
10 |
|
|
Xenobiotics |
Food component/plant |
shikimate |
10 |
10 |
10 |
10 |
|
Xenobiotics |
Food component/plant |
soyasaponin I |
10 |
10 |
10 |
10 |
|
Xenobiotics |
Food component/plant |
soyasaponin II |
10 |
10 |
10 |
10 |
|
Xenobiotics |
Sugar, sugar substitute, starch |
1-kestose |
10 |
10 |
10 |
|
|
a Considers 10-fold changes during or 2 days following completion of antibiotics but not at 6 or 12 days after completion of antibiotics. b 1 indicates a 10-fold decrease and 10 indicates a 10-fold increase compared to baseline values during or 2 days following antibiotics but not at 6 or 12 days following antibiotics. |
||||||
Broad-spectrum antibiotic therapy often results in unintended adverse consequences due to disruption of the indigenous microbiota of the host. In mice, we found that each of the antibiotics studied altered colonization resistance to C. difficile when challenged with spores 2 days post-treatment. However, only piperacillin/tazobactam caused disruption that persisted for 7 days post-treatment. Each of the antibiotics caused significant alteration of multiple fecal bacterial metabolites, but tigecycline caused less profound alteration than the other antibiotics. Thus, the relatively short period of disruption of colonization resistance by tigecycline might be related in part to the fact that this agent causes less alteration of the microbiota.
Our finding that antibiotic treatment dramatically alters fecal metabolites is consistent with other recent studies [9, 16-21]. In several studies in rodents, antibiotic treatment has been shown to reduce fecal excretion of amino acids and/or short chain fatty acids (SCFAs) [9, 16-19]. Theriot et al. reported that treatment of mice with the broad-spectrum antibiotic cefoperazone resulted in elevation of sugar alcohols and primary bile acids, and decreases in secondary bile acids and SCFAs [20]. Moreover, C. difficile was able to exploit these metabolic changes to colonize the intestinal tract, including use of the primary bile acid taurocholate for germination and sugar alcohols and other carbon sources for growth [20]. Finally, we previously reported that clindamycin or piperacillin/tazobactam treatment resulted in alteration of a wide range of fecal bacterial metabolites, including intermediates in carbohydrate or protein metabolism that increased (pentitols, gamma-glutamyl amino acids, and inositol metabolites) or decreased (pentoses, dipeptides) with treatment [9].
A number of the compounds that increased or decreased by 10-fold in concentration during antibiotic treatment demonstrated normalization within 6 to 12 days concurrent with recovery of colonization resistance (Figure 3). Thus, these compounds could potentially serve as biomarkers or mediators of colonization resistance. Some of these potential biomarkers were intermediates in carbohydrate or protein metabolism that increased during antibiotic treatment (eg, sugar alcohols, dipeptides, and gamma-glutamyl amino acids), presumably due to loss of metabolic digestion by the intestinal microbiota. Other potential biomarkers of colonization resistance decreased during antibiotic treatment and then showed evidence of recovery (eg, alpha-muricholate, lithocholate, beta-muricholate, N-acetylglucosamine, N-acetylneuraminate, isovalerate, and valerate). Several studies have suggested that secondary bile salts such as lithocholate may play a role in colonization resistance to C. difficile through inhibition of germination and outgrowth [22-23].
Our study has some limitations. The in vivo colonization resistance assessment included only one strain of C. difficile that was non-toxigenic. However, we have previously demonstrated that non-toxigenic C. difficile strains colonize mice similarly to toxigenic strains [9]. Our model did not provide an assessment of prolonged or repeated courses of broad-spectrum antibiotics that might cause more prolonged disruption of the microbiota. We did not include an analysis of the anaerobic microbiota in the current study. However, we have previously demonstrated that concentrations of Bacteroides spp. are not reduced in this mouse model [9], consistent with a previous study of healthy human volunteers [4]. Given the degree of functional redundancy of the intestinal microbiota, it is likely that multiple families of bacteria may be able to carry out the metabolic conversions required to produce the metabolites identified here. Tigecycline promoted overgrowth of enterococci and facultative Gram-negative bacilli in stool despite the fact that it has activity against many strains of these organisms. This observation may be due to the emergence of resistant strains of these types of bacteria, but we did not include an evaluation for emergence of resistant organisms in our study. Others have demonstrated that tigecycline treatment may suppress susceptible Escherichia coli while promoting overgrowth of total facultative Gram-negative bacilli due to the emergence of tigecycline-resistant strains (eg, Klebsiella and Enterobacter spp.) [4, 7].
Dr. Donskey has received research support from Merck, Pfizer, and Synthetic Biologics.
This work was supported by the Geriatric Research, Education and Clinical Center (GRECC) of the Veterans Integrated Service Network (VISN) 10 (RJ, CD), the National Institutes of Health (NIH; R03-AG040722 to RJ), and a grant from Pfizer (CD). RJ gratefully acknowledges the T. Franklin Williams Scholarship with funding provided by Atlantic Philanthropies, Inc., the John A. Hartford Foundation, the Association of Specialty Professors, the Infectious Diseases Society of America, and the National Foundation for Infectious Diseases.
1. Owens RC, Jr, Donskey CJ, Gaynes RP, Loo VG, Muto CA. Antimicrobial-associated risk factors for Clostridium difficile infection. Clin Infect Dis. 2008;46 Suppl 1:S19-31. PubMed PMID: 18177218. doi: 10.1086/521859
2. Kundrapu S, Sunkesula VC, Jury LA, Cadnum JL, Nerandzic MM, Musuuza JS, Sethi AK, Donskey CJ. Do piperacillin/tazobactam and other antibiotics with inhibitory activity against Clostridium difficile reduce the risk for acquisition of C. difficile colonization? BMC Infect Dis. 2016;16:159. PubMed PMID: 27091232. PubMed Central PMCID: 4835867. doi: 10.1186/s12879-016-1514-2
3. Dubberke ER, Reske KA, Seiler S, Hink T, Kwon JH, Burnham CA. Risk Factors for Acquisition and Loss of Clostridium difficile Colonization in Hospitalized Patients. Antimicrob Agents Chemother. 2015;59(8):4533-43. PubMed PMID: 25987626. PubMed Central PMCID: 4505269. doi: 10.1128/AAC.00642-15
4. Nord CE, Sillerstrom E, Wahlund E. Effect of tigecycline on normal oropharyngeal and intestinal microflora. Antimicrob Agents Chemother. 2006;50(10):3375-80. PubMed PMID: 17005820. PubMed Central PMCID: 1610089. doi: 10.1128/AAC.00373-06
5. Baines SD, Saxton K, Freeman J, Wilcox MH. Tigecycline does not induce proliferation or cytotoxin production by epidemic Clostridium difficile strains in a human gut model. J Antimicrob Chemother. 2006;58(5):1062-5. PubMed PMID: 17030519. doi: 10.1093/jac/dkl364
6. Jump RL, Li Y, Pultz MJ, Kypriotakis G, Donskey CJ. Tigecycline exhibits inhibitory activity against Clostridium difficile in the colon of mice and does not promote growth or toxin production. Antimicrob Agents Chemother. 2011;55(2):546-9. PubMed PMID: 21135181. PubMed Central PMCID: 3028805. doi: 10.1128/AAC.00839-10
7. Bassis CM, Theriot CM, Young VB. Alteration of the murine gastrointestinal microbiota by tigecycline leads to increased susceptibility to Clostridium difficile infection. Antimicrob Agents Chemother. 2014;58(5):2767-74. PubMed PMID: 24590475. PubMed Central PMCID: 3993203. doi: 10.1128/AAC.02262-13
8. Theriot CM, Schumacher CA, Bassis CM, Seekatz AM, Young VB. Effects of tigecycline and vancomycin administration on established Clostridium difficile infection. Antimicrob Agents Chemother. 2015;59(3):1596-604. PubMed PMID: 25547352. PubMed Central PMCID: 4325817. doi: 10.1128/AAC.04296-14
9. Jump RL, Polinkovsky A, Hurless K, Sitzlar B, Eckart K, Tomas M, Deshpande A, Nerandzic MM, Donskey CJ. Metabolomics analysis identifies intestinal microbiota-derived biomarkers of colonization resistance in clindamycin-treated mice. PLOS ONE. 2014;9(7):e101267. PubMed PMID: 24988418. PubMed Central PMCID: 4079339. doi: 10.1371/journal.pone.0101267
10. Blaut M, Clavel T. Metabolic diversity of the intestinal microbiota: implications for health and disease. J Nutr. 2007;137(3 Suppl 2):751S-5S. PubMed PMID: 17311972.
11. Nerandzic MM, Donskey CJ. Effective and reduced-cost modified selective medium for isolation of Clostridium difficile. J Clin Microbiol. 2009;47(2):397-400. PubMed PMID: 19073869. PubMed Central PMCID: 2643678. doi: 10.1128/JCM.01591-08
12. Evans AM, DeHaven CD, Barrett T, Mitchell M, Milgram E. Integrated, nontargeted ultrahigh performance liquid chromatography/electrospray ionization tandem mass spectrometry platform for the identification and relative quantification of the small-molecule complement of biological systems. Anal Chem. 2009;81(16):6656-67. PubMed PMID: 19624122. doi: 10.1021/ac901536h
13. Dehaven CD, Evans AM, Dai H, Lawton KA. Organization of GC/MS and LC/MS metabolomics data into chemical libraries. J Cheminform. 2010;2(1):9. PubMed PMID: 20955607. PubMed Central PMCID: 2984397. doi: 10.1186/1758-2946-2-9
14. Kanehisa M, Goto S, Furumichi M, Tanabe M, Hirakawa M. KEGG for representation and analysis of molecular networks involving diseases and drugs. Nucleic Acids Res. 2010;38(Database issue):D355-60. PubMed PMID: 19880382. PubMed Central PMCID: 2808910. doi: 10.1093/nar/gkp896
15. Wishart DS, Jewison T, Guo AC, Wilson M, Knox C, Liu Y, Djoumbou Y, Mandal R, Aziat F, Dong E, Bouatra S, Sinelnikov I, Arndt D, Xia J, Liu P, Yallou F, Bjorndahl T, Perez-Pineiro R, Eisner R, Allen F, Neveu V, Greiner R, Scalbert A. HMDB 3.0—The Human Metabolome Database in 2013. Nucleic Acids Res. 2013;41(Database issue):D801-7. PubMed PMID: 23161693. PubMed Central PMCID: 3531200. doi: 10.1093/nar/gks1065
16. Yap IK, Li JV, Saric J, Martin FP, Davies H, Wang Y, Wilson ID, Nicholson JK, Utzinger J, Marchesi JR, Holmes E. Metabonomic and microbiological analysis of the dynamic effect of vancomycin-induced gut microbiota modification in the mouse. J Proteome Res. 2008;7(9):3718-28. PubMed PMID: 18698804. doi: 10.1021/pr700864x
17. Romick-Rosendale LE, Goodpaster AM, Hanwright PJ, Patel NB, Wheeler ET, Chona DL, Kennedy MA. NMR-based metabonomics analysis of mouse urine and fecal extracts following oral treatment with the broad-spectrum antibiotic enrofloxacin (Baytril). Magn Reson Chem. 2009;47 Suppl 1:S36-46. PubMed PMID: 19768747. doi: 10.1002/mrc.2511
18. Swann JR, Tuohy KM, Lindfors P, Brown DT, Gibson GR, Wilson ID, Sidaway J, Nicholson JK, Holmes E. Variation in antibiotic-induced microbial recolonization impacts on the host metabolic phenotypes of rats. J Proteome Res. 2011;10(8):3590-603. PubMed PMID: 21591676. doi: 10.1021/pr200243t
19. Lawley TD, Clare S, Walker AW, Stares MD, Connor TR, Raisen C, Goulding D, Rad R, Schreiber F, Brandt C, Deakin LJ, Pickard DJ, Duncan SH, Flint HJ, Clark TG, Parkhill J, Dougan G. Targeted restoration of the intestinal microbiota with a simple, defined bacteriotherapy resolves relapsing Clostridium difficile disease in mice. PLOS Pathog. 2012;8(10):e1002995. PubMed PMID: 23133377. PubMed Central PMCID: 3486913. doi: 10.1371/journal.ppat.1002995
20. Theriot CM, Koenigsknecht MJ, Carlson PE, Jr, Hatton GE, Nelson AM, Li B, Huffnagle GB, J ZL, Young VB. Antibiotic-induced shifts in the mouse gut microbiome and metabolome increase susceptibility to Clostridium difficile infection. Nat Commun. 2014;5:3114. PubMed PMID: 24445449. PubMed Central PMCID: 3950275. doi: 10.1038/ncomms4114
21. Ng KM, Ferreyra JA, Higginbottom SK, Lynch JB, Kashyap PC, Gopinath S, Naidu N, Choudhury B, Weimer BC, Monack DM, Sonnenburg JL. Microbiota-liberated host sugars facilitate post-antibiotic expansion of enteric pathogens. Nature. 2013;502(7469):96-9. PubMed PMID: 23995682. PubMed Central PMCID: 3825626. doi: 10.1038/nature12503
22. Theriot CM, Bowman AA, Young VB. Antibiotic-Induced Alterations of the Gut Microbiota Alter Secondary Bile Acid Production and Allow for Clostridium difficile Spore Germination and Outgrowth in the Large Intestine. mSphere. 2016;1(1). PubMed PMID: 27239562. PubMed Central PMCID: 4863611. doi: 10.1128/mSphere.00045-15
23. Buffie CG, Bucci V, Stein RR, McKenney PT, Ling L, Gobourne A, No D, Liu H, Kinnebrew M, Viale A, Littmann E, van den Brink MR, Jenq RR, Taur Y, Sander C, Cross JR, Toussaint NC, Xavier JB, Pamer EG. Precision microbiome reconstitution restores bile acid mediated resistance to Clostridium difficile. Nature. 2015;517(7533):205-8. PubMed PMID: 25337874. PubMed Central PMCID: 4354891. doi: 10.1038/nature13828