David C. Samuels1, Asha R. Kallianpur2, Ronald J. Ellis3, William S. Bush4, Scott Letendre3, Donald Franklin3, Igor Grant3, Todd Hulgan5
Background: Mitochondrial DNA (mtDNA) haplogroups are ancestry-related patterns of single-nucleotide polymorphisms that are associated with differential mitochondrial function in model systems, neurodegenerative diseases in HIV-negative populations, and chronic complications of HIV infection, including neurocognitive impairment. We hypothesized that mtDNA haplogroups are associated with neuroinflammation in HIV-infected adults.
Methods:
CNS HIV Antiretroviral Therapy Effects Research (CHARTER) is a US-based observational study of HIV-infected adults
who underwent standardized neurocognitive assessments. Participants who
consented to DNA collection underwent whole blood mtDNA sequencing, and a
subset also underwent lumbar puncture. IL-6, IL-8, TNF-
Results:
In analyses stratified by the 3 continental ancestry groups, no haplogroups
were significantly associated with the 4 biomarkers. In the subgroup of
participants with undetectable plasma HIV RNA on ART, European haplogroup H
participants had significantly lower CSF TNF-
Conclusions:
Lower CSF TNF-
Keywords: HIV; Mitochondrial DNA, Tumor Necrosis Factor-alpha, Interleukin-6, Interleukin-8, Inflammation, Cerebral Spinal Fluid, Cytokines, Mitochondrial Haplogroups, Neuroinflammation
Central nervous system (CNS) immune surveillance is dysregulated in many neurodegenerative disorders, including HIV-associated neurocognitive disorder (HAND) [1-3]. Monocyte recruitment across the blood–brain barrier to the CNS is integral to this process. HIV infection of the CNS occurs soon after transmission, resulting in activation of monocytes and glial cells, and their ongoing recruitment to the CNS [4-6]. In addition to blood–brain barrier disruption, release of neurotoxic viral proteins (eg, HIV gp120, Tat, and Nef) from HIV-infected cells causes direct synaptodendritic damage, which is characteristic of HAND in the modern combination antiretroviral therapy (ART) era [7]. Ongoing neuronal injury due to persistent CNS inflammation and oxidative stress may promote HAND in the setting of HIV infection, despite effective viral suppression with ART [8, 9].
Cerebrospinal fluid (CSF) biomarkers are acceptable, albeit imperfect,
surrogates for inflammation in brain tissue, and studies have reported
pro-inflammatory cytokine and chemokine abnormalities in the CSF of
HIV-infected adults even after ART initiation [10, 11]. Many cytokines are markers of monocyte and microglial activation [12-15]. Tumor necrosis factor alpha (TNF-
Neurocognitive impairment and neuroinflammation are complex phenotypes and endophenotypes, respectively, in HIV-infected populations. Host genetic variants likely contribute to differences in phenotype expression and to relationships between endophenotypes and phenotypes. Monocytes/macrophages and lymphocytes that migrate into the CNS are major sources of inflammatory cytokines and chemokines during HIV infection, and these cells depend heavily on oxidative phosphorylation [21], a key mitochondrial function.
Patterns of variations in mitochondrial DNA (mtDNA) are used to define mitochondrial haplogroups, which have been shown to affect a range of HIV disease characteristics (for a review see [22]), including those potentially related to inflammation. In vitro studies have shown that European mitochondrial haplogroups differ in expression [23,24] and methylation [25] of inflammation–pathway genes. A recent study from our group has reported significant associations between mitochondrial haplogroups and neurocognitive impairment in HIV-infected individual [26]. In this analysis, we explore the contribution of mtDNA haplogroups to inter-individual variability in CSF cytokine and chemokine levels as biomarkers of inflammation in the CNS. These CSF biomarkers have been previously linked to development of HAND [27, 28]. We therefore hypothesized that mtDNA haplogroups may be associated with differences in CSF inflammation, and performed planned subgroup analyses of haplogroups and CSF cytokine levels to explore these associations.
Table 1. Demographics of covariates for the 3 populations in the study.
|
|
|
|
|
|
|
|
Total N |
384 |
174 |
167 |
43 |
na |
|
Male |
300 (78%) |
144 (83%) |
120 (72%) |
36 (84%) |
0.31 |
|
Median Age [IQR], years |
43 [39–48] |
44 [39–50] |
43 [39–48] |
40 [34–46] |
EA vs. AA 0.16 EA vs. HA 0.0036 AA vs. HA 0.033 |
|
Contributing Comorbidity |
131 |
52 (30%) |
61 (37%) |
18 (42%) |
0.23 |
|
Median Nadir CD4 [IQR] |
175 [52–308] |
181 [74–330] |
175 [35–283] |
107 [52–240] |
EA vs. AA 0.09 EA vs. HA 0.14 AA vs. HA 0.83 |
|
On ART |
283 (74%) |
132 (76%) |
118 (71%) |
33 (76%) |
0.49 |
|
Plasma HIV RNA ≤ 50 copies/mL |
179 (47%) |
90 (52%) |
69 (41%) |
20 (47%) |
0.16 |
|
CSF HIV RNA ≤ 50 copies/mL |
266 (69%) |
131 (75%) |
107 (64%) |
28 (65%) |
0.07 |
a Counts tested by 2 × 3 chi-square test; medians tested by Wilcoxon.
CHARTER is a prospective, observational study of central and peripheral nervous system complications of HIV infection and treatment conducted at 6 US locations: Baltimore, Maryland; New York, New York; San Diego, California; Galveston, Texas; Seattle, Washington; and St. Louis, Missouri. Institutional review boards at each site approved the study, and each participant provided written informed consent. Data were collected between 2003 and 2007 according to a protocol of comprehensive neuromedical, neurobehavioral, and laboratory assessments that were standardized across sites [29]. The results reported herein are from a cross-sectional genetic association analysis of a subgroup of participants within CHARTER who underwent genetic studies and lumbar puncture for CSF sampling. All data utilized for these analyses were anonymized and de-identified.
As described previously [29], HAND categorization in CHARTER required a determination that neurocognitive and functional impairment were likely due to HIV-related effects on the brain rather than comorbid conditions. Detailed reviews by 2 senior CHARTER investigators, using published guidelines [30], provided categorization of comorbid conditions for all CHARTER participants as minimal, contributing, or confounding. Several conditions (eg, brain trauma, epilepsy, or other seizure history, CNS opportunistic diseases) informed this categorization; detailed information on their frequencies are presented elsewhere [29]. Individuals with confounding neurocognitive comorbidities (15% of the total CHARTER cohort), which by definition precluded an assessment of the contribution of HIV infection to their neurocognitive performance, were not eligible for a diagnosis of HAND according to Frascati criteria [29, 30]. Participants with confounding comorbidities were thus excluded from genetic analyses and hence from the present study. Though these analyses focused on neuroinflammatory biomarker endophenotypes rather than neurocognitive phenotypes, we elected to stratify analyses by minimal and contributing comorbidity status based on the possible contribution of these comorbidities (eg, diabetes, vascular disease, hepatitis C virus infection) to CSF biomarkers [31].
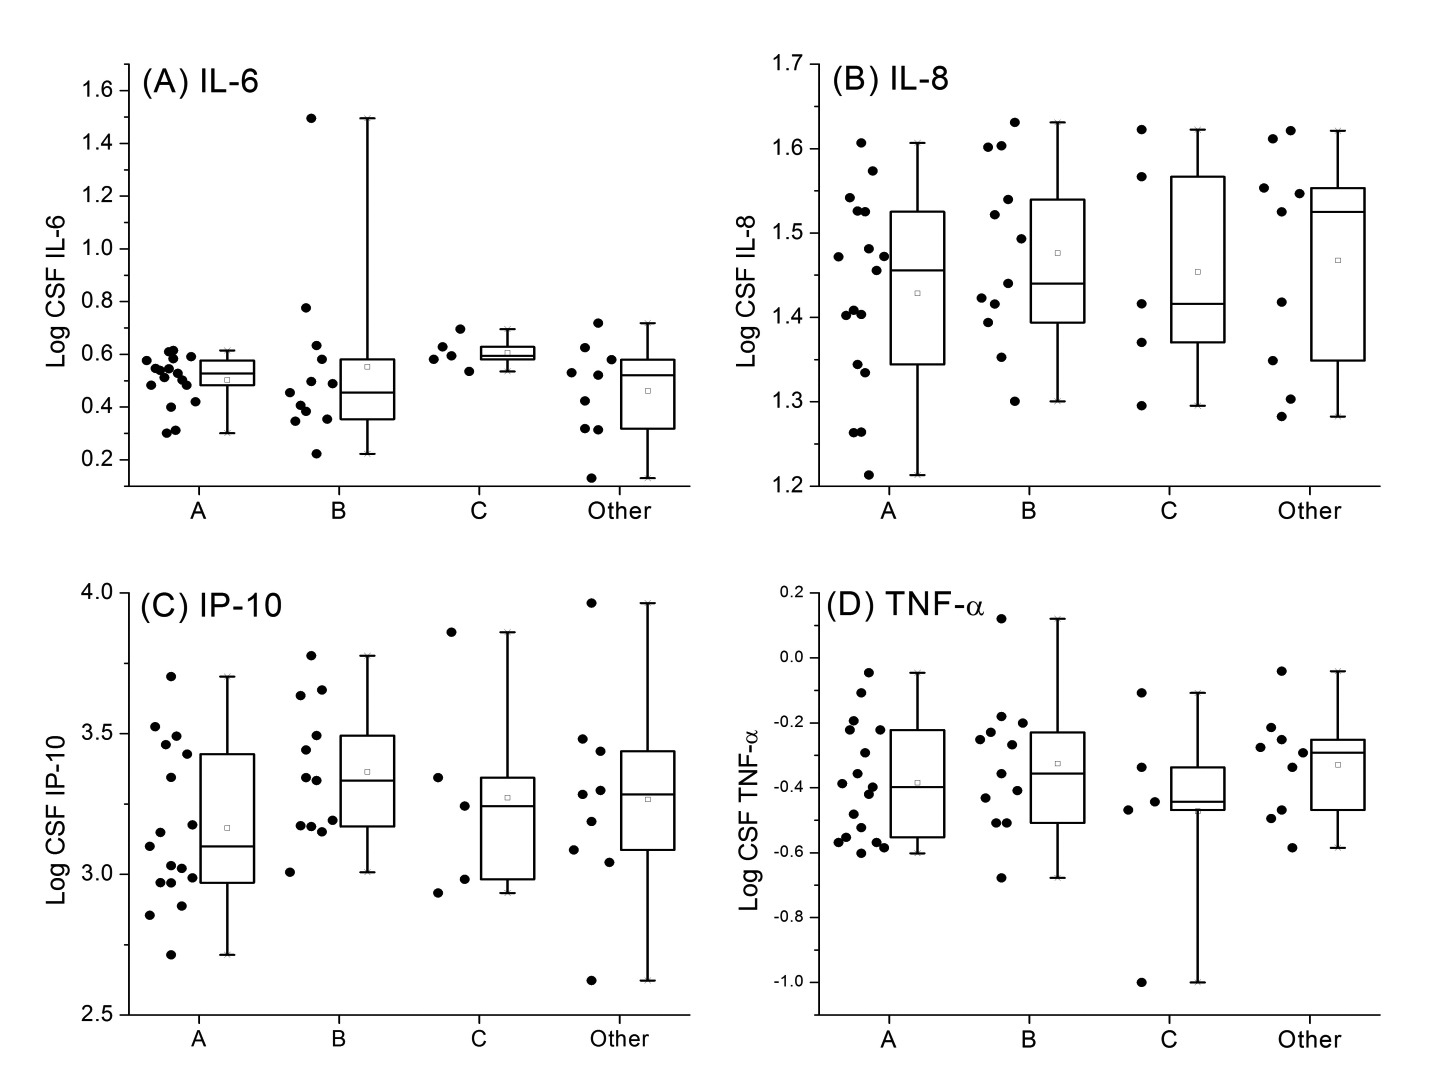
Samples of CSF collected at entry from CHARTER participants were assayed
for 4 cytokines: interleukin 6 (IL-6), interleukin 8 (IL-8), IP-10, and
TNF-
Isolation of DNA from whole blood samples was performed using PUREGENE (Gentra Systems Inc., Minneapolis, Minnesota). Full mtDNA sequencing was performed using the GeneChip Human Mitochondrial Resequencing Array 2.0 (Affymetrix, Inc., Santa Clara, California). Array intensity data were processed using the MitoChip Filtering Protocol (MFP) [32], variants were called relative to the revised Cambridge Reference Sequence (rCRS) [33], and haplogroups were assigned using the HaploGrep program (http://haplogrep.uibk.ac.at/) [34]. All participants also had nuclear DNA genotyping available using the Affymetrix Genome-Wide Human SNP Array 6.0 (Affymetrix, Inc., Santa Clara, California). Ancestry-informative markers were extracted from the autosomal DNA genotypes and were analyzed using EIGENSTRAT software [35] to generate principal components (PC). Clustering of PCs was used to define 3 common ancestry groups classified as European ancestry (EA), African ancestry (AA), and Hispanic ancestry (HA). Details of the clustering process are reported elsewhere [26]. Since mitochondrial haplogroups are closely related to continental ancestry [36], the analysis was stratified by the ancestry groups EA, AA, and HA.
Statistical tests included linear regressions of log-normalized cytokine
levels. Participants were stratified into three groups based on PC-defined
ancestry, as described previously. Within each common ancestry group,
participants were assigned to the major mtDNA haplogroups, and statistical
tests were carried out by comparing members of one haplogroup to all other
members of that ancestral group (for example, haplogroup H vs. all other
European ancestry participants). Regressions included the following
covariates: sex, age (in years), dichotomized CSF HIV RNA load (≤ 50
copies/mL vs. > 50 copies/mL), whether participants were on ART, nadir
CD4+ T-cell count as a continuous variable, and comorbidity classified as
minimal to neurocognitive impairment or likely to contribute to but not
confound the diagnosis of HAND (minimal vs. contributing) [29, 30]. Coding of dichotomous covariates used in the regressions is given in
Supplemental Table 1. Outlier values were retained in the analysis, except
in a sensitivity analysis described in the Results, in which outliers for
IL-8 and TNF-
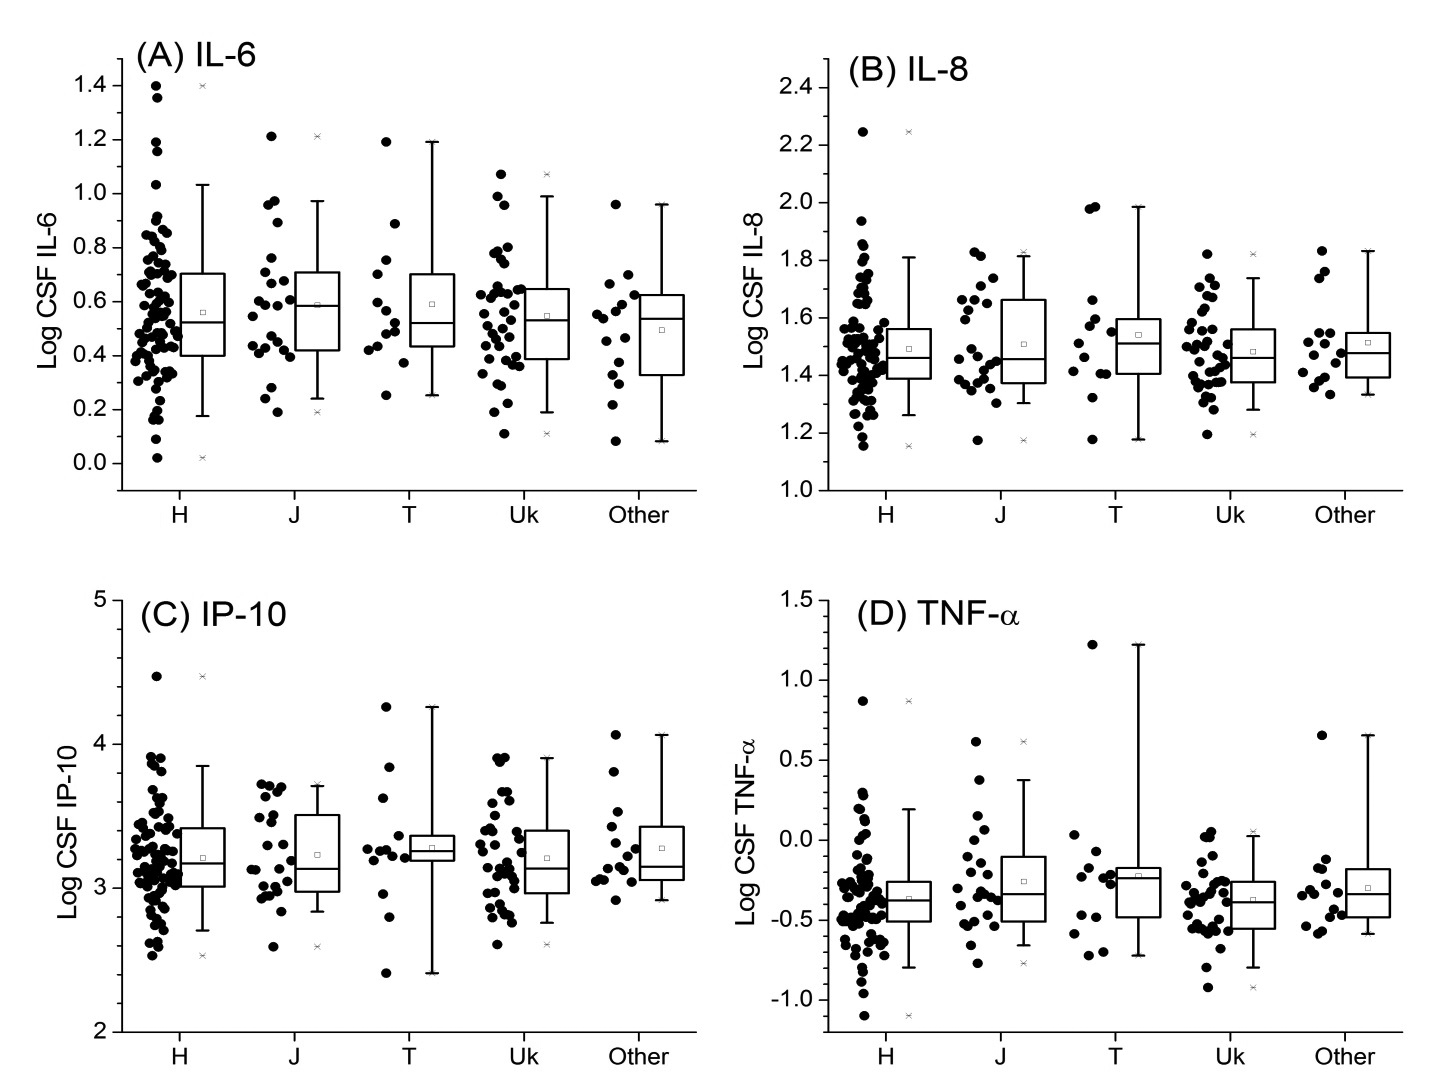
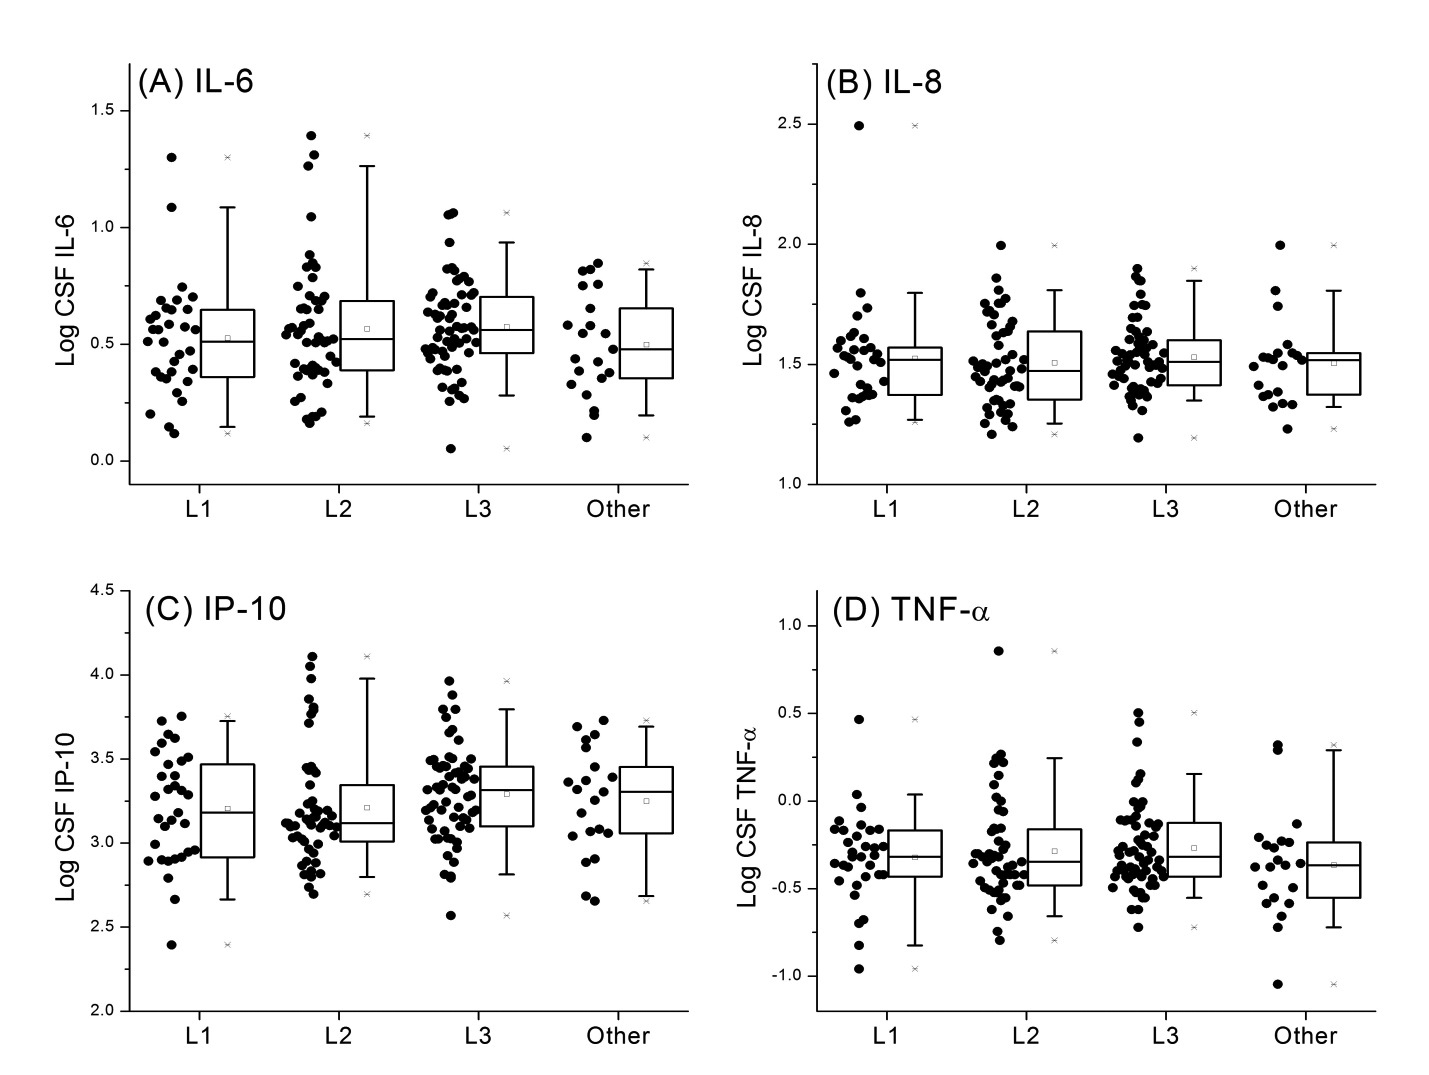
A total of 384 participants had genetic data and CSF samples (Table 1); 45% were of European ancestry, 43% African ancestry, and 11% Hispanic ancestry. A majority (78%) were male, median age was 43 years, 74% were on ART at the time that CSF samples were collected, and 47% and 69% had plasma and CSF HIV RNA ≤ 50 copies/mL, respectively. Measured CSF cytokine levels are shown in Supplemental Figures 1–3 for the major mtDNA haplogroups within each of the 3 ancestral groups. Analyses included the major European haplogroups H, J, T, and Uk in participants of European ancestry (N = 174); African haplogroups L1, L2, and L3 in participants of African ancestry (N = 167); and for the Asian/Native American haplogroups, A and B in participants of Hispanic ancestry (N = 43). Linear regressions for the log-normalized CSF cytokine levels were calculated for each tested mtDNA haplogroup, adjusting for clinical and demographic covariates as described in the Methods section. None of the tested mtDNA haplogroups were significantly associated with the 4 measured CSF cytokine levels.
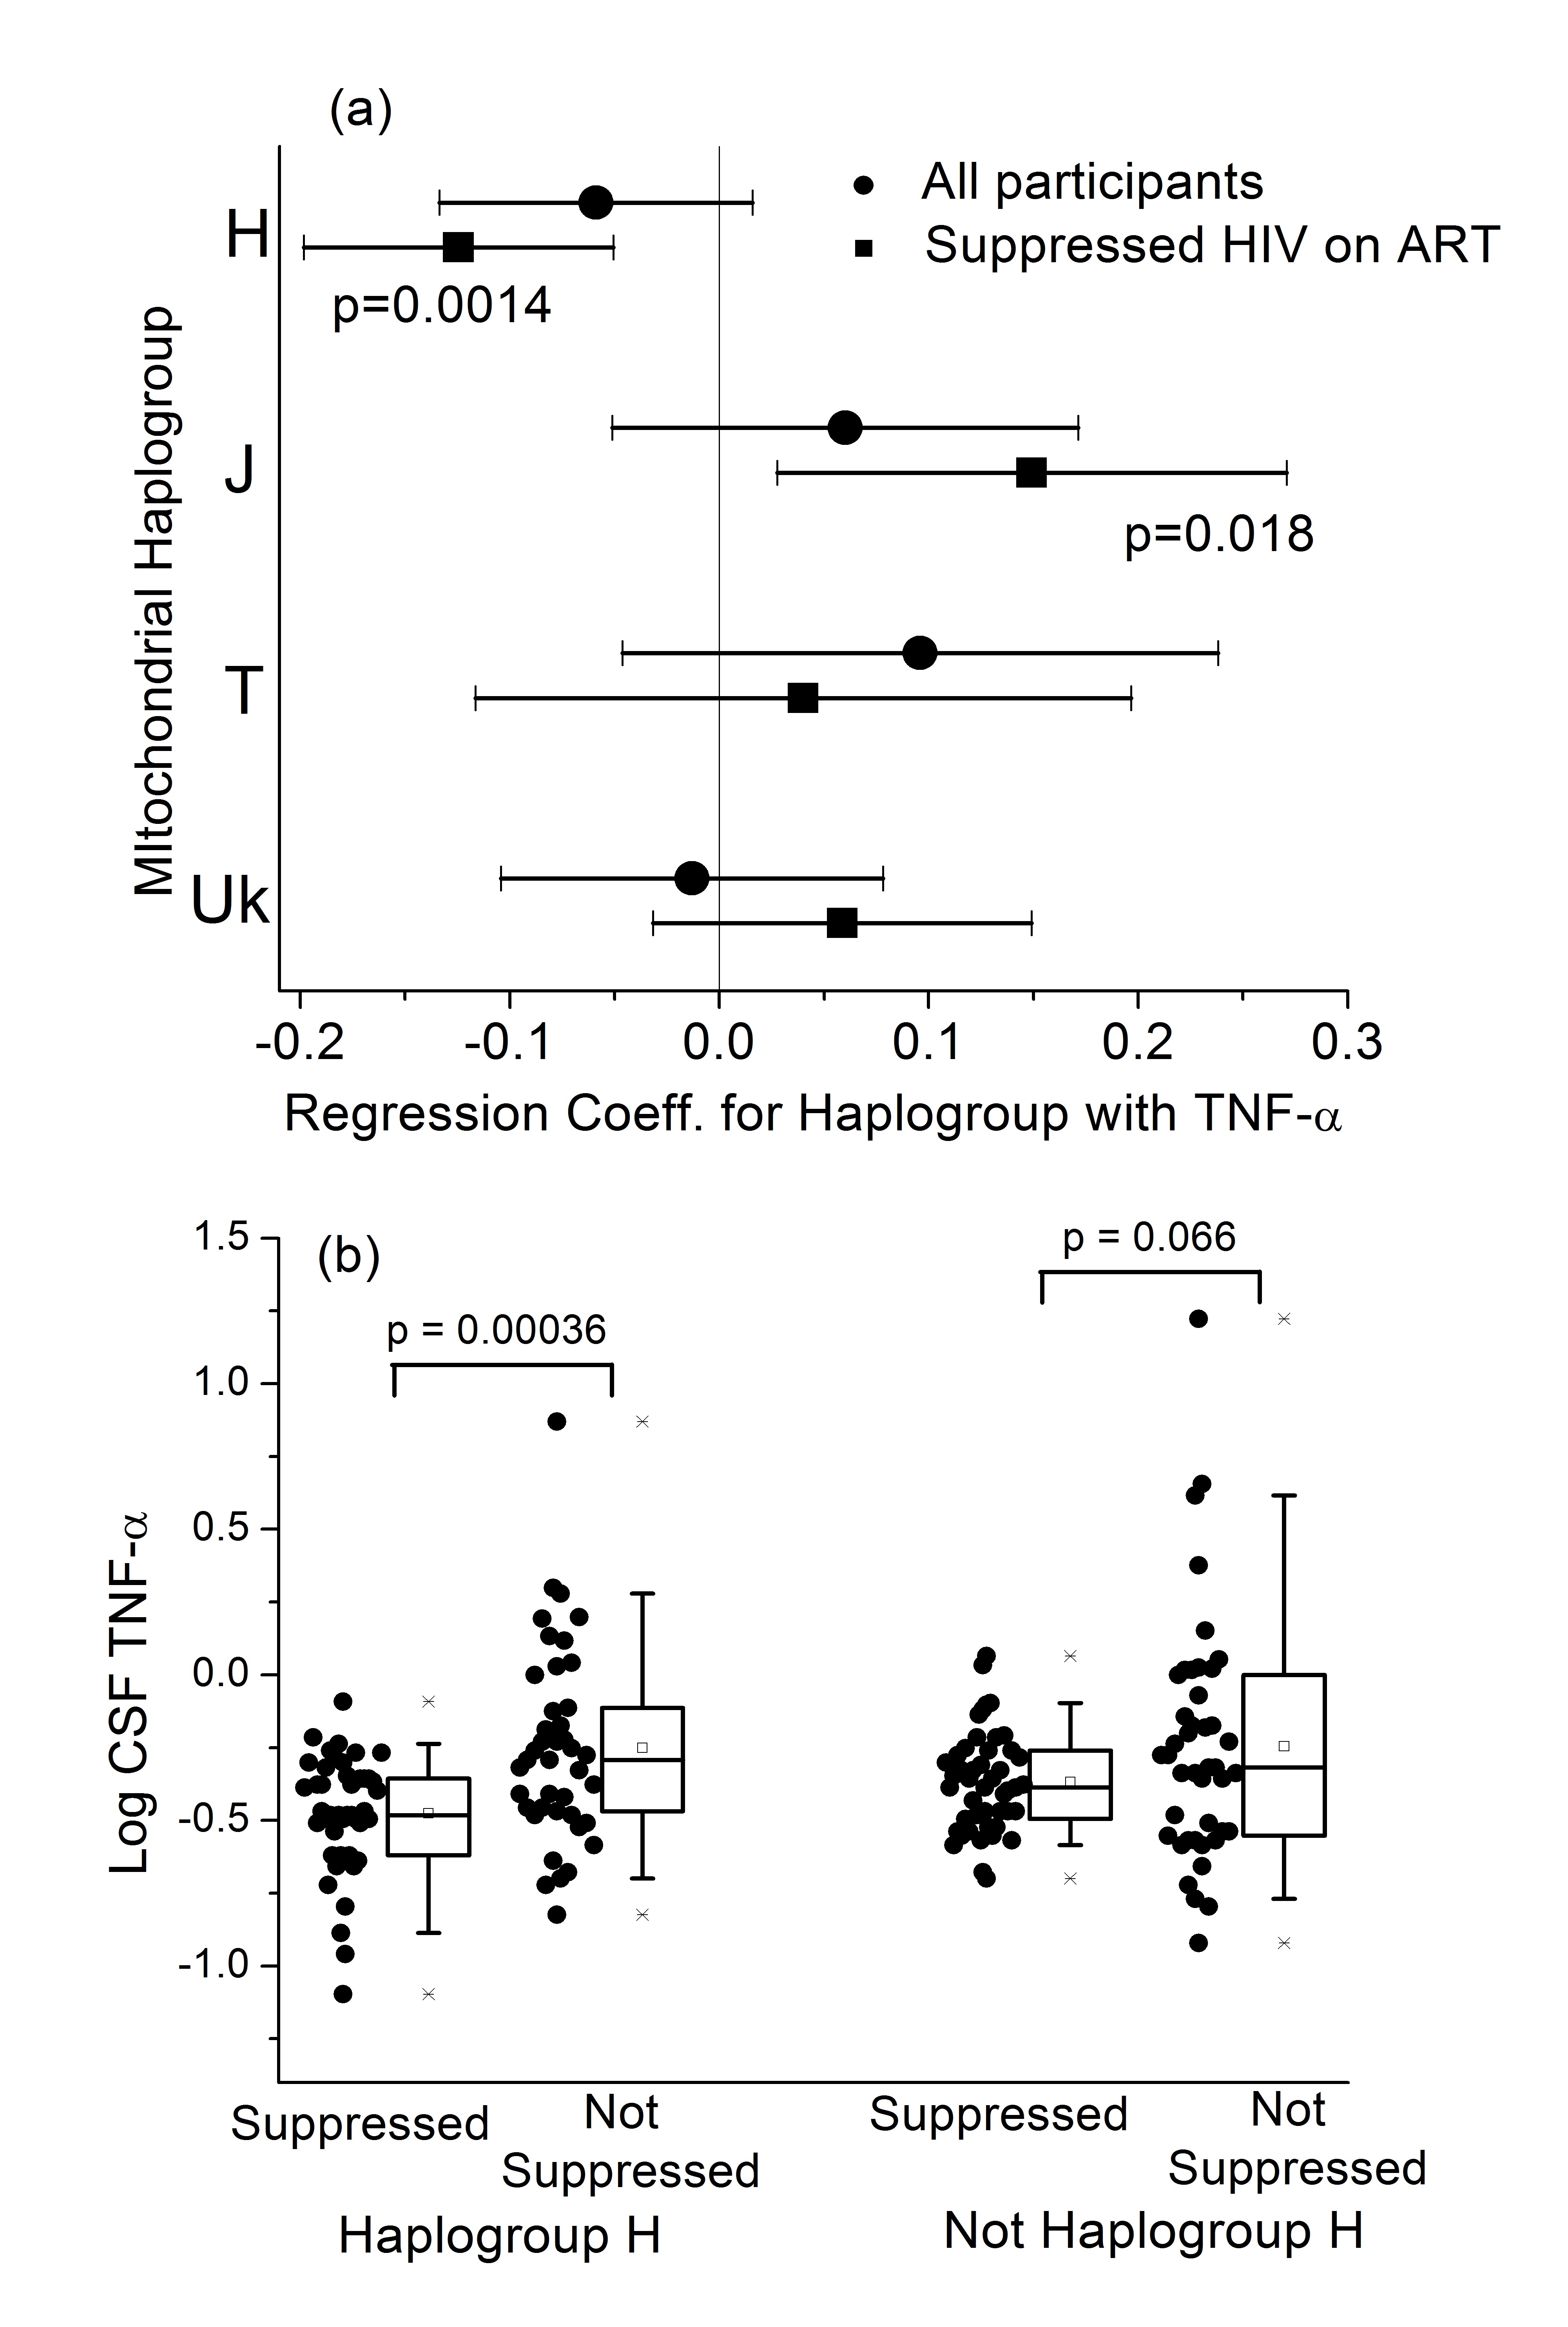
Analyses were then restricted to participants on ART with plasma HIV RNA
level ≤ 50 copies/mL (denoted as suppressed HIV on ART; Supplemental Tables
2–4). A small number of participants (3 of European ancestry and 2 of
African ancestry) had detectable HIV RNA in their CSF though their HIV RNA
in plasma was undetectable. These participants were retained in the
analysis, and adjustment for detectable CSF HIV RNA was included in the
analysis. Linear regression was carried out with the covariates described
in Methods, with the exception of on/off ART, which was removed from the
analysis. There were no significant associations of any of the 4 measured
CSF cytokines with mitochondrial haplogroup in participants of African or
Hispanic ancestry. In participants of European ancestry, the common
haplogroup H had significantly lower CSF TNF- a levels (P = 0.001,
Table 2, Figure 1A). For comparison, the results of this adjusted
regression in the full Caucasian cohort are given in Supplemental Table 6.
The lower CSF TNF-
Table 2.
Multivariate linear regression results for log CSF TNF-
|
|
|
|
|
|
Haplogroup H vs All Others |
−0.12 |
0.04 |
0.0014 |
|
Sex |
0.055 |
0.057 |
0.33 |
|
Age (per year) |
0.0057 |
0.0024 |
0.019 |
|
CSF HIV RNA Load ≤ 50 copies/mL |
−0.26 |
0.10 |
0.016 |
|
Nadir CD4+ T Cell Count (per cell/mm3) |
−0.00015 |
0.00011 |
0.17 |
|
Comorbidity Status (Minimal vs. Contributing) |
0.049 |
0.040 |
0.22 |
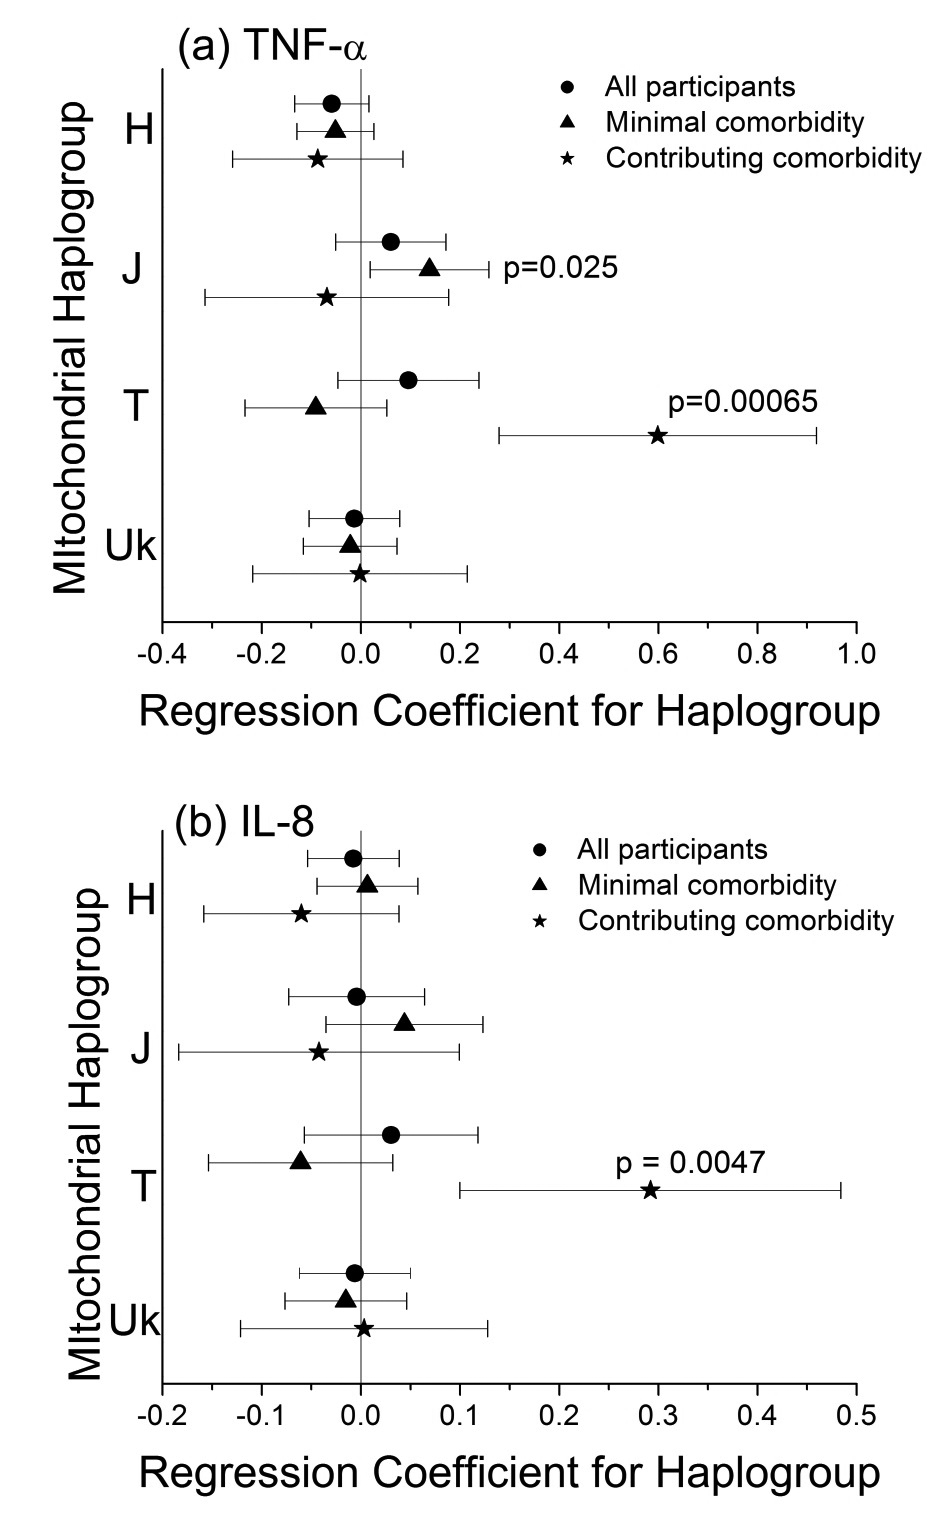
The CSF TNF-
Haplogroup J participants had higher TNF-
Table 3.
Multivariate linear regression results for log CSF TNF-
|
|
|
|
|
|
Haplogroup J vs. All Others |
0.15 |
0.06 |
0.018 |
|
Sex |
0.058 |
0.059 |
0.32 |
|
Age (per year) |
0.0068 |
0.0025 |
0.0082 |
|
CSF HIV RNA load ≤ 50 copies/mL |
−0.26 |
0.11 |
0.019 |
|
Nadir CD4+ T Cell Count (per cell/mm3) |
−0.00011 |
0.00011 |
0.30 |
|
Comorbidity Status (Minimal vs. Contributing) |
0.032 |
0.041 |
0.43 |
We then stratified the analysis by the type of comorbidities present (ie,
comorbid conditions deemed to be either minimal or contributing to
neurocognitive deficits). The definitions of the minimal and contributing
classification of comorbidities are given in the Participants section of
the Methods previously mentioned, and references are cited there. Briefly,
“minimal” and “contributing” comorbidities were those considered unlikely
or possibly (respectively) to affect neurocognitive function. Linear
regression was carried out using the covariates listed previously, with the
exception of the comorbidity variable, which was removed. Again, no
significant associations of mitochondrial haplogroup with the 4 cytokines
emerged in African or Hispanic ancestry groups. In European ancestry
participants with minimal comorbidities, haplogroup J participants had
significantly higher TNF-
In this analysis of HIV-infected adults in CHARTER, we observed ancestry-specific associations between mtDNA haplogroups and biomarkers of inflammation in CSF. These associations were independent of sex and age but were influenced by ART and HIV suppression, as well as comorbidities that may influence neurocognitive performance. To our knowledge, these are the first data to address this question.
Mitochondrial haplogroups are defined by patterns of variations in mtDNA
that have accumulated over the past ~200,000 years [37]. Differences in fundamental functions of mitochondria across haplogroups
have been reported [24,
38]. Mitochondrial haplogroups have been associated with many disease
phenotypes [39, 40], including many phenotypes in HIV/AIDS [22]. One study [41] has shown that mitochondrial haplogroups can affect progression to AIDS.
That study reported that the subgroup H3 (along with Uk and IWX) was
significantly protective against progression to AIDS among HIV+
individuals. Although our study did not carry out any analysis at the
sub-haplogroup level, H3 is typically a major component of the H haplogroup
population, and we found that haplogroup to have lower CNS TNF-
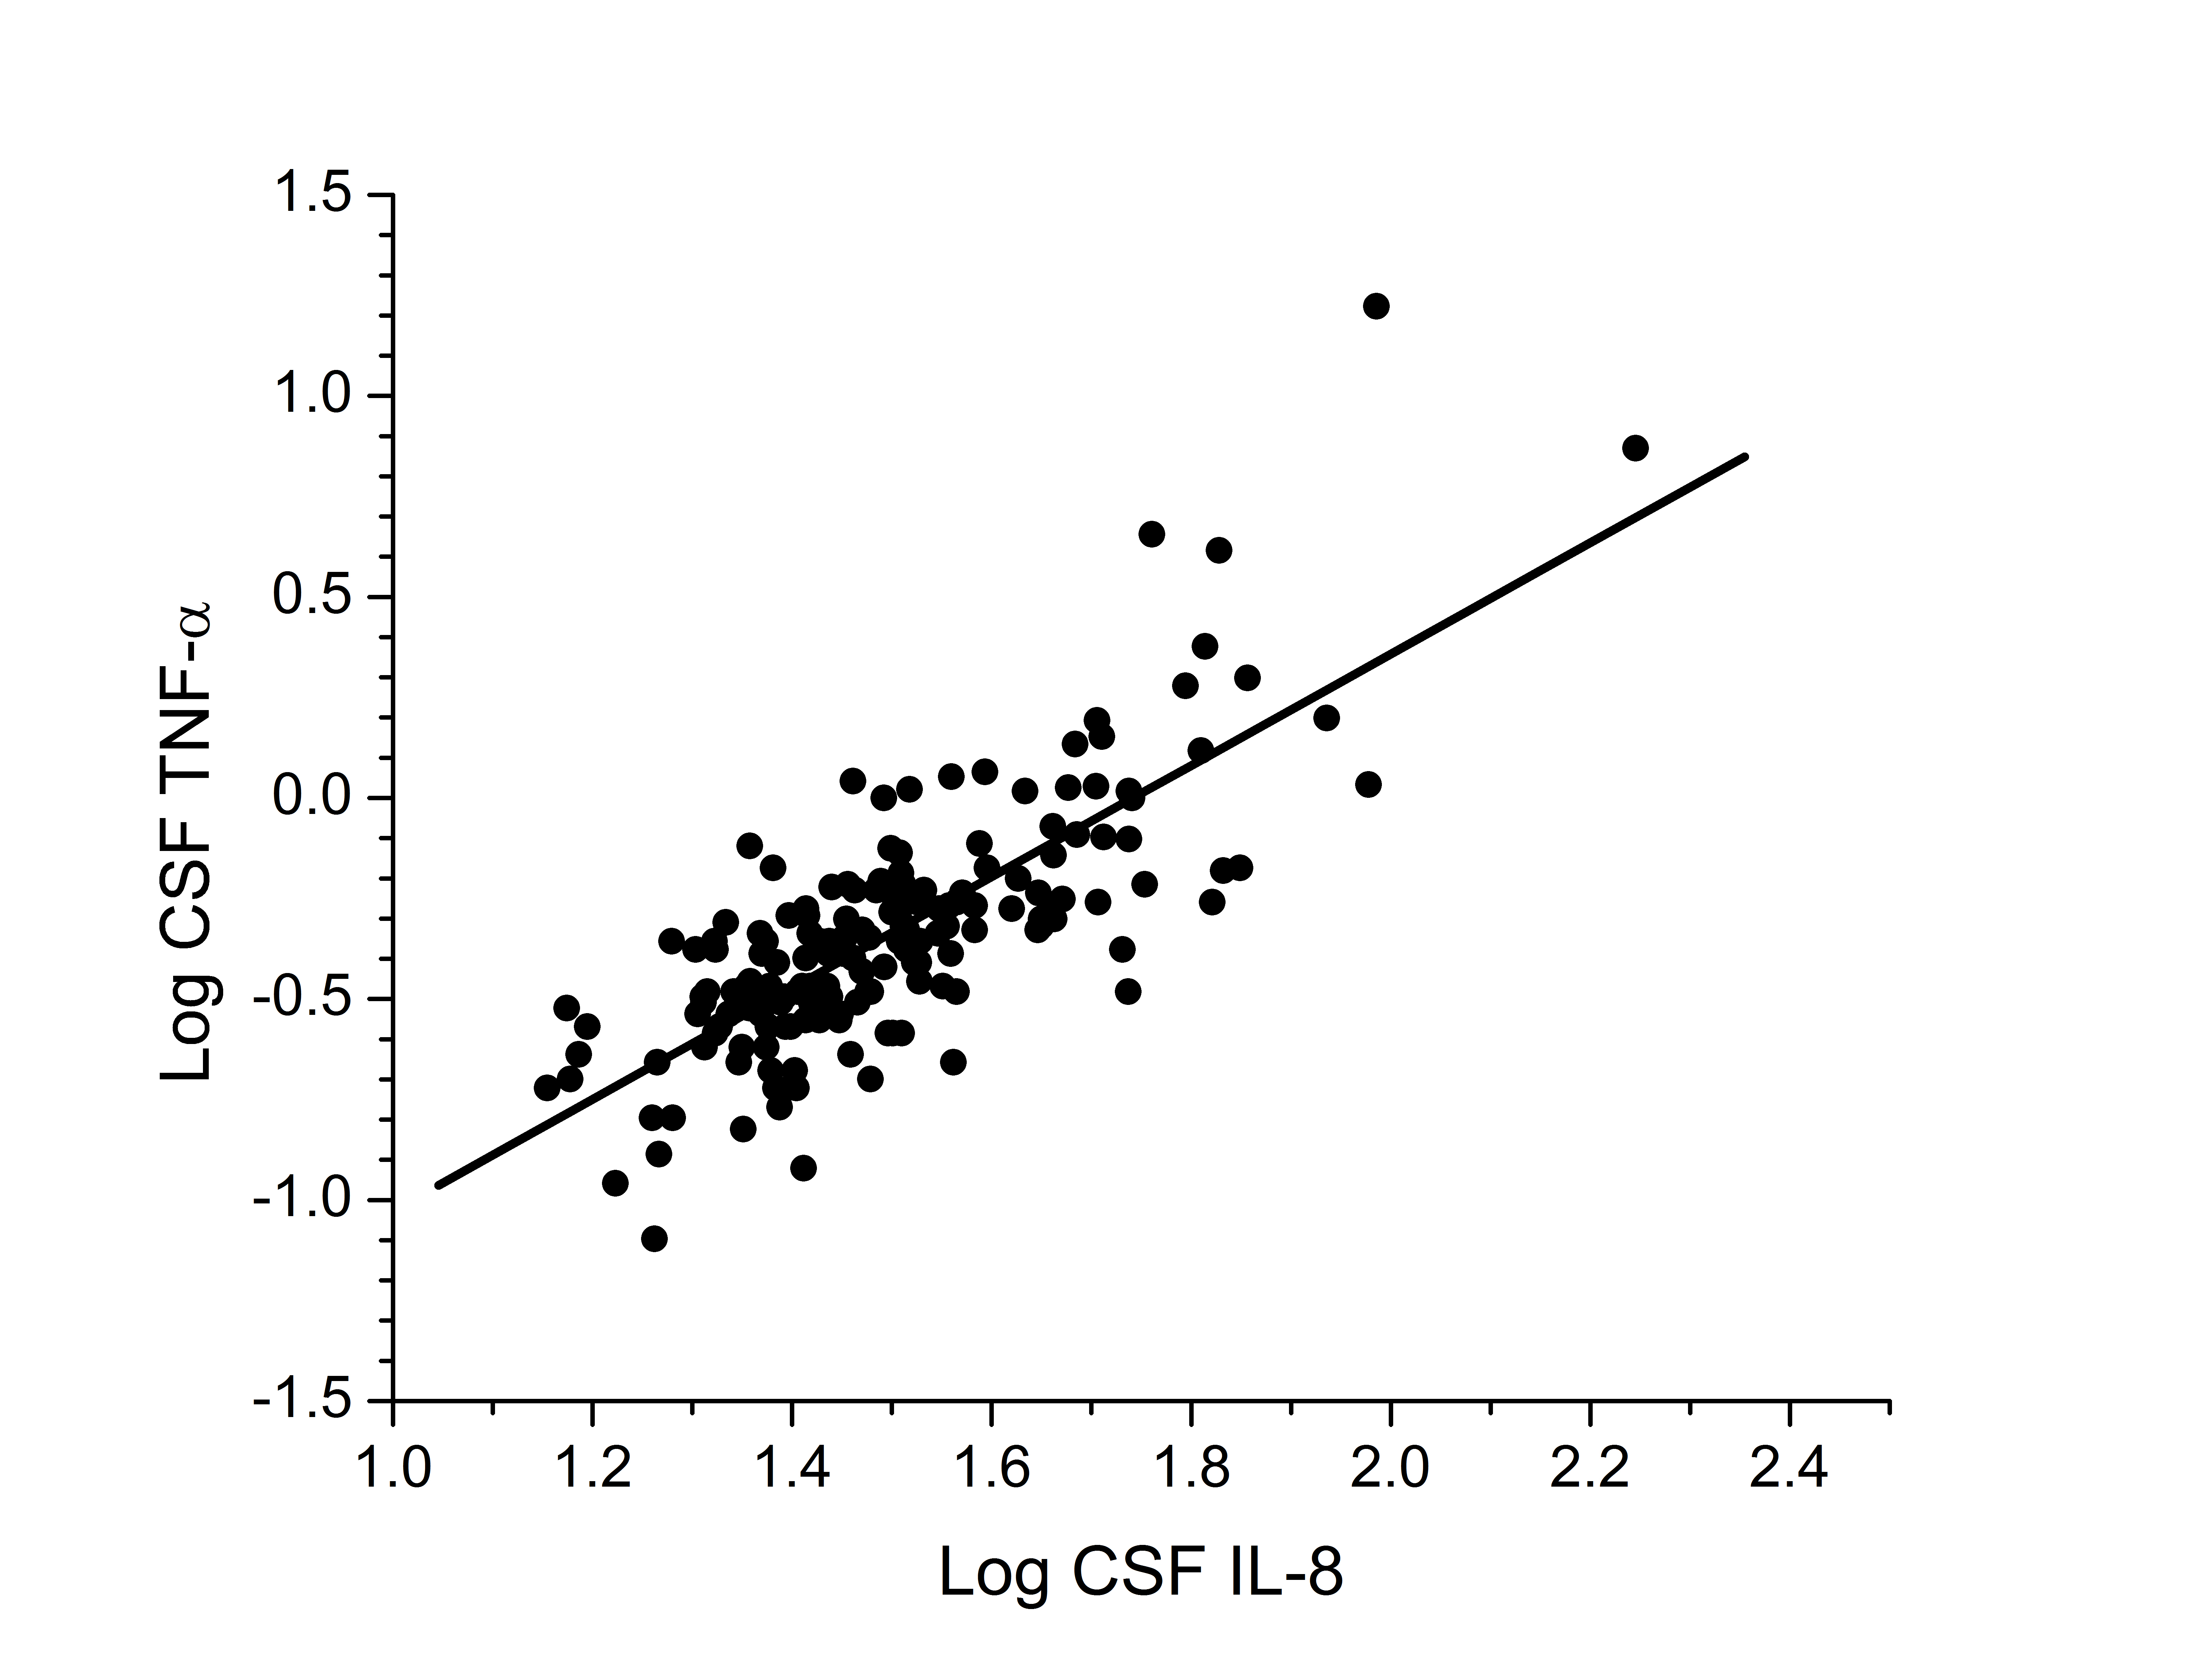
Although there are no well-established clinical biomarkers of
neuroinflammation or neurocognitive performance in the setting of HIV
disease and ART, observed associations with IL-8 and TNF-
Mitochondrial DNA variants are increasingly recognized as influencing mitochondrial function [51, 52], particularly in energetically vulnerable tissues like the CNS [53, 54]. Given the prevalence of neurodegenerative phenotypes in inherited mitochondrial diseases, the centrality of mitochondrial function in cellular energy production, oxidative stress, and apoptotic regulation, a connection between neuroinflammation and mtDNA variants is biologically plausible. In recent CHARTER analyses, we identified an association between the mtDNA haplogroup B and better neurocognitive performance among Hispanic ancestry participants [34]. We did not see differences in the measured cytokines based on mtDNA haplogroups in the Hispanic population, perhaps due to the smaller sample size in the cytokine dataset compared with the NCI analysis, or perhaps because other pathways or biomarkers are involved in these different phenotypes. The small sample size of the Hispanic population in this study (Table 1) means that no definitive conclusion can be reached in this study about the lack of association of mitochondrial haplogroups with CSF biomarker levels. Future analyses should further investigate the Hispanic population with a larger population and broader range of CSF biomarkers. Conversely, although our previous analysis did not find associations between mtDNA haplogroups and NCI or HAND in participants of European or African ancestry, we do find significant differences in the cytokine measures in the European ancestry participants.
Strengths of these analyses include batched assays on carefully collected and cryopreserved CSF, and the use of high-sensitivity assays. In addition, full mtDNA sequence data allowed for optimal haplogroup determination, and available genome-wide data provided ancestry-informative markers for genetic ancestry determination. The CHARTER cohort includes very well-characterized phenotyping using standardized neuropsychometric methods, and persons with neurologic comorbidities that could confound the interpretation of neurocognitive information were excluded from our analyses.
Limitations of this study include the relatively small sample sizes of individual mtDNA haplogroups after stratification for ancestry, comorbidity, and or ART status. Nonetheless, to our knowledge, this is the largest sample with combined CSF biomarker and mtDNA genetic data, and several potential associations remained statistically significant after applying conservative corrections for multiple statistical comparisons. Although analyses were either adjusted or stratified for potential confounding factors, the CHARTER population is heterogeneous, and there may be confounders that remain unmeasured or unaccounted for, which could have influenced the observed associations. We chose to adjust for plasma viral loads as a dichotomous variable (with a threshold at 50 copies/mL). We cannot exclude the possibility that variations in the plasma viral load above 50 copies/mL might affect our observations. With the available data from CHARTER participants and this cross-sectional analysis, we are unable to draw conclusions about causality or mechanisms.
Future studies should include prospective, targeted assessments of neuroinflammation before and after ART in persons of particular ancestry and haplogroups, and in vitro experiments in cell and or animal model systems to characterize genetic variation in neuropathogenesis. More extensive analyses of mtDNA sequence can be undertaken to determine if additional associations are seen with non-haplogroup-associated variants, or in particular mitochondrial gene regions.
The authors thank the CHARTER participants for their selfless commitment and the staff and investigators at all CHARTER sites.
The CNS HIV Anti-Retroviral Therapy Effects Research (CHARTER) group is affiliated with Johns Hopkins University in Baltimore; the Icahn School of Medicine at Mount Sinai in New York City; University of California, San Diego; University of Texas, Galveston; University of Washington, Seattle; Washington University, St. Louis; and is headquartered at the University of California, San Diego and includes: Director: Igor Grant, MD; Co-Directors: Scott L. Letendre, MD, Ronald J. Ellis, MD, PhD, Thomas D. Marcotte, PhD; Center Manager: Donald Franklin, Jr.; Neuromedical Component: Ronald J. Ellis, MD, PhD (P.I.), J. Allen McCutchan, MD; Laboratory and Virology Component: Scott Letendre, MD (Co-P.I.), Davey M. Smith, MD (Co-P.I.).; Neurobehavioral Component: Robert K. Heaton, PhD (P.I.), J. Hampton Atkinson, MD, Matthew Dawson; Imaging Component: Christine Fennema-Notestine, PhD (P.I.), Michael J. Taylor, PhD, Rebecca Theilmann, PhD; Data Management Component: Anthony C. Gamst, PhD (P.I.), Clint Cushman; Statistics Component: Ian Abramson, PhD (P.I.), Florin Vaida, PhD, Reena Deutsch, PhD; Johns Hopkins University Site: Justin McArthur (P.I.), Vincent Rogalski; Icahn School of Medicine at Mount Sinai Site: Susan Morgello, MD (Co-P.I.) and David Simpson, MD (Co-P.I.), Letty Mintz, NP; University of California, San Diego Site: J. Allen McCutchan, MD (P.I.), Kaori Phillips, BSN; University of Washington, Seattle Site: Ann Collier, MD (Co-P.I.) and Christina Marra, MD (Co-P.I.), Trudy Jones, MN, ARNP; University of Texas, Galveston Site: Benjamin Gelman, MD, PhD (P.I.), Eleanor Head, RN, BSN; and Washington University, St. Louis Site: David Clifford, MD (P.I.), Muhammad Al-Lozi, MD, Mengesha Teshome, MD.
The authors declare that they have no conflict of interest.
This work was supported by grant number R01 MH095621 from the National Institute of Mental Health/National Institutes of Health. The CNS HIV Anti-Retroviral Therapy Effects Research (CHARTER) study is also supported by awards N01 MH22005, HHSN271201000036C, and HHSN271201000030C from the National Institutes of Health.
The views expressed in this article are those of the authors and do not reflect the official policy or position of the National Institutes of Health or the US Government.
1. Grozdanov V, Bliederhaeuser C, Ruf WP, Roth V, Fundel-Clemens K, Zondler L, Brenner D, Martin-Villalba A, Hengerer B, Kassubek J, Ludolph AC, Weishaupt JH, Danzer KM. Inflammatory dysregulation of blood monocytes in Parkinson's disease patients. Acta Neuropathologica. 2014;128(5):651-63. PubMed PMID: WOS:000344058200004. doi: 10.1007/s00401-014-1345-4
2. Kaul M, Garden GA, Lipton SA. Pathways to neuronal injury and apoptosis in HIV-associated dementia. Nature. 2001;410(6831):988-94. PubMed PMID: WOS:000168152300059. doi: 10.1038/35073667
3. Zlokovic BV. The blood-brain barrier in health and chronic neurodegenerative disorders. Neuron. 2008;57(2):178-201. PubMed PMID: WOS:000252758400004. doi: 10.1016/j.neuron.2008.01.003
4. Burdo TH, Lackner A, Williams KC. Monocyte/macrophages and their role in HIV neuropathogenesis. Immunological Reviews. 2013;254:102-13. PubMed PMID: WOS:000320390900007. doi: 10.1111/imr.12068
5. Zayyad Z, Spudich S. Neuropathogenesis of HIV: From Initial Neuroinvasion to HIV-Associated Neurocognitive Disorder (HAND). Current Hiv/Aids Reports. 2015;12(1):16-24. PubMed PMID: WOS:000351307700003. doi: 10.1007/s11904-014-0255-3
6. McGuire JL, Gill AJ, Douglas SD, Kolson DL, Cns HIVA-RTE. Central and peripheral markers of neurodegeneration and monocyte activation in HIV-associated neurocognitive disorders. Journal of Neurovirology. 2015;21(4):439-48. PubMed PMID: WOS:000358336100011. doi: 10.1007/s13365-015-0333-3
7. Ellis R. HIV and antiretroviral therapy: Impact on the central nervous system. Progress in Neurobiology. 2010;91(2):185-7. PubMed PMID: WOS:000278238600010. doi: 10.1016/j.pneurobio.2009.10.016
8. Heaton RK, Franklin DR, Jr., Deutsch R, Letendre S, Ellis RJ, Casaletto K, Marquine MJ, Woods SP, Vaida F, Atkinson JH, Marcotte TD, McCutchan JA, Collier AC, Marra CM, Clifford DB, Gelman BB, Sacktor N, Morgello S, Simpson DM, Abramson I, Gamst AC, Fennema-Notestine C, Smith DM, Grant I, Grp C. Neurocognitive Change in the Era of HIV Combination Antiretroviral Therapy: The Longitudinal CHARTER Study. Clinical Infectious Diseases. 2015;60(3):473-80. PubMed PMID: WOS:000349761600028. doi: 10.1093/cid/ciu862
9. Kallianpur AR, Levine AJ. Host Genetic Factors Predisposing to HIV-Associated Neurocognitive Disorder. Current Hiv/Aids Reports. 2014;11(3):336-52. PubMed PMID: WOS:000340368500015. doi: 10.1007/s11904-014-0222-z
10. Letendre SL, Lanier ER, McCutchan JA. Cerebrospinal fluid beta chemokine concentrations in neurocognitively impaired individuals infected with human immunodeficiency virus type 1. Journal of Infectious Diseases. 1999;180(2):310-9. PubMed PMID: WOS:000081767000009. doi: 10.1086/314866
11. Peluso MJ, Meyerhoff DJ, Price RW, Peterson J, Lee E, Young AC, Walter R, Fuchs D, Brew BJ, Cinque P, Robertson K, Hagberg L, Zetterberg H, Gisslen M, Spudich S. Cerebrospinal Fluid and Neuroimaging Biomarker Abnormalities Suggest Early Neurological Injury in a Subset of Individuals During Primary HIV Infection. Journal of Infectious Diseases. 2013;207(11):1703-12. PubMed PMID: WOS:000318563200011. doi: 10.1093/infdis/jit088
12. Brew BJ, Bhalla RB, Paul M, Sidtis JJ, Kelip JJ, Sadler AE, Gallardo H, McArthur JC, Schwartz MK, Price RW. Cerebrospinal-fluid beta-2-microglobulin in patients with AIDS dementia complex - an expanded series including response to Zidovudine treatment. Aids. 1992;6(5):461-5. PubMed PMID: WOS:A1992HT19700004. 10.1097/00002030-199205000-00004
13. Brew BJ, Dunbar N, Pemberton L, Kaldor J. Predictive markers of AIDS dementia complex: CD4 cell count and cerebrospinal fluid concentrations of beta(2),-microglobulin and neopterin. Journal of Infectious Diseases. 1996;174(2):294-8. PubMed PMID: WOS:A1996UZ09300008.
14. Fuchs D, Chiodi F, Albert J, Asjo B, Hagberg L, Hausen A, Norkrans G, Reibnegger G, Werner ER, Wachter H. Neopterin concentrations in cerebrospinal-fluid and serum of individuals infected with HIV-1. Aids. 1989;3(5):285-8. PubMed PMID: WOS:A1989U853000006. doi: 10.1097/00002030-198905000-00006
15. Hagberg L, Dotevall L, Norkrans G, Larsson M, Wachter H, Fuchs D. Cerebrospinal-fluid neopterin concentrations in central-nervous-system infection. Journal of Infectious Diseases. 1993;168(5):1285-8. PubMed PMID: WOS:A1993MC89000033.
16. Sevigny JJ, Albert SM, McDermott MP, McArthur JC, Sacktor N, Conant K, Schifitto G, Selnes OA, Stern Y, McClernon DR, Palumbo D, Kieburtz K, Riggs G, Cohen B, Epstein LG, Marder K. Evaluation of HIV RNA and markers of immune activation as predictors of HIV-associated dementia. Neurology. 2004;63(11):2084-90. PubMed PMID: WOS:000225711400019.
17. Vullo V, Mastroianni CM, Lichtner M, Mengoni F, Delia S. Increased cerebrospinal-fluid levels of soluble receptors for tumor-necrosis-factor in HIV-infected patients with neurological diseases. Aids. 1995;9(9):1099-100. PubMed PMID: WOS:A1995RU01300018.
18. Woods SP, Morgan EE, Marquie-Beck J, Carey CL, Grant I, Letendre SL, Center HIVNR. Markers of macrophage activation and axonal injury are associated with prospective memory in HIV-1 disease. Cognitive and Behavioral Neurology. 2006;19(4):217-21. PubMed PMID: WOS:000243054900009. 10.1097/01.wnn.0000213916.10514.57
19. Letendre SL, Zheng JC, Kaul M, Yiannoutsos CT, Ellis RJ, Taylor MJ, Marquie-Beck J, Navia B, Consortium HIVN. Chemokines in cerebrospinal fluid correlate with cerebral metabolite patterns in HIV-infected individuals. Journal of Neurovirology. 2011;17(1):63-9. PubMed PMID: WOS:000289580200008. doi: 10.1007/s13365-010-0013-2
20. Brosseron F, Krauthausen M, Kummer M, Heneka MT. Body Fluid Cytokine Levels in Mild Cognitive Impairment and Alzheimer's Disease: a Comparative Overview. Molecular Neurobiology. 2014;50(2):534-44. PubMed PMID: WOS:000343157900022. doi: 10.1007/s12035-014-8657-1
21. Kramer PA, Ravi S, Chacko B, Johnson MS, Darley-Usmar VM. A review of the mitochondrial and glycolytic metabolism in human platelets and leukocytes:, Implications for their use as bioenergetic biomarkers. Redox Biology. 2014;2:206-10. PubMed PMID: WOS:000350769600026.
22. Hart AB, Samuels DC, Hulgan T. The Other Genome: A Systematic Review of Studies of Mitochondrial DNA Haplogroups and Outcomes of HIV Infection and Antiretroviral Therapy. Aids Reviews. 2013;15(4):213-20. PubMed PMID: WOS:000343365300003.
23. Bellizzi D, Cavalcante P, Taverna D, Rose G, Passarino G, Salvioli S, Franceschi C, De Benedictis G. Gene expression of cytokines and cytokine receptors is modulated by the common variability of the mitochondrial DNA in cybrid cell lines. Genes to Cells. 2006;11(8):883-91. PubMed PMID: WOS:000239162300004. doi: 10.1111/j.1365-2443.2006.00986.x
24. Kenney MC, Chwa M, Atilano SR, Falatoonzadeh P, Ramirez C, Malik D, Tarek M, Caceres-del-Carpio J, Nesburn AB, Boyer DS, Kuppermann BD, Vawter M, Jazwinski SM, Miceli M, Wallace DC, Udar N. Inherited mitochondrial DNA variants can affect complement, inflammation and apoptosis pathways: insights into mitochondrial-nuclear interactions. Human Molecular Genetics. 2014;23(13):3537-51. PubMed PMID: WOS:000338126300016. doi: 10.1093/hmg/ddu065
25. Atilano SR, Malik D, Chwa M, Caceres-Del-Carpio J, Nesburn AB, Boyer DS, Kuppermann BD, Jazwinski SM, Miceli MV, Wallace DC, Udar N, Kenney MC. Mitochondrial DNA variants can mediate methylation status of inflammation, angiogenesis and signaling genes. Human Molecular Genetics. 2015;24(16):4491-503. PubMed PMID: WOS:000361315400002. doi: 10.1093/hmg/ddv173
26. Hulgan T, Samuels DC, Bush W, Ellis RJ, Letendre SL, Heaton RK, Franklin DR, Straub P, Murdock DG, Clifford DB, Collier AC, Gelman BB, Marra CM, McArthur JC, McCutchan JA, Morgello S, Simpson DM, Grant I, Kallianpur AR. Mitochondrial DNA Haplogroups and Neurocognitive Impairment during HIV Infection. Clinical Infectious Diseases. 2015;61:1476-84.
27. Ellis R, Langford D, Masliah E. HIV and antiretroviral therapy in the brain: neuronal injury and repair. Nature Reviews Neuroscience. 2007;8(1):33-44. PubMed PMID: WOS:000242994200014. doi: 10.1038/nrn2040
28. Price RW, Epstein LG, Becker JT, Cinque P, Gisslen M, Pulliam L, McArthur JC. Biomarkers of HIV-1CNS infection and injury. Neurology. 2007;69(18):1781-8. PubMed PMID: WOS:000250518100008. doi: 10.1212/01.wnl.0000278457.55877.eb
29. Heaton RK, Clifford DB, Franklin DR, Woods SP, Ake C, Vaida F, Ellis RJ, Letendre SL, Marcotte TD, Atkinson JH, Rivera-Mindt M, Vigil OR, Taylor MJ, Collier AC, Marra CM, Gelman BB, McArthur JC, Morgello S, Simpson DM, McCutchan JA, Abramson I, Gamst A, Fennema-Notestine C, Jernigan TL, Wong J, Grant I, Grp C. HIV-associated neurocognitive disorders persist in the era of potent antiretroviral therapy CHARTER Study. Neurology. 2010;75(23):2087-96. PubMed PMID: WOS:000285044300011. doi: 10.1212/WNL.0b013e318200d727
30. Antinori A, Arendt G, Becker JT, Brew BJ, Byrd DA, Cherner M, Clifford DB, Cinque P, Epstein LG, Goodkin K, Gisslen M, Grant I, Heaton RK, Joseph J, Marder K, Marra CM, McArthur JC, Nunn M, Price RW, Pulliam L, Robertson KR, Sacktor N, Valcour V, Wojna VE. Updated research nosology for HIV-associated neurocognitive disorders. Neurology. 2007;69(18):1789-99. PubMed PMID: WOS:000250518100009. doi: 10.1212/01.WNL.0000287431.88658.8b
31. Heaton RK, Franklin DR, Ellis RJ, McCutchan JA, Letendre SL, LeBlanc S, Corkran SH, Duarte NA, Clifford DB, Woods SP, Collier AC, Marra CM, Morgello S, Mindt MR, Taylor MJ, Marcotte TD, Atkinson JH, Wolfson T, Gelman BB, McArthur JC, Simpson DM, Abramson I, Gamst A, Fennema-Notestine C, Jernigan TL, Wong J, Grant I, Charter, Grp H. HIV-associated neurocognitive disorders before and during the era of combination antiretroviral therapy: differences in rates, nature, and predictors. Journal of Neurovirology. 2011;17(1):3-16. PubMed PMID: WOS:000289580200002. doi: 10.1007/s13365-010-0006-1
32. Xie HBM, Perin JC, Schurr TG, Dulik MC, Zhadanov SI, Baur JA, King MP, Place E, Clarke C, Grauer M, Schug J, Santani A, Albano A, Kim C, Procaccio V, Hakonarson H, Gai XW, Falk MJ. Mitochondrial genome sequence analysis: A custom bioinformatics pipeline substantially improves Affymetrix MitoChip v2.0 call rate and accuracy. Bmc Bioinformatics. 2011;12. PubMed PMID: WOS:000297784600001.402. doi: 10.1186/1471-2105-12-402
33. Andrews RM, Kubacka I, Chinnery PF, Lightowlers RN, Turnbull DM, Howell N. Reanalysis and revision of the Cambridge reference sequence for human mitochondrial DNA. Nat Genet. 1999;23(2):147. PubMed PMID: 10508508. doi: 10.1038/13779
34. Kloss-Brandstatter A, Pacher D, Schonherr S, Weissensteiner H, Binna R, Specht G, Kronenberg F. HaploGrep: A Fast and Reliable Algorithm for Automatic Classification of Mitochondrial DNA Haplogroups. Human Mutation. 2011;32(1):25-32. PubMed PMID: WOS:000286281800011. doi: 10.1002/humu.21382
35. Price AL, Patterson NJ, Plenge RM, Weinblatt ME, Shadick NA, Reich D. Principal components analysis corrects for stratification in genome-wide association studies. Nature Genetics. 2006;38(8):904-9. PubMed PMID: WOS:000239325700019. doi: 10.1038/ng1847
36. Mitchell SL, Goodloe R, Brown-Gentry K, Pendergrass SA, Murdock DG, Crawford DC. Characterization of mitochondrial haplogroups in a large population-based sample from the United States. Human Genetics. 2014;133(7):861-8. PubMed PMID: WOS:000337088600003. doi: 10.1007/s00439-014-1421-9
37. Pereira L, Soares P, Radivojac P, Li BA, Samuels DC. Comparing Phylogeny and the Predicted Pathogenicity of Protein Variations Reveals Equal Purifying Selection across the Global Human mtDNA Diversity. American Journal of Human Genetics. 2011;88(4):433-9. PubMed PMID: WOS:000289664300003. doi: 10.1016/j.ajhg.2011.03.006
38. Gomez-Duran A, Pacheu-Grau D, Lopez-Gallardo E, Diez-Sanchez C, Montoya J, Lopez-Perez MJ, Ruiz-Pesini E. Unmasking the causes of multifactorial disorders: OXPHOS differences between mitochondrial haplogroups. Human Molecular Genetics. 2010;19(17):3343-53. PubMed PMID: WOS:000280704800005. doi: 10.1093/hmg/ddq246
39. Herrnstadt C, Howell N. An evolutionary perspective on pathogenic mtDNA mutations: haplogroup associations of clinical disorders. Mitochondrion. 2004;4(5-6):791-8. PubMed PMID: WOS:000226172600038. doi: 10.1016/j.mito.2004.07.041
40. Raule N, Sevini F, Santoro A, Altilia S, Franceschi C. Association studies on human mitochondrial DNA: Methodological aspects and results in the most common age-related diseases. Mitochondrion. 2007;7(1-2):29-38. PubMed PMID: WOS:000245701400006. doi: 10.1016/j.mito.2006.11.013
41. Hendrickson SL, Hutcheson HB, Ruiz-Pesini E, Poole JC, Lautenberger J, Sezgin E, Kingsley L, Goedert JJ, Vlahov D, Donfield S, Wallace DC, O'Brien SJ. Mitochondrial DNA haplogroups influence AIDS progression. Aids. 2008;22(18):2429-39. PubMed PMID: WOS:000261772300003. doi: 10.1097/QAD.0b013e32831940bb
42. Folks TM, Clouse KA, Justement J, Rabson A, Duh E, Kehrl JH, Fauci AS. Tumor Necrosis Factor-Alpha Induces Expression of Human Immunodeficiency Virus in a Chronically Infected T-Cell Clone. Proceedings of the National Academy of Sciences of the United States of America. 1989;86(7):2365-8. PubMed PMID: WOS:A1989U042300051. doi: 10.1073/pnas.86.7.2365
43. Mellors JW, Griffith BP, Ortiz MA, Landry ML, Ryan JL. Tumor-Necrosis-Factor-Alpha Cachectin Enhances Human-Immunodeficiency-Virus Type-1 Replication in Primary Macrophages. Journal of Infectious Diseases. 1991;163(1):78-82. PubMed PMID: WOS:A1991EP67800014.
44. Poli G, Kinter A, Justement JS, Kehrl JH, Bressler P, Stanley S, Fauci AS. Tumor Necrosis Factor-Alpha Functions in an Autocrine Manner in the Induction of Human Immunodeficiency Virus Expression. Proceedings of the National Academy of Sciences of the United States of America. 1990;87(2):782-5. PubMed PMID: WOS:A1990CK37800058. doi: 10.1073/pnas.87.2.782
45. Errea O, Moreno B, Gonzalez-Franquesa A, Garcia-Roves PM, Villoslada P. The disruption of mitochondrial axonal transport is an early event in neuroinflammation. Journal of Neuroinflammation. 2015;12. PubMed PMID: WOS:000360116700001.152. doi: 10.1186/s12974-015-0375-8
46. Trudler D, Nash Y, Frenkel D. New insights on Parkinson's disease genes: the link between mitochondria impairment and neuroinflammation. Journal of Neural Transmission. 2015;122(10):1409-19. PubMed PMID: WOS:000363273700007. doi: 10.1007/s00702-015-1399-z
47. Verri M, Pastoris O, Dossena M, Aquilani R, Guerriero F, Cuzzoni G, Venturini L, Ricevuti G, Bongiorno AI. MITOCHONDRIAL ALTERATIONS, OXIDATIVE STRESS AND NEUROINFLAMMATION IN ALZHEIMER'S DISEASE. International Journal of Immunopathology and Pharmacology. 2012;25(2):345-53. PubMed PMID: WOS:000305879500004.
48. Witte ME, Geurts JJG, de Vries HE, van der Valk P, van Horssen J. Mitochondrial dysfunction: A potential link between neuroinflammation and neurodegeneration? Mitochondrion. 2010;10(5):411-8. PubMed PMID: WOS:000281051500002. doi: 10.1016/j.mito.2010.05.014
49. Kamat A, Lyons JL, Misra V, Uno H, Morgello S, Singer EJ, Gabuzda D. Monocyte Activation Markers in Cerebrospinal Fluid Associated With Impaired Neurocognitive Testing in Advanced HIV Infection. Jaids-Journal of Acquired Immune Deficiency Syndromes. 2012;60(3):234-43. PubMed PMID: WOS:000305804400013. doi: 10.1097/QAI.0b013e318256f3bc
50. Marcotte TD, Deutsch R, Michael BD, Franklin D, Cookson DR, Bharti AR, Grant I, Letendre SL, Grp C. A Concise Panel of Biomarkers Identifies Neurocognitive Functioning Changes in HIV-Infected Individuals. Journal of Neuroimmune Pharmacology. 2013;8(5):1123-35. PubMed PMID: WOS:000328496000011. doi: 10.1007/s11481-013-9504-2
51. Larsen S, Diez-Sanchez C, Rabol R, Ara I, Dela F, Helge JW. Increased intrinsic mitochondrial function in humans with mitochondrial haplogroup H. Biochimica Et Biophysica Acta-Bioenergetics. 2014;1837(2):226-31. PubMed PMID: WOS:000330498700002. doi: 10.1016/j.bbabio.2013.10.009
52. Mueller EE, Brunner SM, Mayr JA, Stanger O, Sperl W, Kofler B. Functional Differences between Mitochondrial Haplogroup T and Haplogroup H in HEK293 Cybrid Cells. Plos One. 2012;7(12). PubMed PMID: WOS:000313618800073.e52367. doi: 10.1371/journal.pone.0052367
53. Bulstrode H, Nicoll JAR, Hudson G, Chinnery PF, Di Pietro V, Belli A. Mitochondrial DNA and traumatic brain injury. Annals of Neurology. 2014;75(2):186-95. PubMed PMID: WOS:000333005000006. doi: 10.1002/ana.24116
54. Tranah GJ, Nalls MA, Katzman SM, Yokoyama JS, Lam ET, Zhao Y, Mooney S, Thomas F, Newman AB, Liu Y, Cummings SR, Harris TB, Yaffe K, Hlth A, Body Composition S. Mitochondrial DNA Sequence Variation Associated with Dementia and Cognitive Function in the Elderly. Journal of Alzheimers Disease. 2012;32(2):357-72. PubMed PMID: WOS:000309977800010. doi: 10.3233/jad-2012-120466
Supplementary Table 1. Coding of covariates for regressions
|
Value = 0 |
Value = 1 |
|
|
Sex |
Female |
Male |
|
CSF Viral RNA Load |
>50 copies/mL |
≤ 50 copies/mL |
|
Comorbidity |
Minimal |
Contributing |
|
On ART |
No |
Yes |
Supplementary Table 2. Distributions of the populations for the secondary analyses in the participants of European ancestry, broken out by major haplogroups H, J, T, and Uk.
|
H |
J |
T |
Uk |
Other |
|
|
Total |
85 (49%) |
23 (13%) |
13 (7%) |
38 (22%) |
15 (9%) |
|
Contributing Comorbidity |
28 (33%) |
8 (35%) |
3 (23%) |
10 (26%) |
3 (20%) |
|
Plasma HIV RNA ≤ 50 copies/mL on ART |
43 (51%) |
10 (43%) |
6 (46%) |
22 (58%) |
8 (53%) |
Supplementary Table 3. Distributions of the populations for the secondary analyses in the participants of African ancestry, broken out by major haplogroups L1, L2, and L3.
|
L1 |
L2 |
L3 |
Other |
|
|
Total |
32 (19%) |
52 (31%) |
62 (37%) |
21 (13%) |
|
Contributing Comorbidity |
7 (22%) |
21 (40%) |
27 (44%) |
6 (29%) |
|
Plasma HIV RNA ≤ 50 copies/mL on ART |
11 (34%) |
22 (42%) |
28 (45%) |
6 (29%) |
Supplementary Table 4. Distributions of the populations for the secondary analyses in the participants of Hispanic ancestry, broken out by major haplogroups A, B, and C.
|
A |
B |
C |
Other |
|
|
Total |
17 (40%) |
12 (28%) |
5 (12%) |
9 (21%) |
|
Contributing Comorbidity |
10 (59%) |
2 (17%) |
4 (80%) |
2 (22%) |
|
Plasma HIV RNA ≤ 50 copies/mL on ART |
7 (41%) |
7 (58%) |
1 (20%) |
4 (44%) |
Supplemental Table 5.
Multivariate linear regression results for log CSF IL8 and TNF-
|
Log CSF IL-8 |
Log CSF TNF- |
|||||
|
beta |
SE |
P Value |
beta |
SE |
P Value |
|
|
Haplogroup T vs. All Others |
0.29 |
0.10 |
0.0047 |
0.60 |
0.16 |
0.00065 |
|
Sex |
0.086 |
0.067 |
0.20 |
−0.002 |
0.112 |
0.99 |
|
Age (per year) |
0.0014 |
0.0031 |
0.67 |
−0.6e−3 |
5.2e−3 |
0.91 |
|
CSF HIV RNA Load ≤ 50 copies/mL |
−0.22 |
0.11 |
0.049 |
−0.32 |
0.18 |
0.082 |
|
On ART |
−0.04 |
0.11 |
0.69 |
−0.11 |
0.18 |
0.53 |
|
Nadir CD4+ T Cell Count (per cell/mm3) |
−1.4e−4 |
1.8e−4 |
0.41 |
−0.6e−4 |
3.0e−4 |
0.85 |
Supplemental Table 6.
Multivariate linear regression results for log CSF TNF-
|
Regression beta |
SE |
P Value |
|
|
Haplogroup H vs. All Others |
−0.059 |
0.038 |
0.12 |
|
Sex |
0.037 |
0.059 |
0.53 |
|
Age (per year) |
0.0081 |
0.0023 |
0.00056 |
|
CSF HIV RNA Load ≤ 50 copies/mL |
−0.26 |
0.06 |
8.9e−5 |
|
Nadir CD4+ T Cell Count (per cell/mm3) |
−0.00026 |
0.00010 |
0.012 |
|
Comorbidity Status (Minimal vs. Contributing) |
0.074 |
0.042 |
0.079 |
|
On ART |
−0.196 |
0.070 |
0.006 |