Yolanda D Mahnke1, Kipper Fletez-Brant2, Irini Sereti3, Mario Roederer1
Mario Roederer
40 Convent Dr.
Bethesda, MD 20814
roederer@nih.gov
Background: Highly active antiretroviral therapy induces clinical benefits to HIV-1 infected individuals, which can be striking in those with progressive disease. Improved survival and decreased incidence of opportunistic infections go hand in hand with a suppression of the plasma viral load, an increase in peripheral CD4+ T-cell counts, as well as a reduction in the activation status of both CD4+ and CD8+ T cells.
Methods: We investigated T-cell dynamics during ART by polychromatic flow cytometry in total as well as in HIV-1-specific CD4+ and CD8+ T cells in patients with advanced disease. We also measured gene expression by single cell transcriptomics to assess functional state.
Results: The cytokine pattern of HIV-specific CD8+ T cells was not altered after ART, though their magnitude decreased significantly as the plasma viral load was suppressed to undetectable levels. Importantly, while CD4+ T cell numbers increased substantially during the first year, the population did not normalize: the increases were largely due to expansion of mucosal-derived CCR4+ CD4+ TCM; transcriptomic analysis revealed that these are not classical Th2-type cells.
Conclusion: The apparent long-term normalization of CD4+ T-cell numbers following ART does not comprise a normal balance of functionally distinct cells, but results in a dramatic Th2 shift of the reconstituting immune system.
Keywords: immune reconstitution, T helper subsets, cytokines, polarization
Highly active antiretroviral therapy (ART) for the treatment of HIV-1 effectively suppresses plasma viral load (PVL) in a vast majority of individuals, as well as gradually restoring CD4+ T-cell numbers and function. The reconstitution of the CD4+ T-cell compartment in peripheral blood is essentially biphasic [1-3]. An early, rapid increase during the first three weeks [3, 4] may be due to redistribution of memory cells to the peripheral blood from sites of inflammation in the tissues; subsequently, a slower phase, evident after about three months of treatment, is at least in part due to de novo production of naïve CD4+ T cells from the thymus [3, 5], as well as improved T-cell survival [6, 7]. The frequency of proliferating (Ki67+) cells decreases in both the CD4+ and CD8+ T-cell compartments, with a transient increase after 6 months of therapy, mainly in CD4+ central memory (TCM) cells [8]. More advanced patients are reported to have proportionately faster reconstitution rates [9], though the lower the CD4+ T-cell nadir, the longer it takes to normalize this population [10]. More advanced patients are reported to have proportionately faster reconstitution rates, though the lower the CD4+ T-cell nadir, the longer it takes to normalize this population.
Beyond these basic changes, less is known about the evolution of the T-cell compartment’s composition during ART. The most profound change described within the CD4+ and CD8+ T-cell lineages is an overall reduction in activation, as evidenced by loss of cells expressing CD38 [1, 9, 11] and HLA-DR [1, 11, 12], and a decrease in the mean fluorescence intensity (MFI) of CD38 on CD8+ T-cells [11, 13, 14]. These changes represent a (partial) normalization of the T-cells’ phenotype, towards that seen in healthy adults.
The HIV-specific T-cell response also changes dramatically following ART. Independent of the epitope, HIV-specific CD8+ T-cell responses exhibit an early, rapid decline, continued with slower kinetics once plasma viral loads have been suppressed to undetectable levels [15]. This reduction in magnitude is not accompanied by a change in the quality of the CD8+ T-cell response [16]; however, like the bulk T-cell compartment, the expression of CD38 and HLA-DR on HIV-1 Gag-specific T cells decreases during treatment [11].
Despite these apparent normalizations, treated subjects still have immune as well as in HIV-1 Gag-specific CD4+ and CD8+ T cells. We found an overall rebalancing in the differentiation of T cells, favoring less differentiated cells; in addition, molecules related to activation and functional suppression gradually decreased during treatment, trending towards levels observed in healthy individuals. In sharp contrast to these expected findings, the proportion of Th2-like CD4+ TCM increased for at least six months following ART initiation, in a direction away from frequencies typical for healthy adults; these cells have characteristics of mucosal-derived cells. Therefore, ART-induced immune reconstitution does not necessarily lead to a normalization of the immune system as a whole, and may, for at least a year, lead to a state that is Th2-biased in nature.
Ethics statement. HIV-1+ subjects were enrolled and provided written informed consent at the Clinical Center of the National Institute of Allergy and Infectious Diseases, NIH, under a protocol approved by the NIAID Institutional Review Board. These studies were registered at www.clinicaltrials.gov as #NCT00557570 and #NCT00286767. Samples were coded; all analyses were performed blinded to identity.
Human subjects and sample collection. The patient cohort has been described elsewhere [17]. Briefly, all patients (1) were ART-naïve (n = 56) or had interrupted treatment for at least one year (n = 4, plus n = 2 who had previously received brief mono- or dual therapy) with a viral rebound of > 10,000 copies/ml; (2) had ≤ 200 CD4+ T cells/μl at baseline; (3) suppressed their HIV-1 viral load to < 500 copies/ml within one year of ART; and (4) had available peripheral blood mononuclear cell (PBMC) samples taken pre-ART as well as after 1, 3, 6, and 12 months of ART. Seventeen patients developed episodes of immune reconstitution inflammatory syndrome (IRIS; defined according to the AIDS Clinical Trials Group criteria) following commencement of ART, while 39 underwent uneventful immune reconstitution. PBMC from 12 healthy donors served as controls (Table 1).
|
HIV+ |
HIV− |
|
|
n |
56 |
12 |
|
age A,B |
37.2 (31.2-43.2) |
36.4 (32.5-39.3) |
|
male (%) |
76.8 |
66.7 |
|
ethnicity (%) |
||
|
African |
51.8 |
58.3 |
|
Asian |
0.0 |
8.3 |
|
Caucasian |
14.3 |
16.7 |
|
Hispanic or Latino |
25.0 |
0.0 |
|
Native American or Alaska Native |
1.8 |
0.0 |
|
mixed |
7.1 |
16.7 |
|
ART component (%) |
||
|
NNRTI C |
64.3 |
|
|
PI C |
35.7 |
|
|
Time relative to ART initiation (months) |
||
|
pre-ART |
−0.2 (-0.5-0) |
|
|
mo1 |
1 (0.9-1.2) |
|
|
mo3 |
3 (2.8-3.2) |
|
|
mo6 |
5.6 (5.6-6.1) |
|
|
mo12 |
12 (11.2-12.5) |
|
A HIV+: at ART initiation; HIV−: at time of PBMC sampling
B median (IQR)
C NNRTI: non-nucleoside reverse-transcriptase inhibitors; PI: protease inhibitors
For the elucidation of T-helper subsets (Figures 5-6), PBMC of an additional 13 HIV-1+ individuals were sampled before, as well as 1 month, and 12 months after initiation of ART. Their clinical parameters were comparable to that of the main cohort, with the following medians and inter-quartile ranges pre-ART: 56 (20-77) CD4+ T cells/μl, 572 (469-744) CD8+ T cells/μl, 4.8 (4.5-5.4) log10 PVL; after 1 month of ART: 129 (101-152) CD4+ T cells/μl, 918 (589-1105) CD8+ T cells/μl, 2.3 (1.9-2.7) log10 PVL; and after 12 month of ART: 210 (199.8-264.5) CD4+ T cells/μl, 795.5 (555.5-950) CD8+ T cells/μl, 1.7 (1.7-1.7) log10 PVL. None of these patients experienced IRIS. PBMC from an additional 16 healthy donors served as controls for this part of the study.
Determination of plasma viral load, CD4+, and CD8+ cell counts. Plasma HIV-1 viral loads (PVL), as well as CD4 and CD8 counts were determined in a laboratory operating under the Clinical Laboratory Improvement Amendment (CLIA). The plasma viral load was measured using the ultrasensitive Quantiplex HIV-1 bDNA version 3.0 (Bayer). CD4+ and CD8+ T-cell counts were determined by four-color flow cytometry. The BD Multitest (BD Biosciences) that was used includes the following Abs: CD3FITC (clone SK7); CD4APC (clone SK3); CD8PE (clone SK1); and CD45PerCP (clone 2D1). Samples were acquired on either FACSCalibur or FACSCanto (both BD Biosciences). CD4+ cell counts were calculated as percent of CD4+ CD3+ cells within CD45+ lymphocytes divided by 1% of the white blood cell count. The corresponding calculation was performed for CD8+ cell counts.
Sample preparation and Ag-stimulation.Cryopreserved PBMC were thawed in pre-warmed RPMI 1640, 10% FCS, 2mM L-glutamine, 100 U/ml penicillin, and 100 μg/ml streptomycin (all from Gibco; this medium will hereafter be referred to as complete RPMI), in the presence of 20 μg/ml benzonase nuclease (Novagen). Cells were rested in complete RPMI for 4-6 hours at 37°C, 5% CO2 and either left unstimulated (mock control) or stimulated overnight in 200 μl complete RPMI with 2.5 μg/ml HIV-1 Gag peptide pool (NIH AIDS Research and Reference Reagent Program, Germantown, MD) in the presence of anti-CD49d and anti-CD28PE-Cy5 mAb (BD Biosciences). Monensin and Brefeldin A (BD Biosciences) were added after 2 hours of stimulation. Healthy donor PBMC were stimulated with SEB (Sigma) to serve as a positive control.
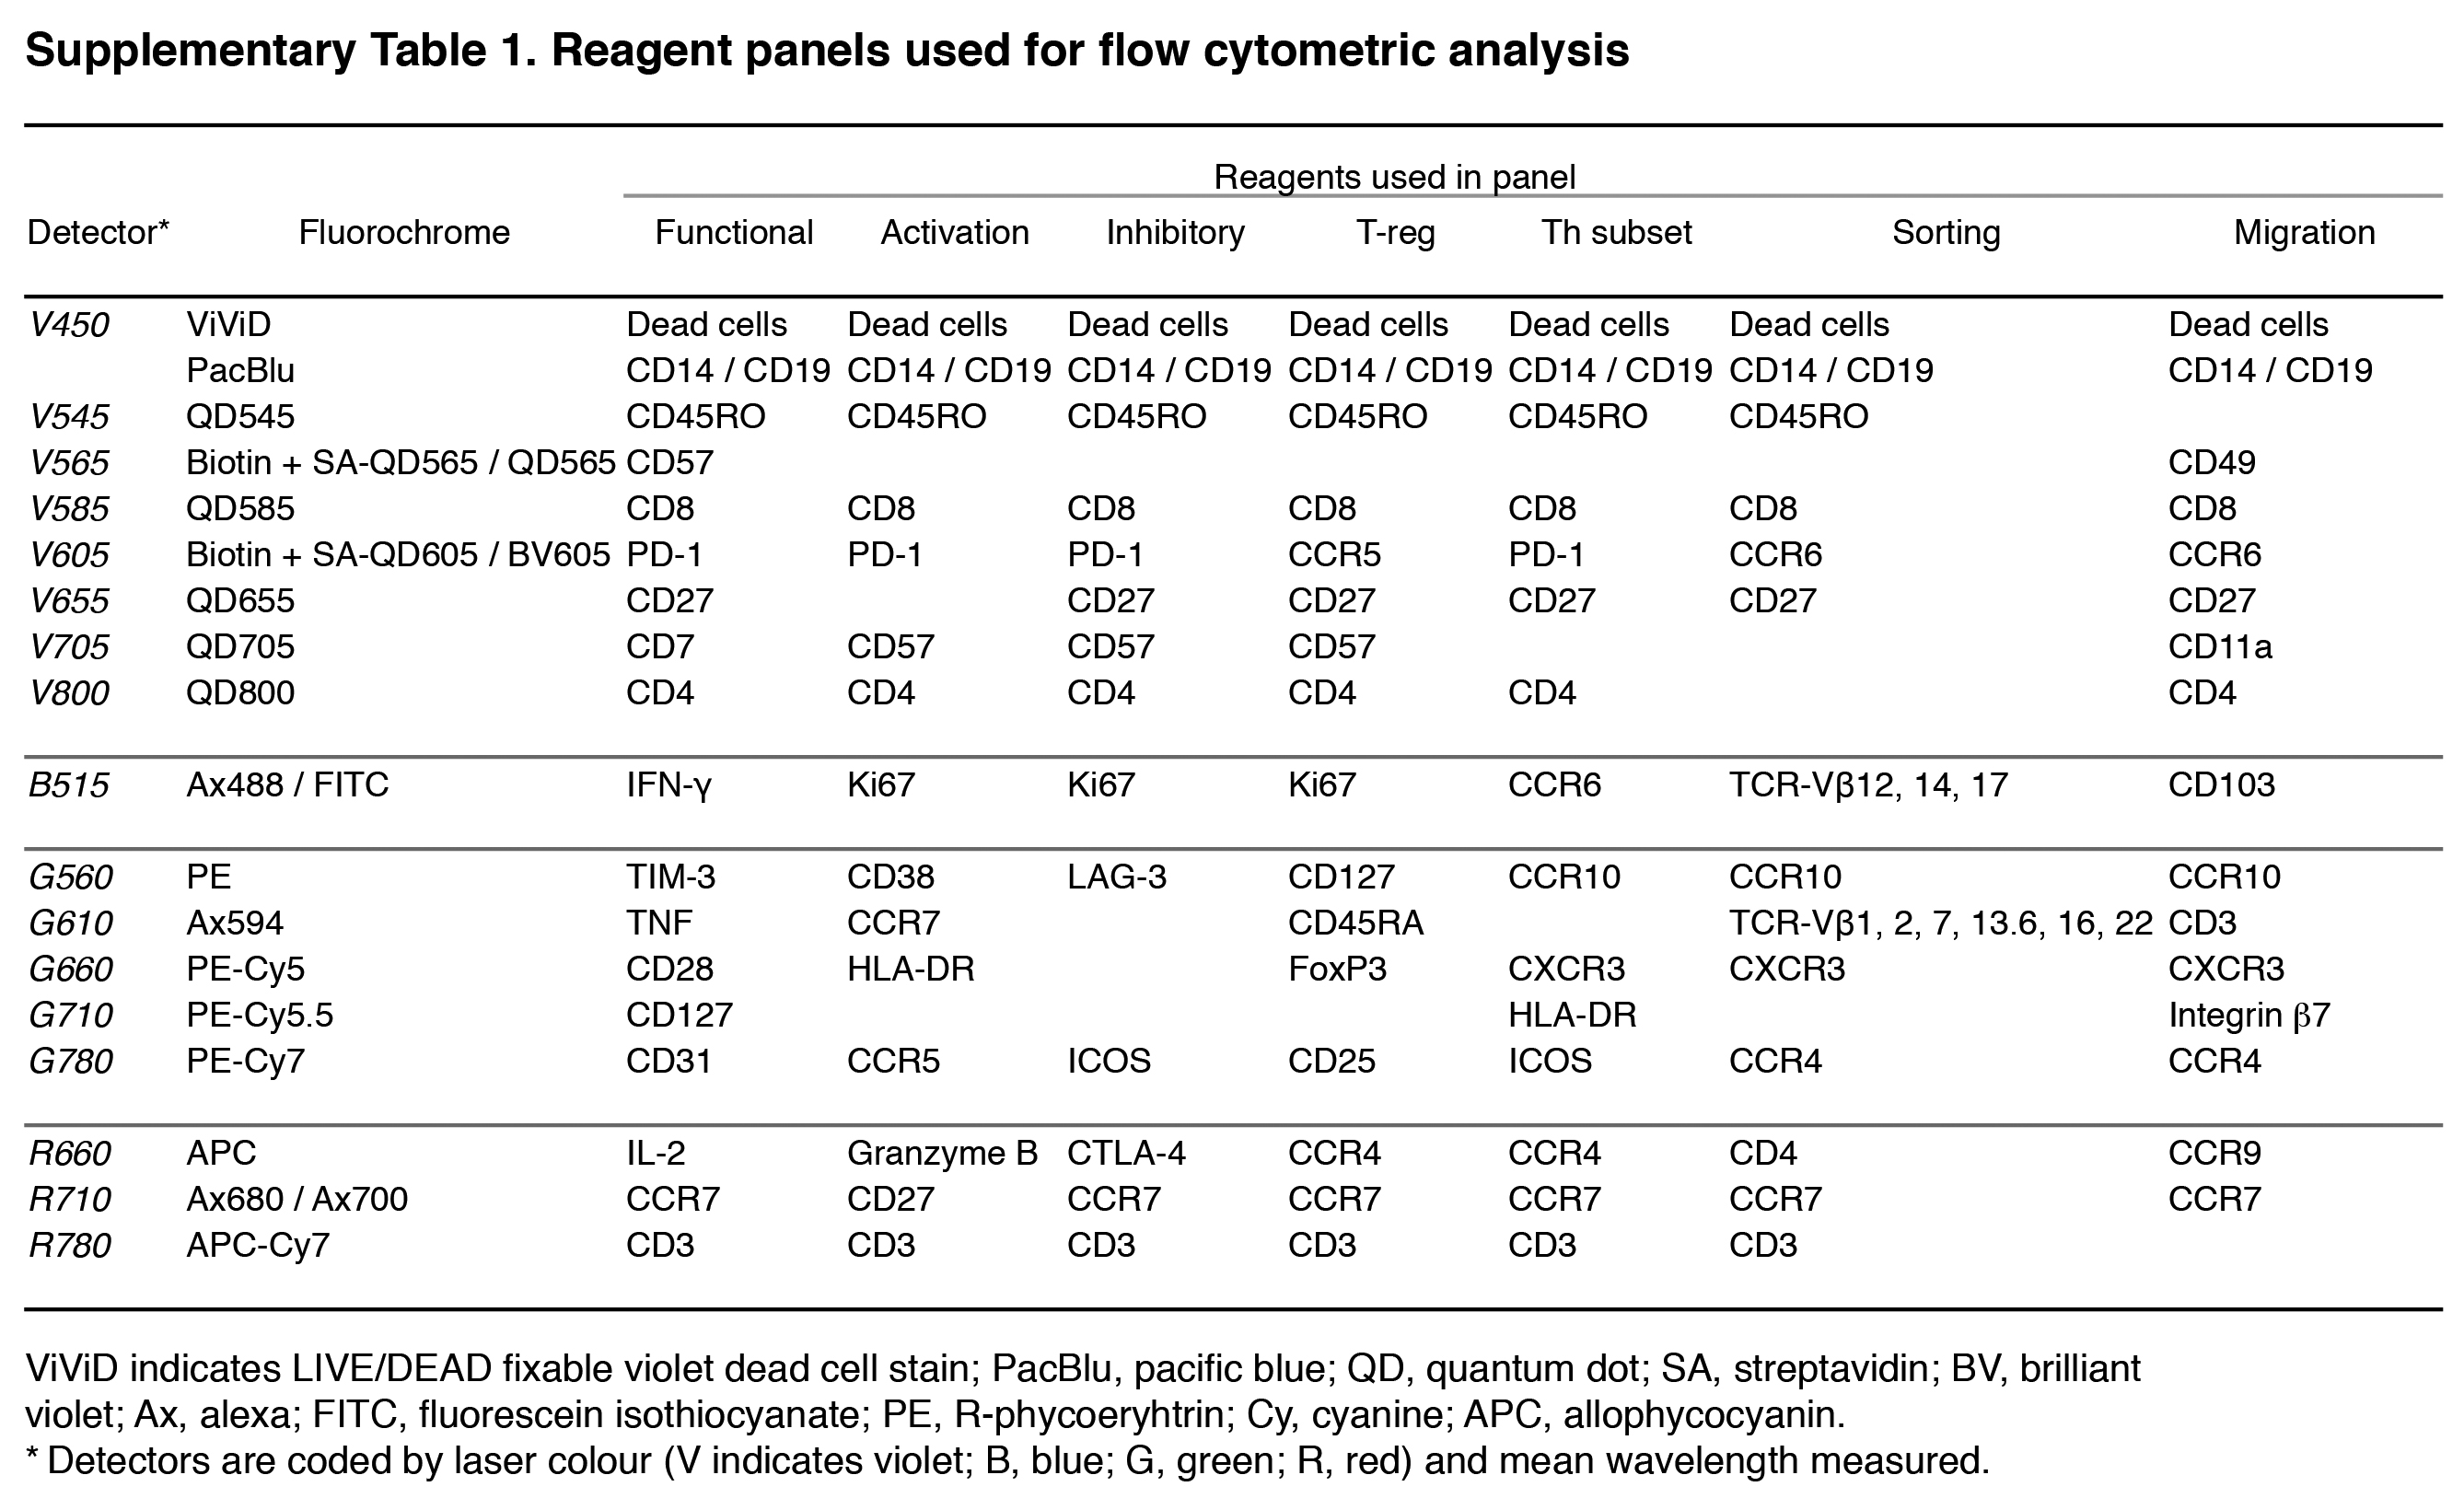
Flow cytometry.The reagent panels used in the present study are listed in Supplementary Table 1. All except the “Th subset” and “sorting” panels have been described in previous publications [17, 18]. The “Th subset” panel included the following additional reagents: CCR6Ax488 (clone TG7/CCR6); CCR10PE (clone 6588-5, both from BioLegend); CXCR3PE-Cy5 (clone 1C6/CXCR3); and HLA-DRPE-Cy5.5 (clone TÜ36, both from BD Biosciences). The “sorting” panel included the following additional reagents: CCR6BV605 (clone G034E3); CCR4PE-Cy7 (clone TG6/CCR4, both from BioLegend); CD4APC (clone RPA-T4, BD Biosciences); as well as TCR-Vβ12 (clone VER2.32.1); TCR-Vβ14 (clone CAS1.1.1.3); and TCR-Vβ17 (clone E17.5F3.15.13) conjugated to FITC (Life Technologies) at the VRC; and TCR-Vβ1 (clone BL37.2); TCR-Vβ2 (clone MPD2D5); TCR-Vβ7 (clone ZOE); TCR-Vβ13.6 (clone JU74.3); TCR-Vβ16 (clone TAMAYA1.2); and TCR-Vβ22 (clone IMMU546) conjugated to Ax594 (Life Technologies) at the VRC. All unconjugated TCR-Vβ Abs were obtained from Beckman Coulter. For intracellular staining, cells were treated with BD Cytofix/Cytoperm Permeabilization Solution (BD Biosciences), except for the Treg panel, where the Foxp3 Staining Buffer Set was employed (eBioscience). Data were acquired on an LSR II (BD Biosciences) using a high-throughput system (HTS).
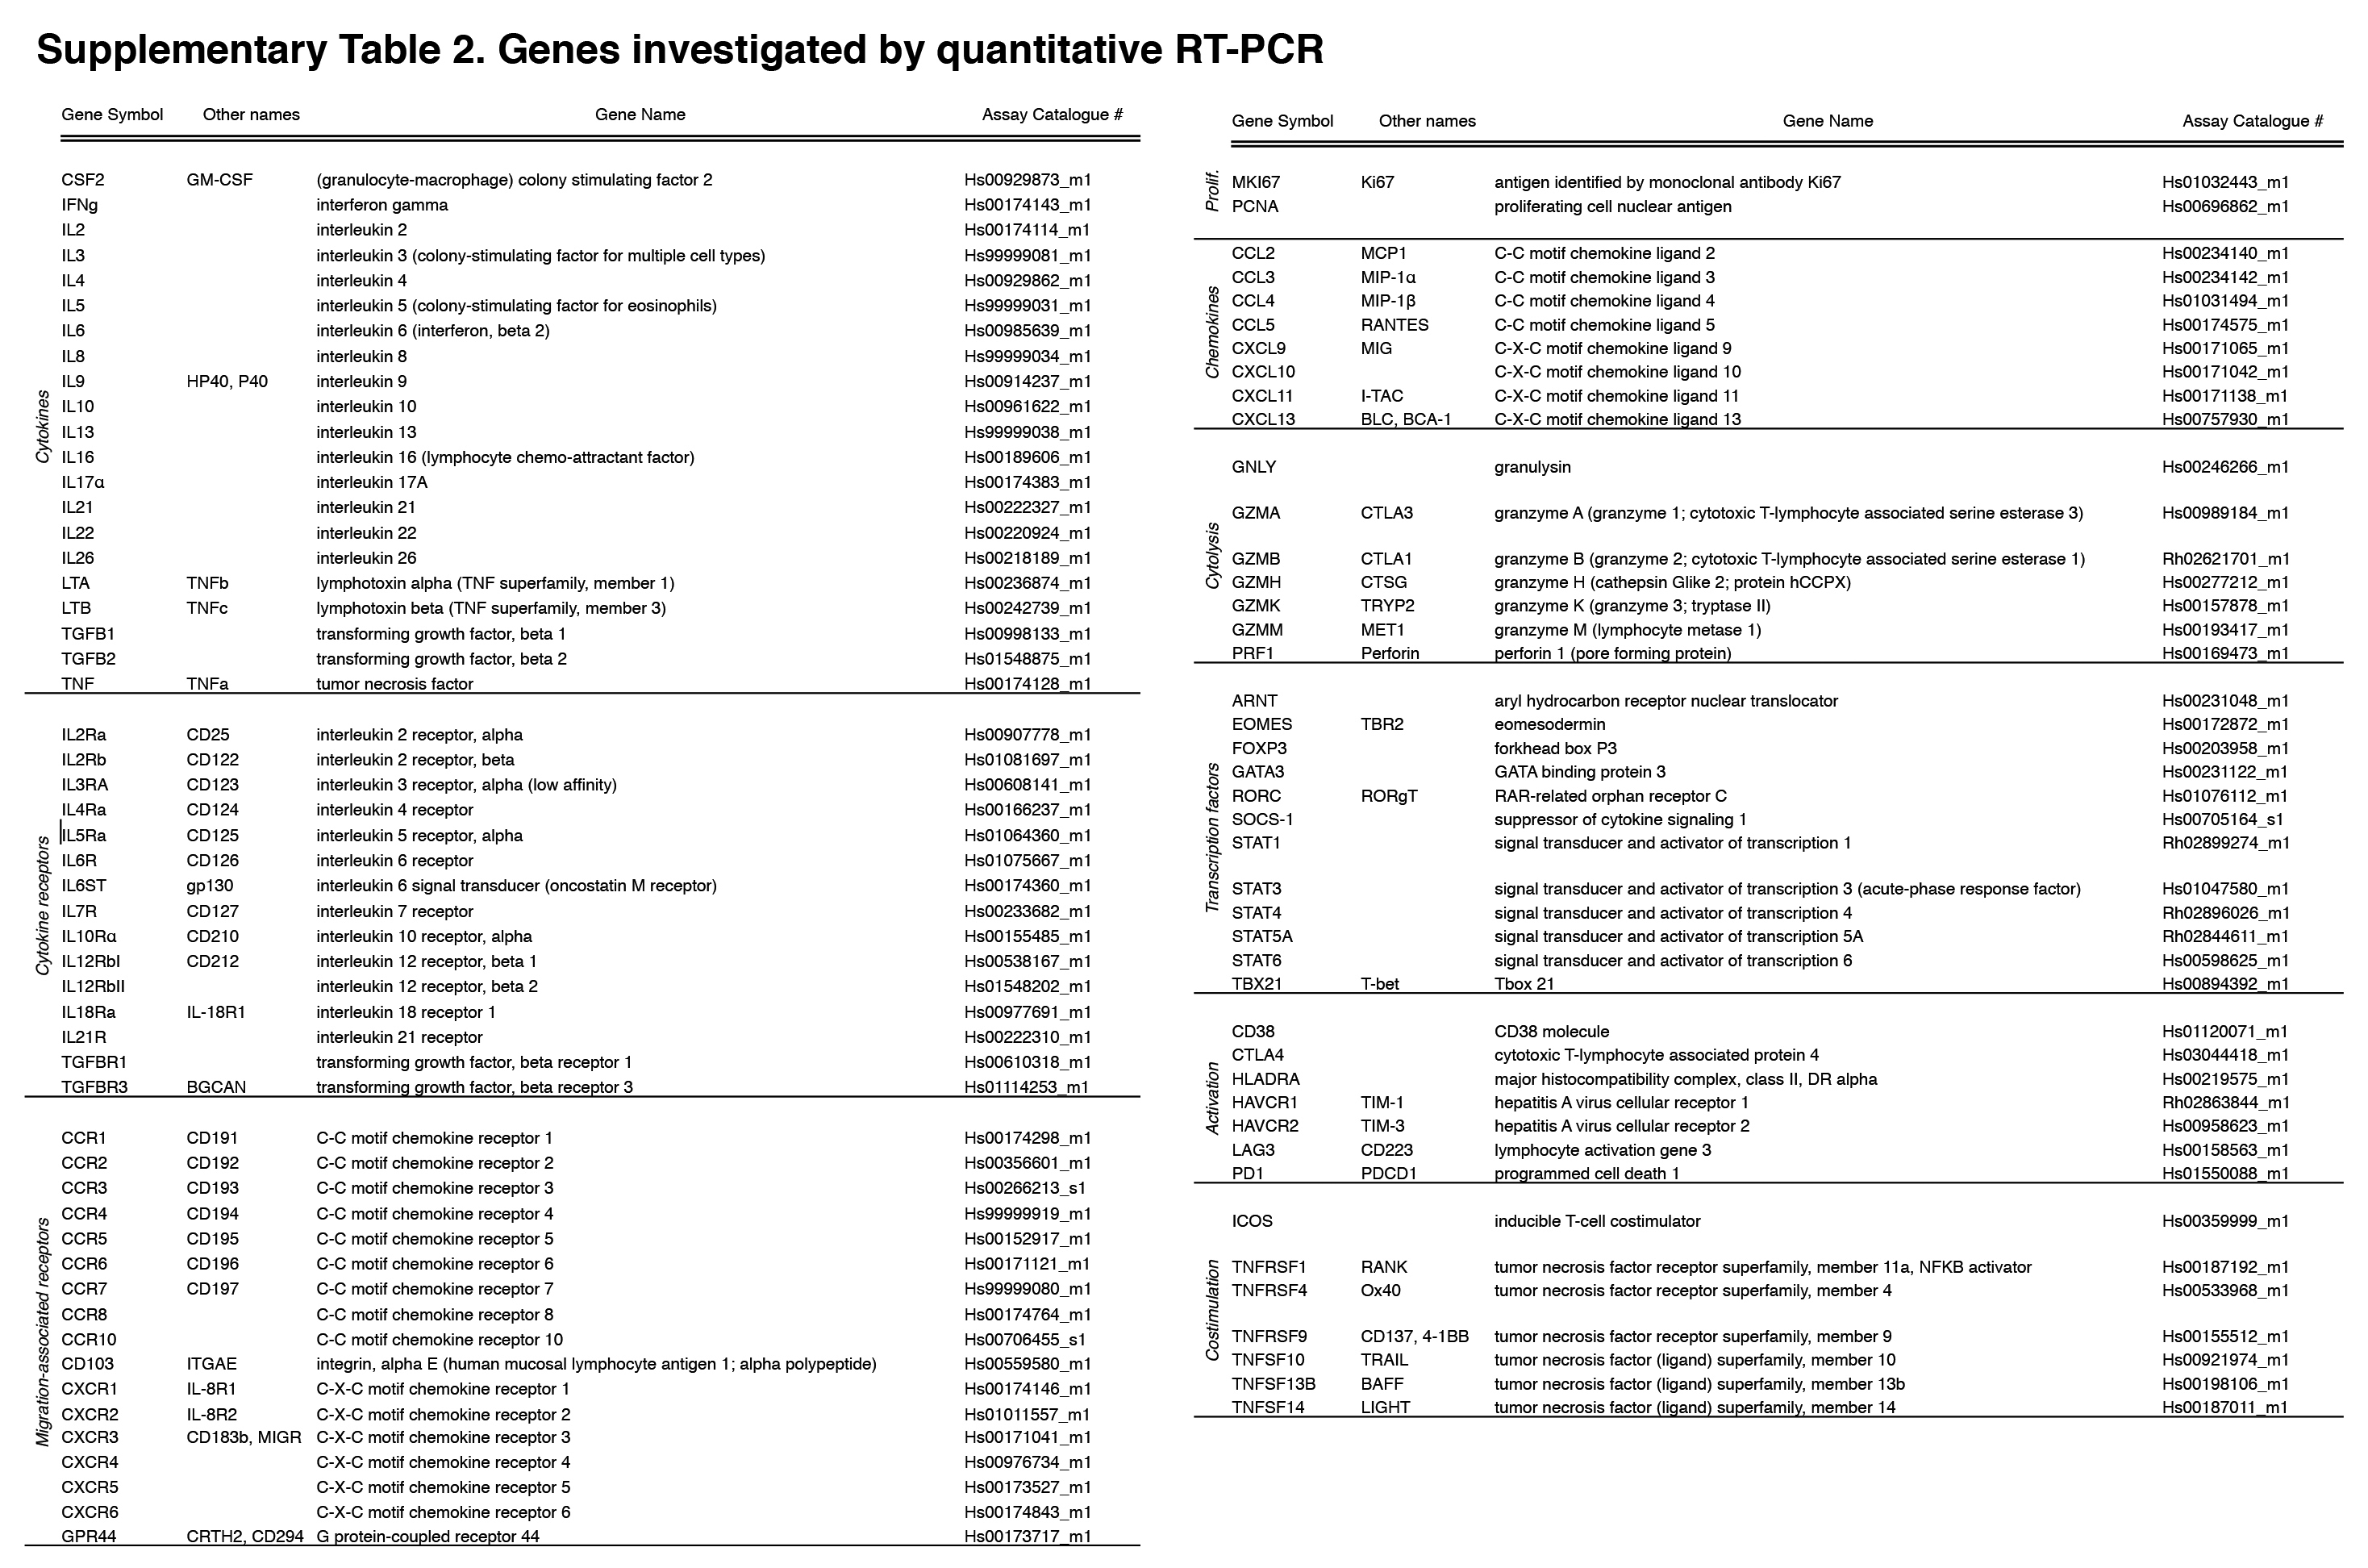
Multi-parametric quantitative RT-PCR. We largely followed the protocols set forth by Dominguez et al. [19]. Briefly, TaqManTM primer/probe sets (Life Technologies) were chosen for genes relevant for T-cell immunity, including those associated with cytokines, cytokine receptors, migration, proliferation, chemokines, cytolysis, transcription factors, activation, and costimulation (see Supplementary Table 2). Depending on subset abundance, 10-100 cells were sorted by fluorescence-activated cell sorting for assessment of gene expression in different CD4+ T-cell subsets (Supplementary Figure 5). Cells were sorted directly into cell culture plates containing 10µl of reaction mix (Invitrogen Cell Direct KitTM, Life Technologies); the manufacturer’s instructions were followed for reverse transcription (15min at 50°C) and cDNA synthesis (2min at 95°C; 15sec at 95°C; 4min at 60°C). Seventeen pre-amplification cycles were performed (15sec at 95°C; 4min 60°C).
Pre-amplified cDNA, and TaqManTM primer/probes were loaded onto a microfluidic chip (Fluidigm), and multi-parametric quantitative RT-PCR was performed using a BiomarkTM cycler (Fluidigm) as previously described [19].
Data analysis. Flow cytometry data were analyzed using FlowJo (FlowJo, LLC), Pestle (NIAID, NIH; by M . Roederer), and SPICE 5.1 [20]. The gating scheme is identical to that used in our previous publications [17, 18]. All cytokine measurements were background subtracted, taking into account the frequency of cells producing cytokines in the absence of antigenic stimulation (mock control). For the phenotypic analysis of Ag-specific cells, only those samples with > 10 cytokine-positive events and response magnitudes > 3x that of the corresponding mock control were considered. The mean fluorescence intensity (MFI) of CD38+ cells was calibrated using the experiment-matched internal control sample.
RT-PCR data were analyzed using JMP 11 (SAS), R 3.1, and Bioconductor [21]. Because varying cell numbers were sorted for RT-PCR of individual T-cell subsets, all samples were normalized to 50 cells. Relative gene expression levels or “expression threshold” (Et) are proportional to log2 RNA abundance and were calculated using the “cycle threshold” (Ct) obtained, where Et = 28-Ct [19]. The following genes, expressed by less than 10% of samples analyzed, were excluded from the analysis, as this could due to inefficient amplification: CXCL11; CXCR1; CXCR2; GPR44; IL5; IL9; and TGFB2.
“Th-ness” and Differentiation Index (DI). Th-ness was defined as the posterior probability [22, 23] of class membership given by a support vector machine (SVM) [24, 25] trained to differentiate between all sorted healthy donor Th1- and Th2-like cells with radial basis kernel. All sorted CCR4+ TCM, CCR4+ non-TCM, CCR4− TCM, and CCR4− non-TCM samples were then assigned a Th-ness value according to their gene expression pattern, indicating whether their phenotype was more similar to Th1- or Th 2-like cells. Accuracy of the SVM was 90% for three-fold cross validation.
Each T-cell subset was assigned a weighting value as follows: TNV = 0; TCM* = 1; TCM = 2; TTM* = 3; TTM = 4; TEM=5; TTE* = 6; TTE = 7. The DI is the average of the subset frequencies weighted by their respective values. As Nv cells do not contribute to a population’s overall differentiation, they are assigned a weighting of 0. The weighted sum is then normalized by the maximum differentiation value (7) to derive a metric ranging from 0 to 1: DI = ((%TNV * 0) + (%TCM* * 1) + (%TCM * 2) + (%TTM* * 3) + (%TTM * 4) + (%TEM * 5) + (%TTE* * 6) + (%TTE * 7)) / 7 / 100%
Statistical analysis.Nonparametric tests were used for all analyses (SAS version 9.2); matched comparisons were performed where applicable. Changes from baseline (paired differences) were evaluated using the Sign test. Statistical comparisons of pie charts were performed in SPICE 5.1 software using 10,000 permutations [20]. Given the exploratory nature of this study, there was no adjustment for multiple comparisons; in most analyses, only P-values less than 0.01 are reported.
Differential expression analysis of genes assayed by RT-PCR was performed using Limma [26-28]. Results for CD103 were obtained via robust regression [29, 30]. All P-values from differential expression analyses were then pooled for control of false discovery rate [31]. Significance was then defined as an adjusted P-value less than 0.01.
Fifty-six HIV-1+ patients commenced ART when their CD4+ T-cell count was ≤ 200/μl. Phenotype and HIV-1 Gag reactivity of their PBMC-derived T cells were characterized before ART, as well as at 1, 3, 6, and 12 months after ART-initiation (Table 1). All patients rapidly responded to ART, evidenced by a 3-log suppression of the PVL within a month and to undetectable levels within 3 months (Supplementary Figure 1A). The CD4+ T-cell counts gradually increased during the time of follow-up. Though the increase was significant within 1 month of treatment, T-cell counts still remained largely below those observed in healthy adults at 1 year (Supplementary Figure 1B). CD8+ T-cell counts, which started in the range of levels typically observed in healthy adults, increased only during the first month of treatment (Supplementary Figure 1C) [18].
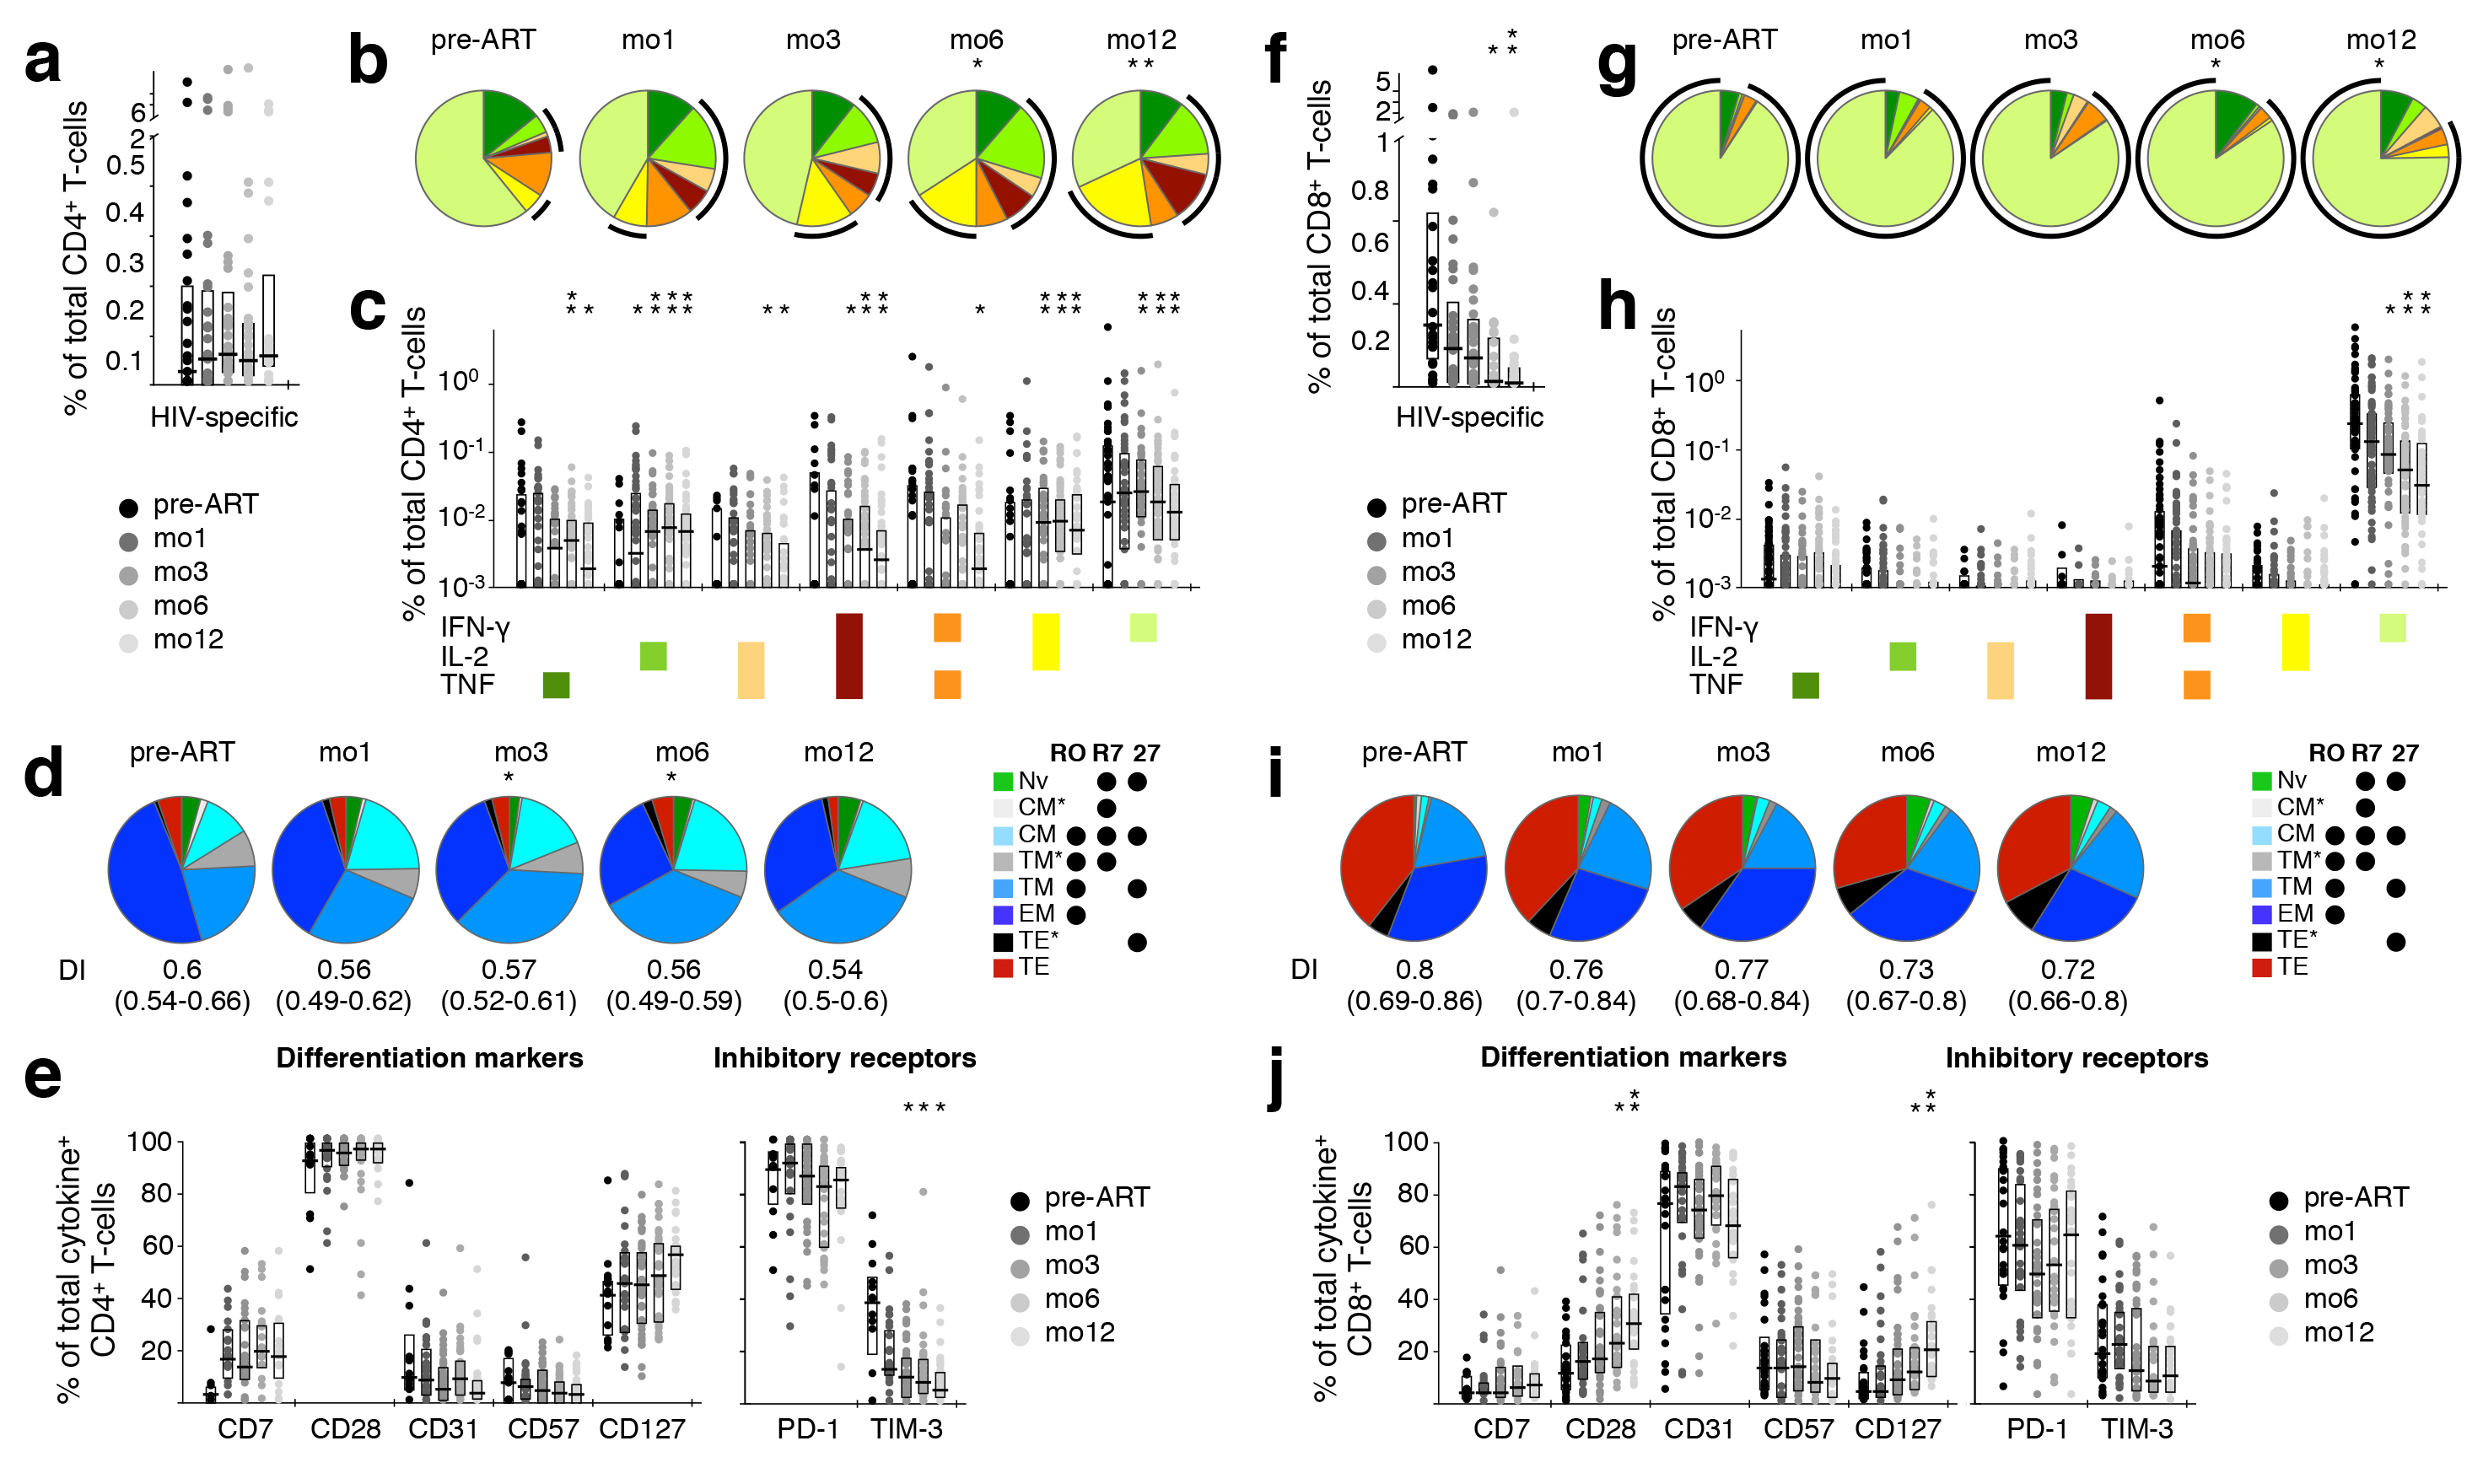
Figure 1. Longitudinal analysis of HIV-1 Gag-specific cytokine production by T cells and the phenotype of cytokine-producing cells. The effect of ART on HIV-1 Gag-reactive CD4+ (A-E) and CD8+ T cells (F-J) was determined in longitudinal PBMC samples of HIV-1+ patients. (A, F) Total response magnitude, measured by production of IFN-γ, IL-2, or TNF. (B, G) Cytokine pattern. Relative proportion of total HIV-1 Gag-reactive cells producing each possible combination of the cytokines measured. Black arcs indicate all IL-2 (B) or IFN-γ (G) producing cells. (C, H) Actual frequency of cells producing only IFN-γ, IL-2, or TNF, or any combination thereof. Potential phenotypic alterations occurring due to ART were explored in HIV-1 Gag-reactive CD4+ (D, E) and CD8+ T cells (I, J) in longitudinal PBMC samples of HIV-1+ patients. (D, I) Differentiation state. T-cell differentiation subsets of cytokine-positive cells were defined by expression of CD45RO (“RO”), CCR7 (“R7”), and CD27 (“27”). Differentiation indices (DI; medians and interquartile ranges) are indicated below each pie. (E, J) Phenotype. The frequency of cytokine-positive cells expressing differentiation markers (CD7, CD28, CD31, CD57, CD127) or inhibitory receptors (PD-1, TIM-3) was determined. Graphs show interquartile ranges, median bars, as well as individual data points. All time-points were compared to corresponding pre-ART measurements: *P <0.01, **P <0.001, *** P <0.0001.
Even though the magnitude of the HIV-specific CD4+ T-cell response did not change within the first year of ART (Figure 1A), these cells became more polyfunctional (i.e., producing two or three cytokines) over time, achieving statistical significance at late sampling time-points (6-12 months of ART, Figure 1B). This change in cytokine pattern was mainly due to increased IL-2 production (Figures 1B, C)). The subset distribution within HIV-responsive CD4+ T cells was also affected by ART: as early as 3 months after commencing ART, less differentiated cells (TCM, T TM) increased, with a concomitant reduction in TEM cells (Figure 1D). However, no significant change in the differentiation index (DI; see supplementary methods section) of HIV-1 Gag-specific CD4+ T cells was observed. Furthermore, the ART-induced reversal of other differentiation and inhibitory receptors’ expression was much less dramatic for HIV-specific cells (Figure 1E) than that for total CD4+ T cells (see below). Though there were trends mirroring total CD4+ T cells, no statistically significant changes were observed in the phenotype of HIV-specific CD4+ T cells. Taken together, these data indicate that while the overall magnitude of HIV-specific CD4+ T cells remained unaffected by ART, these cells became mildly more enriched for less differentiated cells without changes in activation state.
In contrast, HIV-specific CD8+ T cells reacted very differently to ART than their CD4+ counterparts. As previously published [11, 16], there was a significant decrease in the magnitude of the CD8+ T-cell response to HIV-1 (Figure 1F). However, the cytokine pattern remained virtually unchanged for at least one year of treatment (Figures 1G, H). The subset distribution of HIV-responsive CD8+ T cells remained unchanged (Figure 1I), and their DI did not change significantly over the course of study. The ART-induced reversal of other differentiation and inhibitory receptors’ expression was also less dramatic (Figure 1J) than that observed in total CD8+ T cells (Supplementary Figure 2).
We examined the evolution of T-cell differentiation over the course of ART; differentiation stage was defined by classifying cells (in rough order of maturation) as naïve (TNV), central memory (TCM and TCM*), transitional memory (TTM* and TTM), effector memory (TEM), or terminal effector (TTE* and TTE) [32]. There were significant changes in the CD4+ T-cell subset distribution after starting ART (Figure 2A), with increasing proportions of less differentiated subsets (TNV, TCM, TTM*) over the course of treatment and a concomitant reduction in the proportion of highly differentiated cells (TTE). As previously reported, the frequency of TCM was increased at mo1 (Figure 2B), prior to that of TNV, which became significant only at 1 year (Figure 2D). This is a reflection of the initial redistribution of memory cells [4] followed by a delayed de novo production and improved survival of cells [3, 5-7]. While the relative frequency of TNV initially decreased due to the preferential release of memory cells from secondary lymphoid tissues, their absolute numbers increased upon introduction of ART (Figure 2E), together with that of TCM (Figure 2C). The proportion of CD4+ T cells in late differentiation stages (TEM, TTE* and TTE) steadily decreased after ART initiation (Figure 2F). Consequently, the DI of the total CD4+ T-cell compartment progressively decreased over the course of ART (Figure 2A). Interestingly, patients with higher pre-ART levels of late differentiation (TEM−TE) CD4+ T cells demonstrated lower pre-ART PVL (Figure 2G), but also a less dramatic recovery of CD8+ T-cell counts.
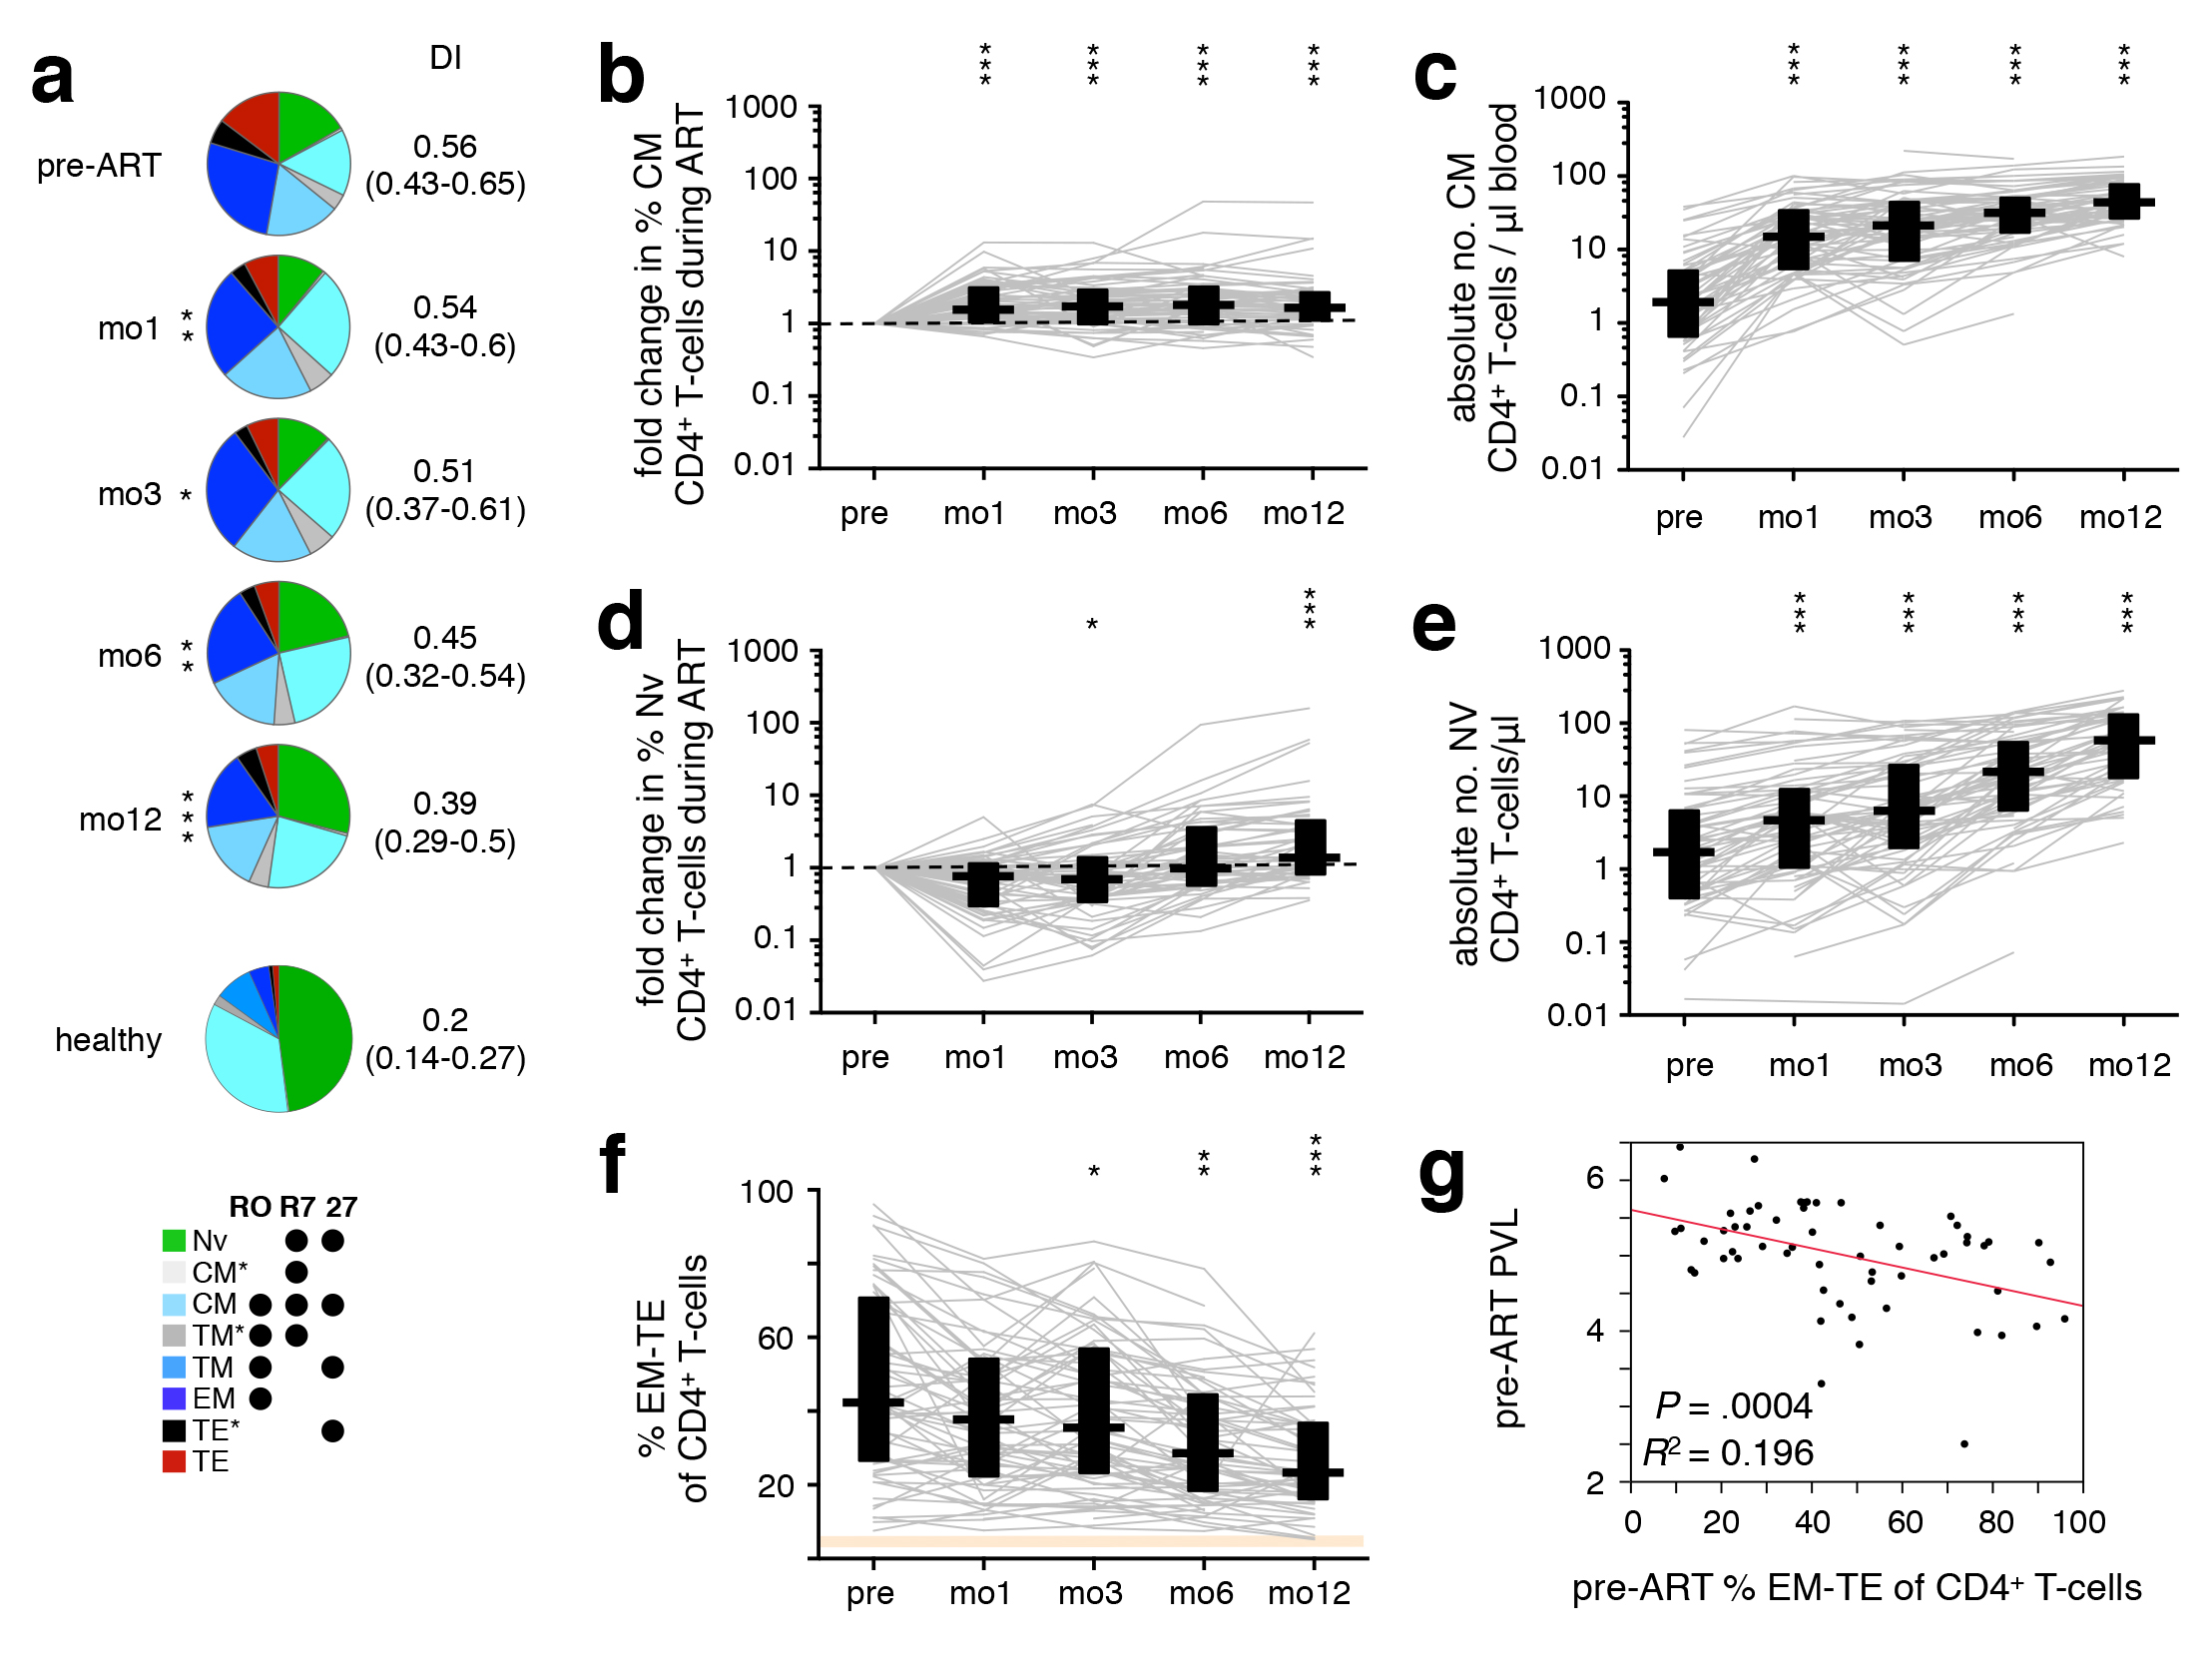
Figure 2. ART-induced change towards less differentiated CD4+ T cells. PBMC were sampled before ART, and after 1, 3, 6, and 12 months of ART. (A) The differentiation pattern was investigated in CD4+ T cells. Subsets were defined by expression of CD45RO (“RO”), CCR7 (“R7”), and CD27 (“27”). TNV–naïve; TCM–central memory; TTM–transitional memory; TEM–effector memory; TTE–terminal effector. TCM*, TTM*, and TTE* are populations not classically discussed in the literature, but arise by this gating scheme; their activation phenotype and cytokine potential most closely resemble that of TCM, TTM, and TTE, respectively, hence their nomenclature. Differentiation indices (DI; medians and interquartile ranges) are indicated. The change in frequency over the course of treatment relative to pre-ART levels (B, D), as well as absolute cell count (C, E) of TNV (B, C) and TCM (D, E), and total frequency of late-differentiation (TEM, TTE*, and TTE) (f) CD4+ T-cells are shown. (G) Pre-ART PVL was plotted against pre-ART late-differentiation (TEM, TTE*, and TTE) CD4+ T cells. Graphs show development in individual patients, as well as medians and interquartile ranges. Corresponding interquartile ranges in healthy donors are shown where applicable (orange). All time-points were compared to corresponding pre-ART measurements: *P < 0.01, **P < 0.001, ***P < 0.0001.
Nineteen of the 56 patients developed Immune Reconstitution Inflammatory Syndrome (IRIS) following ART initiation, which we showed alters CD4+ T-cell reconstitution kinetics, mainly by delaying TNV recovery and the concomitant reduction of TEM, which are most evident at mo6 [18]. As a result, the inclusion of patients experiencing IRIS after commencing ART delayed the overall observed decrease of TEM−TE CD4+ T cells (mo3 vs. pre-ART: P = 0.0465 IRIS, P = 0.0005 non-IRIS).
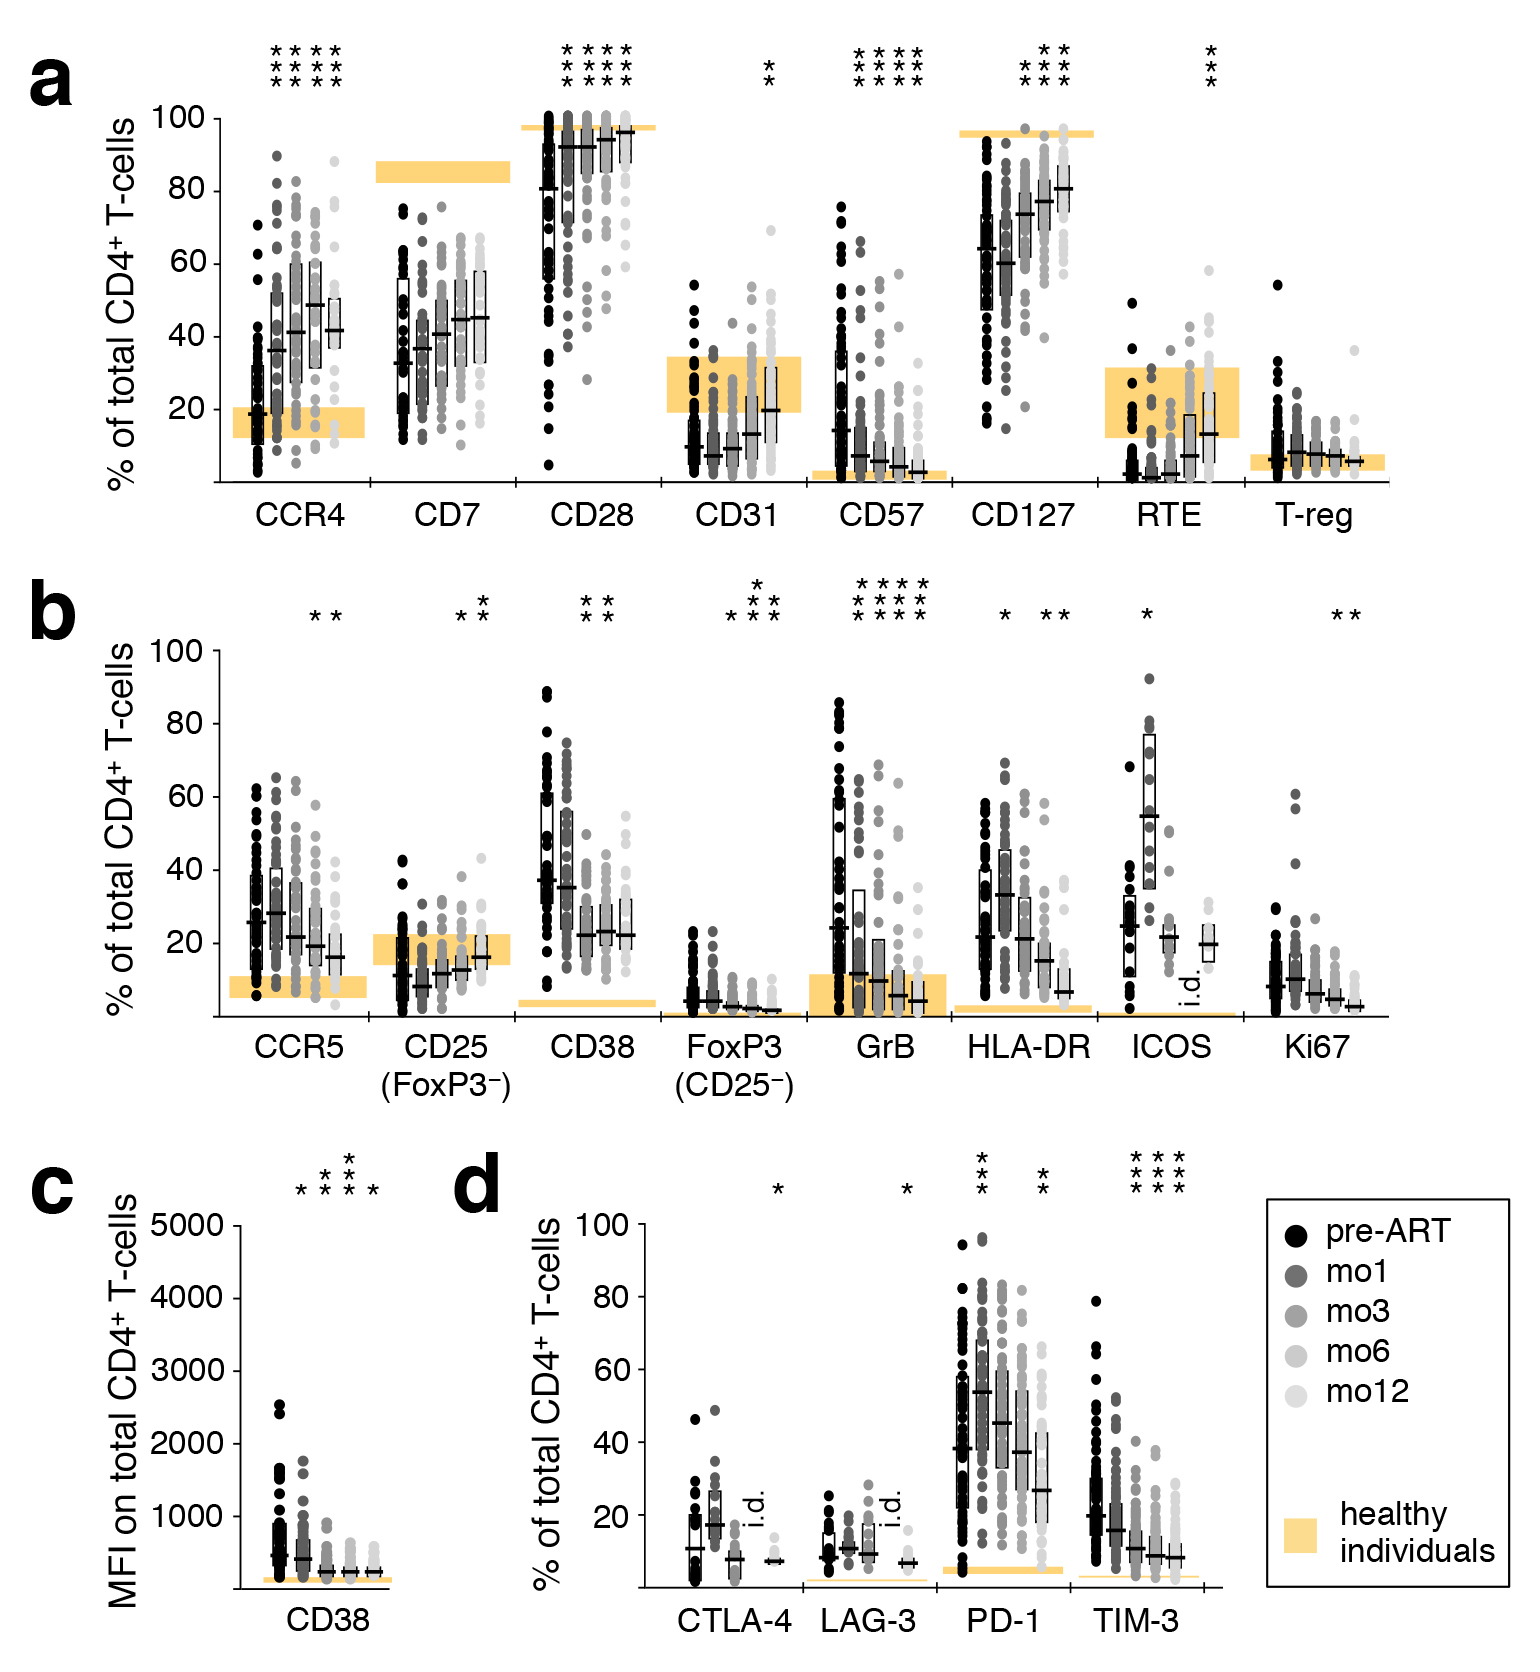
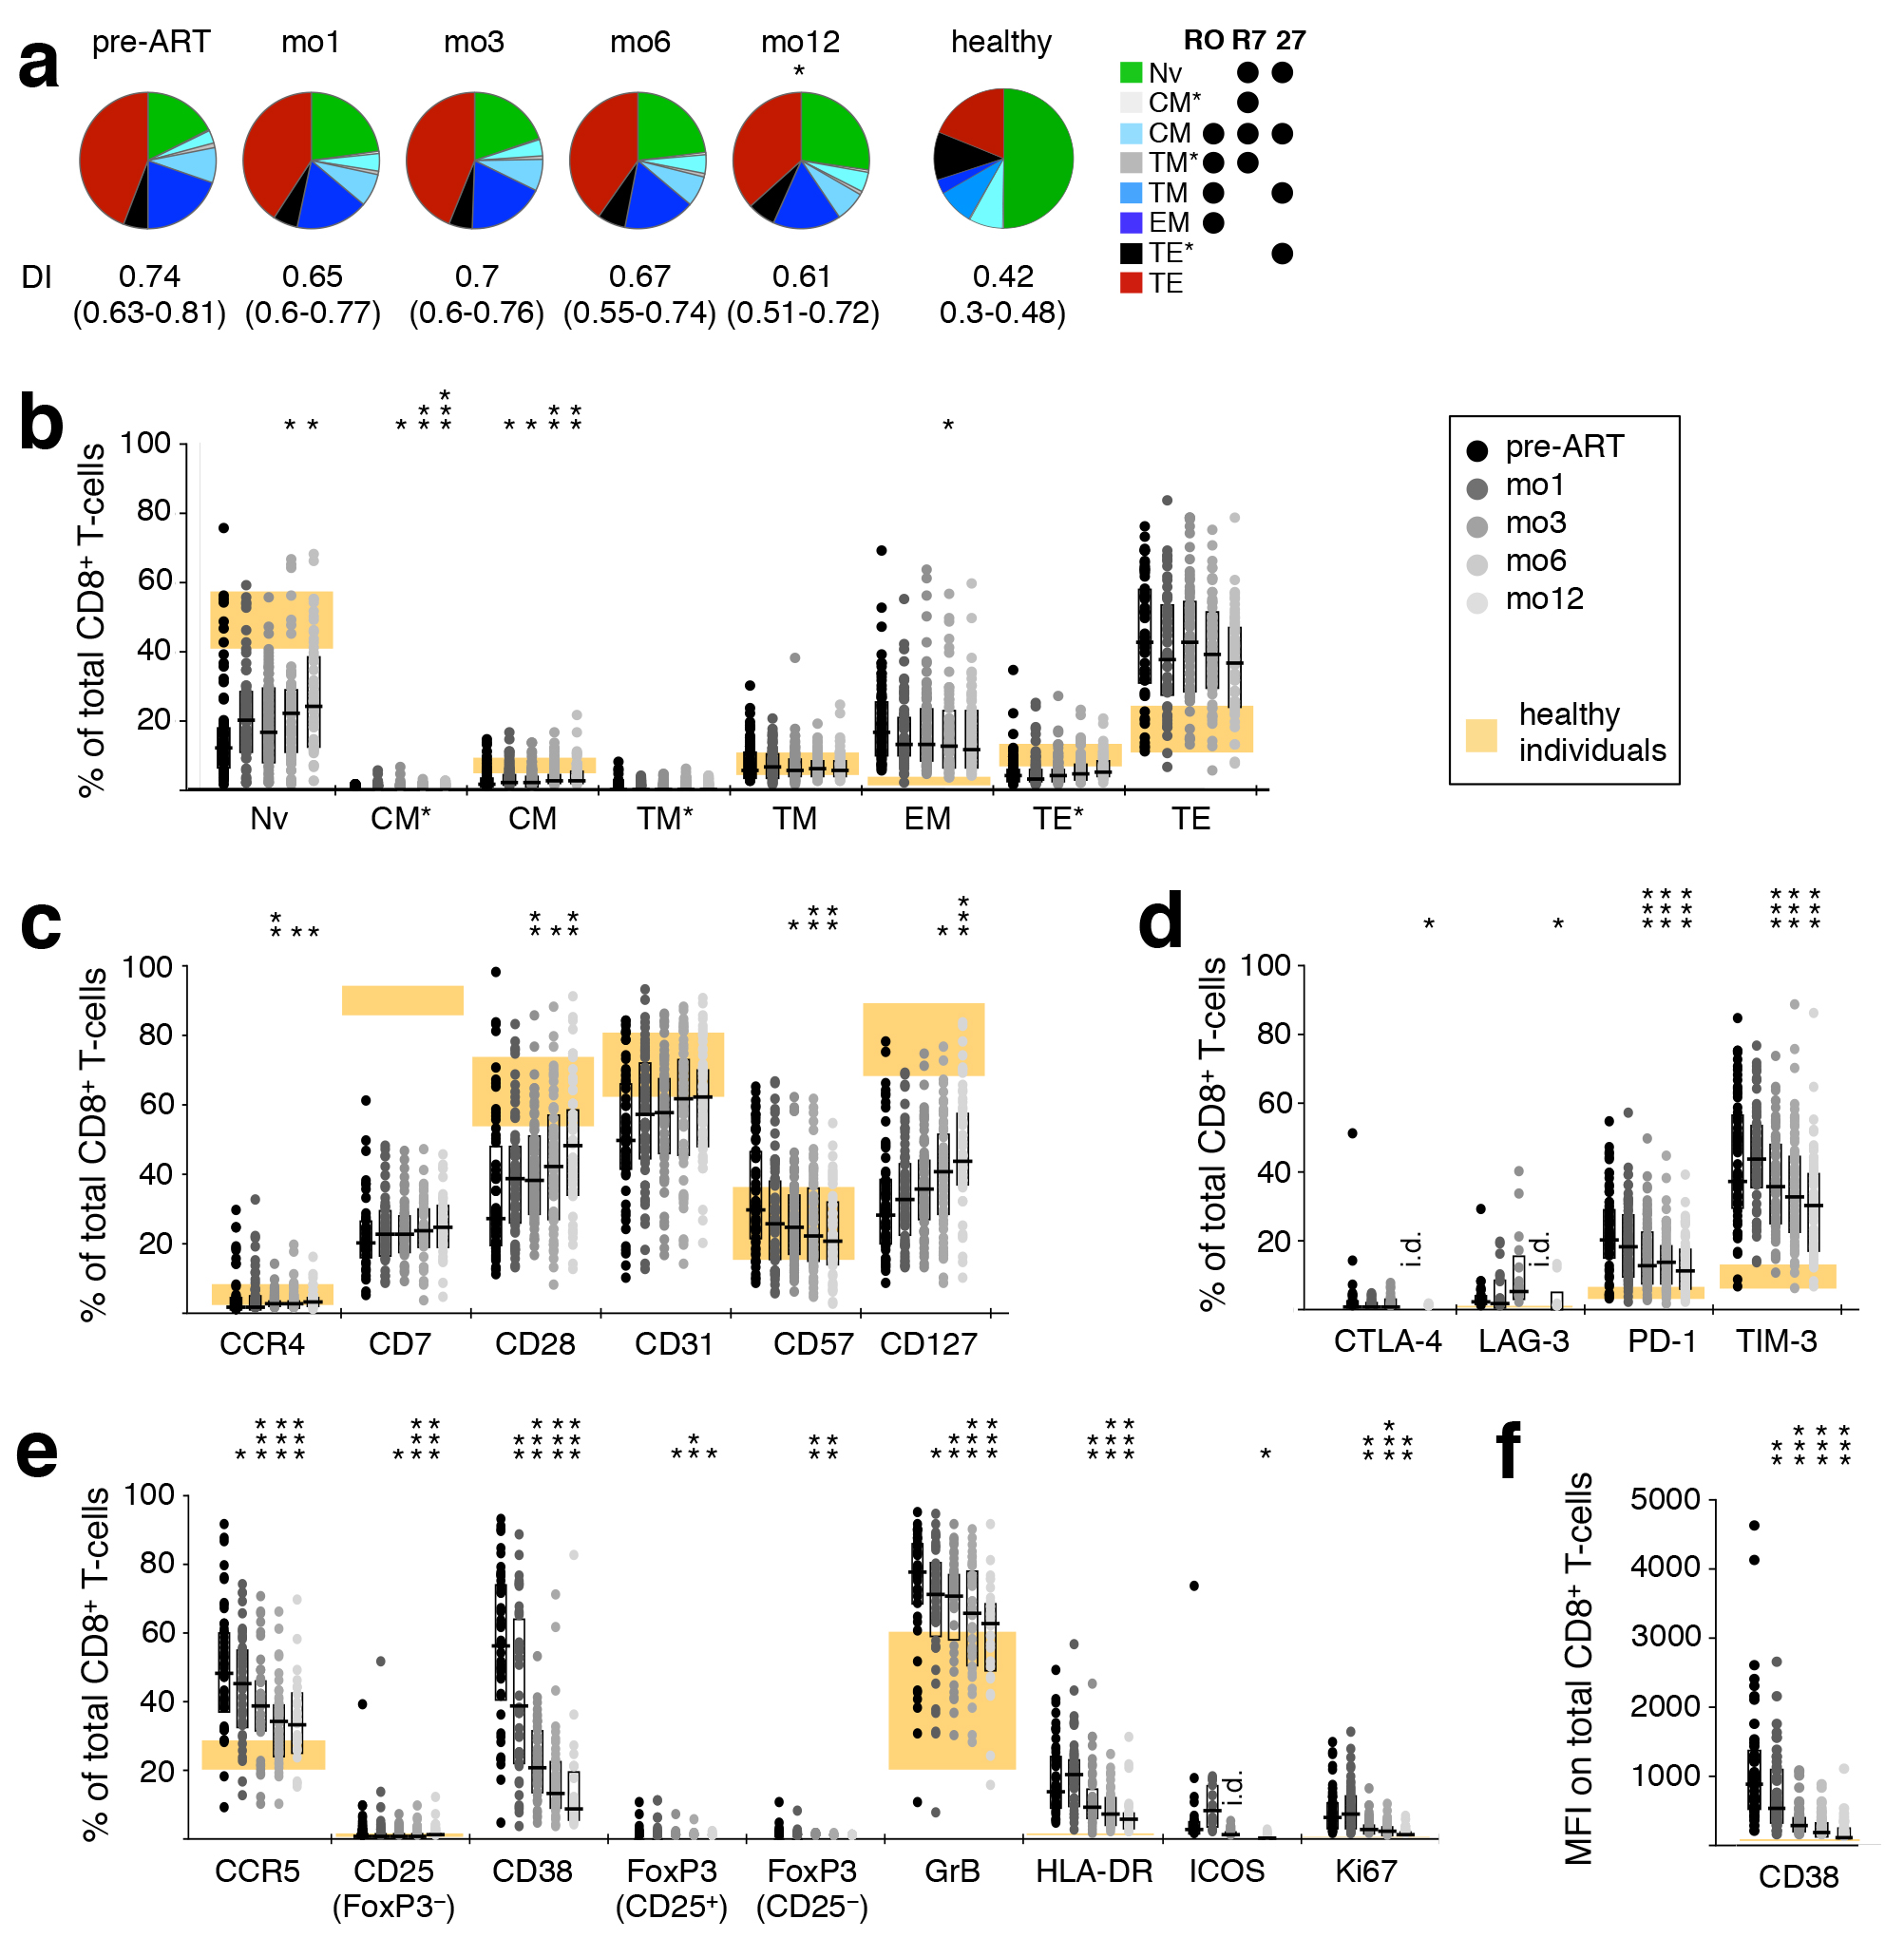
Figure 3. Reversal of CD4+ and T-cell activation during ART. Phenotypic characteristics of CD4+ T cells were analyzed by polychromatic flow cytometry in PBMC sampled before ART, as well as after 1, 3, 6, and 12 months of ART. (A) T-cell differentiation and subtypes; RTE–recent thymic emigrants. (B) Markers of activation; GrB–Granzyme B. (C) Mean fluorescence intensity of CD38. (D) Inhibitory receptors. Graphs show interquartile ranges, median bars, as well as individual data points. Orange areas represent the interquartile ranges of corresponding measurements in healthy individuals. All time-points were compared to corresponding pre-ART measurements: *P < 0.01, **P < 0.001, ***P < 0.0001. i.d.–insufficient data.
Changes in CD8+ T-cell subset distribution, though similar to those observed in CD4+ T cells, were much more subtle and only became statistically significant after many months of treatment, though some individual subsets exhibited significant changes early on (TCM*, TCM; Supplementary Figure 2A, B).
Alterations in T-cell activation phenotypes that might occur as a result of ART were comprehensively evaluated using a large range of cellular markers of T-cell differentiation, activation, and negative regulation. An ART-induced normalization of CD4+ T-cell differentiation was evidenced by a gradual increase in the frequency of cells expressing CD28 and CD127, paralleled by a down-regulation of the senescence marker CD57, as well as an increase in CD31+ cells and recent thymic emigrants (CD31+ CD45RO− CCR7+) after 1 year of therapy (Figure 3A). A concomitant decrease in CD4+ T-cell activation was indicated by decreasing frequencies of CCR5+, CD38+, GrB+, and Ki67+ cells (Figure 3B). There was also a decrease in the MFI of CD38 expression (Figure 3C); elevated expression of CD38 has been closely linked to poor prognosis in HIV-1 infection [33]. The proportion of CD4+ T cells expressing the inhibitory receptors CTLA-4, LAG-3, or TIM-3 also declined during this time (Figure 3D). Compared to healthy adults, markers of CD4+ T-cell differentiation, activation, and expression of negative regulators normalized (or trended in that direction) over 1 year of ART.
In contrast, the frequency of cells expressing CCR4 (Figure 3A), HLA-DR, ICOS (Figure 3B), and PD-1 (Figure 3D) increased to levels significantly more disparate from those observed in healthy adults. This trend was transient for HLA-DR, ICOS, and PD-1, while for CCR4 it continued for at least 1 year. Note that the CCR4-expressing cells must be predominantly against specificities other than HIV, as their numbers are substantially greater than HIV-specific CD4 T cells (Figure 1).
CD8+ T-cell differentiation and activation normalized during treatment, but much less dramatically than that of CD4+ T cells, as indicated by increased CCR4, CD28, and CD127 and decreased CD57 (Supplementary Figure 2C). The inhibitory receptors CTLA-4, LAG-3, PD-1, and TIM-3, the activation markers CCR5, CD38, FoxP3, GrB, HLA-DR, ICOS, and Ki67, as well as the MFI of CD38, all declined towards normal levels (Supplementary Figure 2D-F). Interestingly, while the phenotype of CD4+ T cells appeared to become more similar between patients over time (reduced range of activation marker expression), this was not the case for CD8+ T cells.
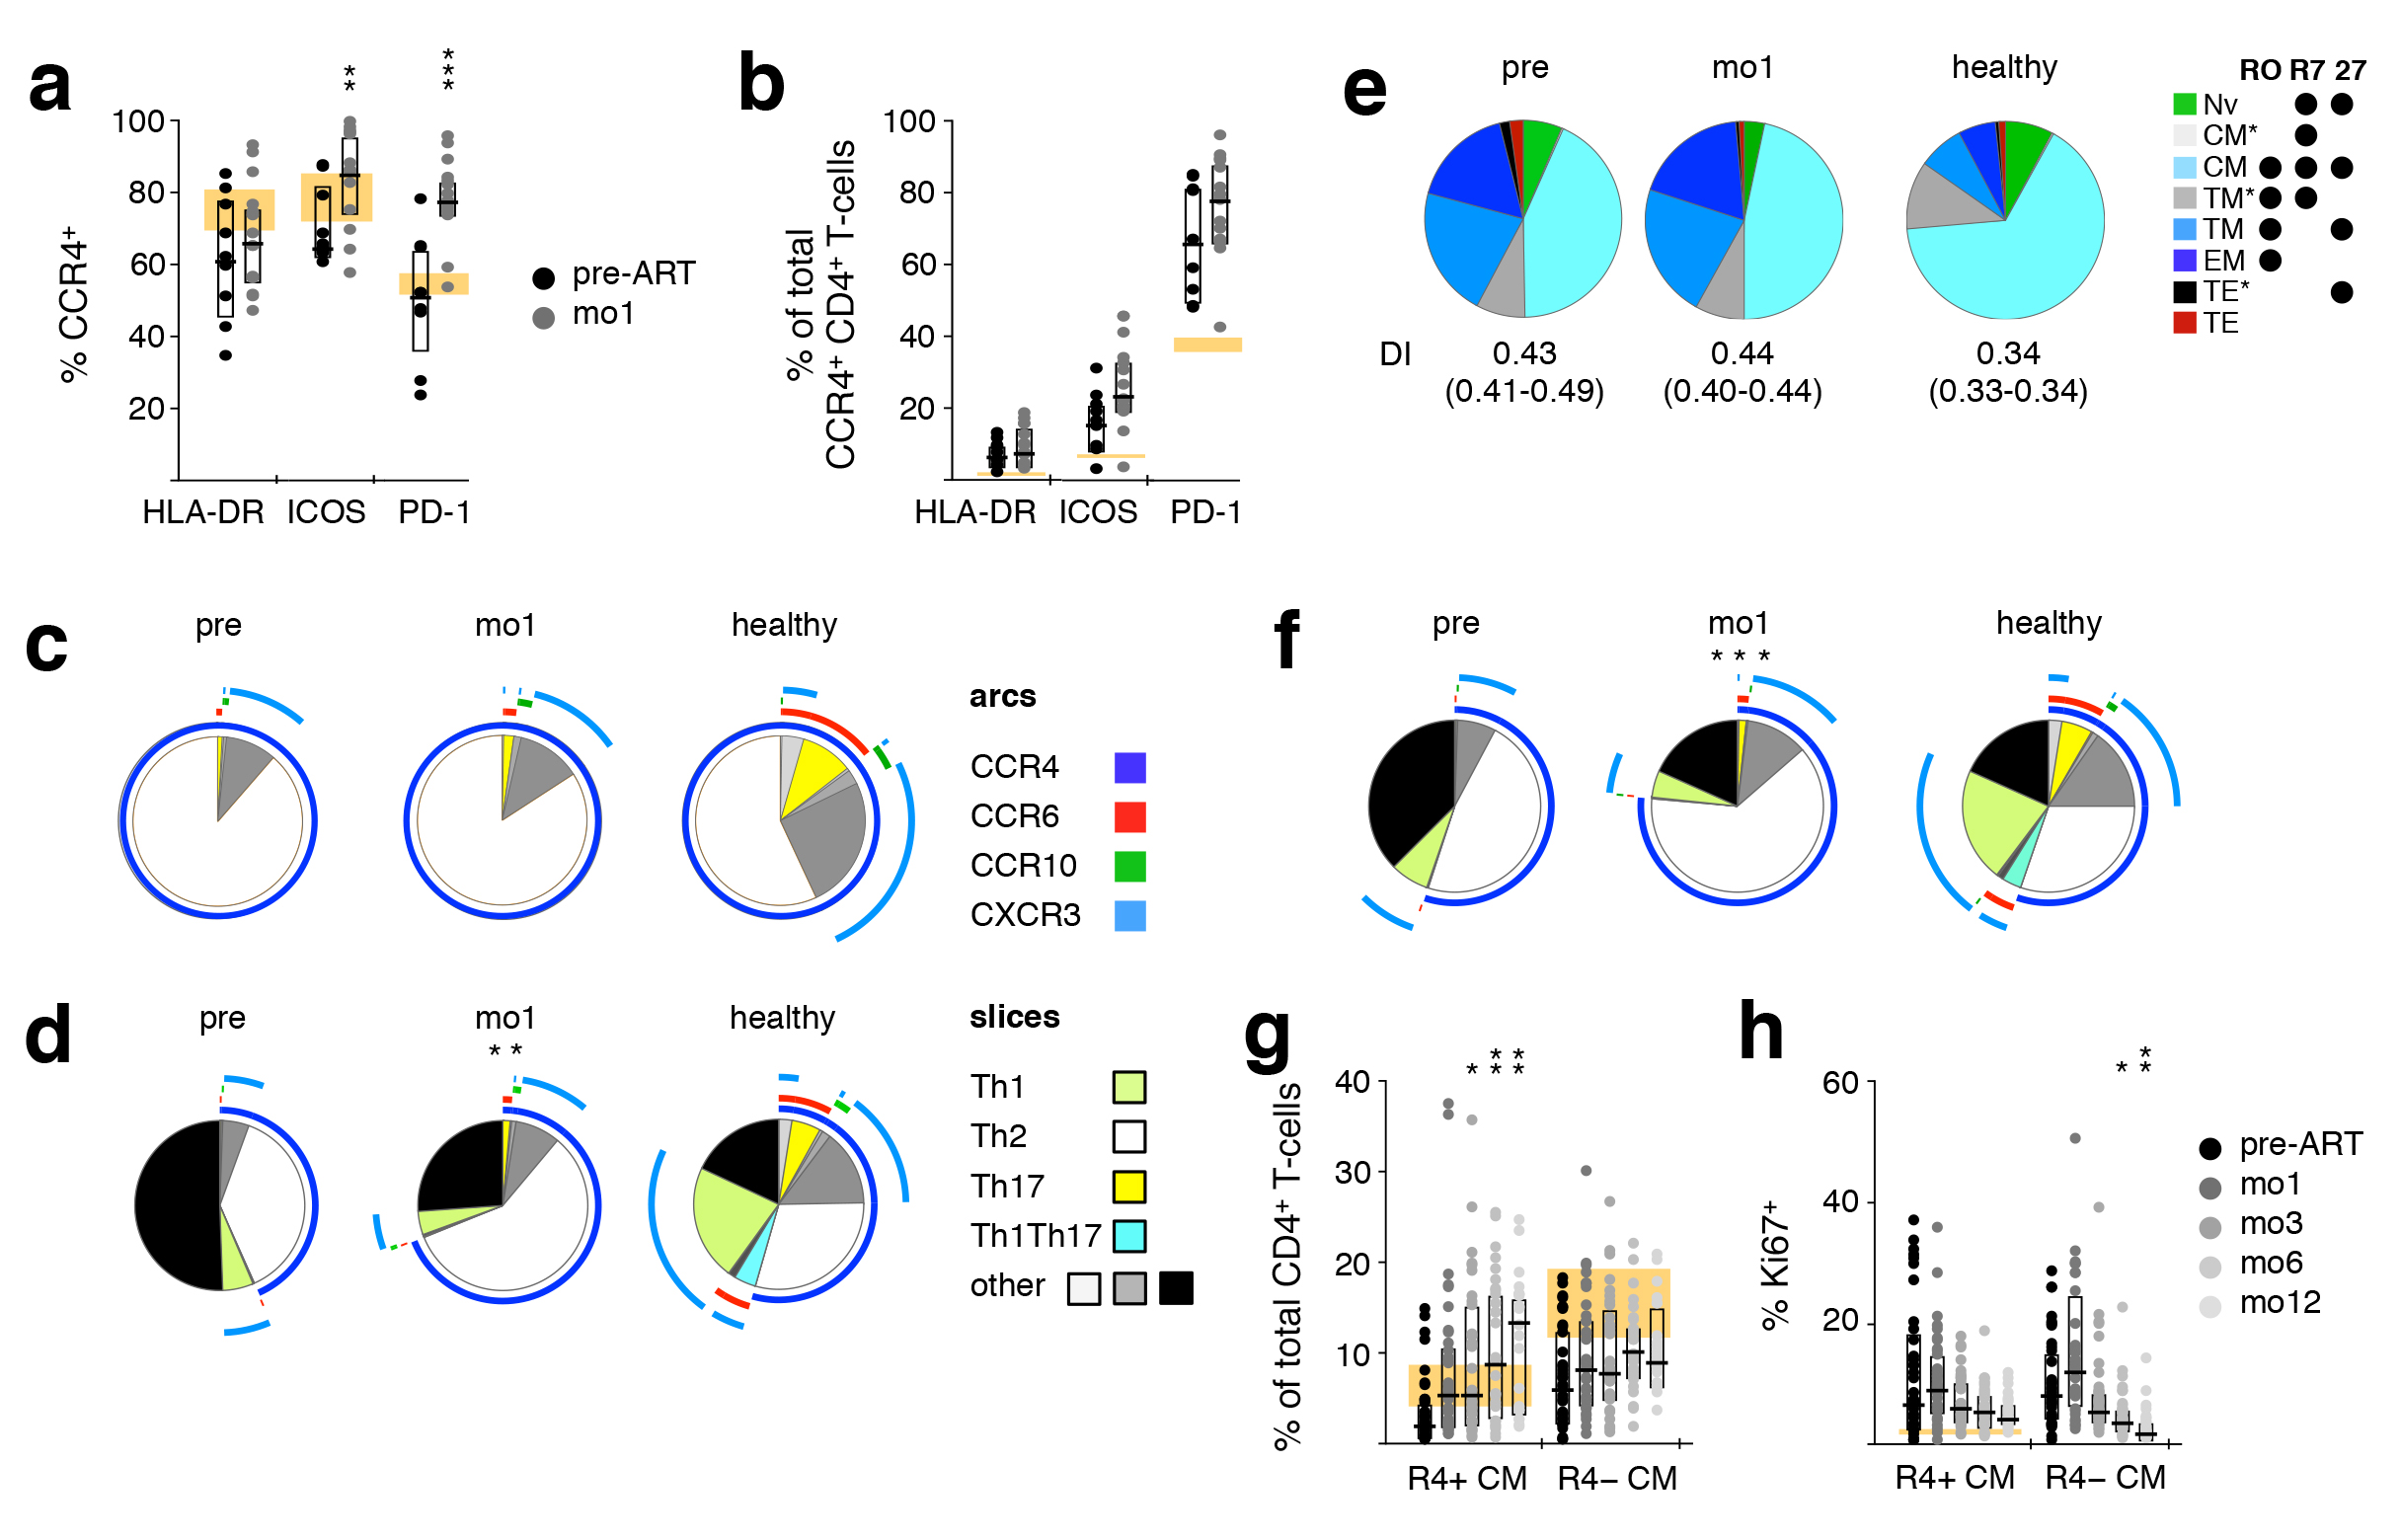
Figure 4. Early appearance of activated CCR4+ TCM in peripheral blood during ART. PBMC samples taken pre-ART and after one month of ART (mo1) were analyzed to investigate co-expression of CCR4, HLA-DR, ICOS, and PD-1 on CD4+ T cells, as well as whether these phenotypes coincide with the TCM subset. (a) Frequency of CCR4+ cells within HLA-DR+, ICOS+, and PD-1+ cells. (b) Frequency of HLA-DR, ICOS, or PD-1 expressing CCR4+ cells. Expression of Th subset-defining chemokine receptors on CCR4+ (c) or non-naïve (d) CD4+ T cells. (e) Differentiation pattern of CCR4+ cells. Differentiation indices (DI; medians and interquartile ranges) are indicated below each pie. (f) Expression of Th subset-defining chemokine receptors on TCM cells. (g) Proportion of CCR4+ TCM and CCR4− TCM over time. (h) Expression of the proliferation marker Ki67 in CCR4+ TCM and CCR4 − TCM over time. Bar graphs show interquartile ranges, median bars, as well as individual data points. The interquartile range of given phenotypes (orange areas in bar charts) or average distribution patterns (pie charts) in healthy donors are shown. Mo1 measurements were compared to corresponding pre-ART values: *P < 0.01, **P < 0.001, ***P < 0.0001.
In contrast to all the other measured parameters, the expression of CCR4, HLA-DR, ICOS, and PD-1 on CD4+ T cells increased upon ART initiation, becoming more disparate from levels observed in healthy donors. Thus, we investigated co-expression of these molecules pre-ART and at mo1 of ART in HIV-1+ individuals, as well as in healthy donors. Even in healthy individuals, a large proportion of HLA-DR+, ICOS+, and PD-1 + CD4+ T cells expressed CCR4. In HIV-1+ patients, the CCR4+ fraction of ICOS+ and PD-1+ cells significantly increased shortly after commencing ART (Figure 4A). In contrast, even though the frequency of activated CCR4+ CD4 + T cells was more elevated in HIV-1+ patients compared to healthy donors, as measured by the expression of HLA-DR, ICOS, and PD-1, the introduction of ART did not significantly alter the proportion of activated cells (Figure 4B) or the co-expression pattern of these three activation markers (unpublished data). Taken together, these results show that the increase of HLA-DR+, ICOS+, and PD-1+ CD4 + T cells is due to the increase in activated CCR4+ cells.
Though the Th1/Th2 dichotomy, and wider Th-subsetting, of CD4+ T cells is less applicable in humans than in mice where it was first described, this system allows the identification of cellular subsets that are associated with specific functions. Hence, we here make use of the phenotypically and functionally described Th-subsets, referring to them as “ThX-like” where possible.
The increased prevalence of CCR4 on CD4+ T cells after ART initiation led us to investigate the relative representation of functionally distinct T-helper subsets prior to and during ART, as CCR4 is preferentially expressed on Th2-like cells. To this end, the expression pattern of CCR4, CCR6, CCR10, and CXCR3 was analyzed in order to identify cells reminiscent of Th1 (CCR4−, CCR6−, CXCR3+) [34-36], Th2 (CCR4+, CCR6−, CXCR3−) [36 ,37], Th17 (CCR4+, CCR6+, CXCR3−) [38], as well as Th1Th17 cells (CCR4−, CCR6+, CXCR3+) capable of producing both IFN-γ and IL-17 [38] (Supplementary Figure 3). Th9- (CCR4−, CCR6+, CXCR3−) and Th22-like cells (CCR4+, CCR6 +, CCR10+) [39] can also be defined using the present chemokine receptors, but these populations were too infrequent to be robustly quantifiable.
In accordance with CCR4 being preferentially expressed on Th2-like cells [40], the majority of CCR4+ CD4+ T cells did not express any of the other chemokine receptors analyzed. In HIV-1+ patients, most CCR4+ cells were thus defined as Th2-like cells, and their composition was not affected by ART (Figure 4C). However, the fraction of non-naïve CD4+ T cells expressing a Th2-like phenotype increased significantly after the induction of ART, while the proportion of Th1-like cells was relatively low in HIV-1+ patients at both time-points (Figure 4D).
Because a hallmark of ART-induced immune reconstitution is the early rise in the number and frequency of CD4+ TCM [41], we investigated how the Th subsets, in particular Th2-like cells, correlated with this phenotype. As seen with total CD4+ T cells, the differentiation pattern of CCR4+ CD4+ T cells was biased towards a more differentiated population in HIV-1+ individuals. After 1 month of ART, this pattern, as well as the DI, remained unchanged, with TCM representing close to 50% of CCR4+ cells (Figure 4E). While in healthy individuals CD4+ TCM cells harbored balanced proportions of Th1-, Th2-, Th17-, and Th1Th17-like cells, in HIV-1+ patients this population was biased towards a Th2-like phenotype. Unlike most other changes we observed within the CD4+ T-cell compartment, this altered representation was dramatically exacerbated by ART initiation (Figure 4F). The co-expression pattern of HLA-DR, ICOS, and PD-1 on CD4+ TCM closely mimicked that of CD4+ CCR4+ cells and was not affected by ART. This indicates that the observed early increases of CD4+ CCR4+ T cells and CD4+ TCM largely identify the same population. Indeed, CCR4+ TCM increased in frequency upon ART initiation, while CCR4−TCM did not (Figure 4G). Notably, proliferation, as measured by the expression of Ki67, did not appear to be the primary mechanism for this perceived expansion (Figure 4H).
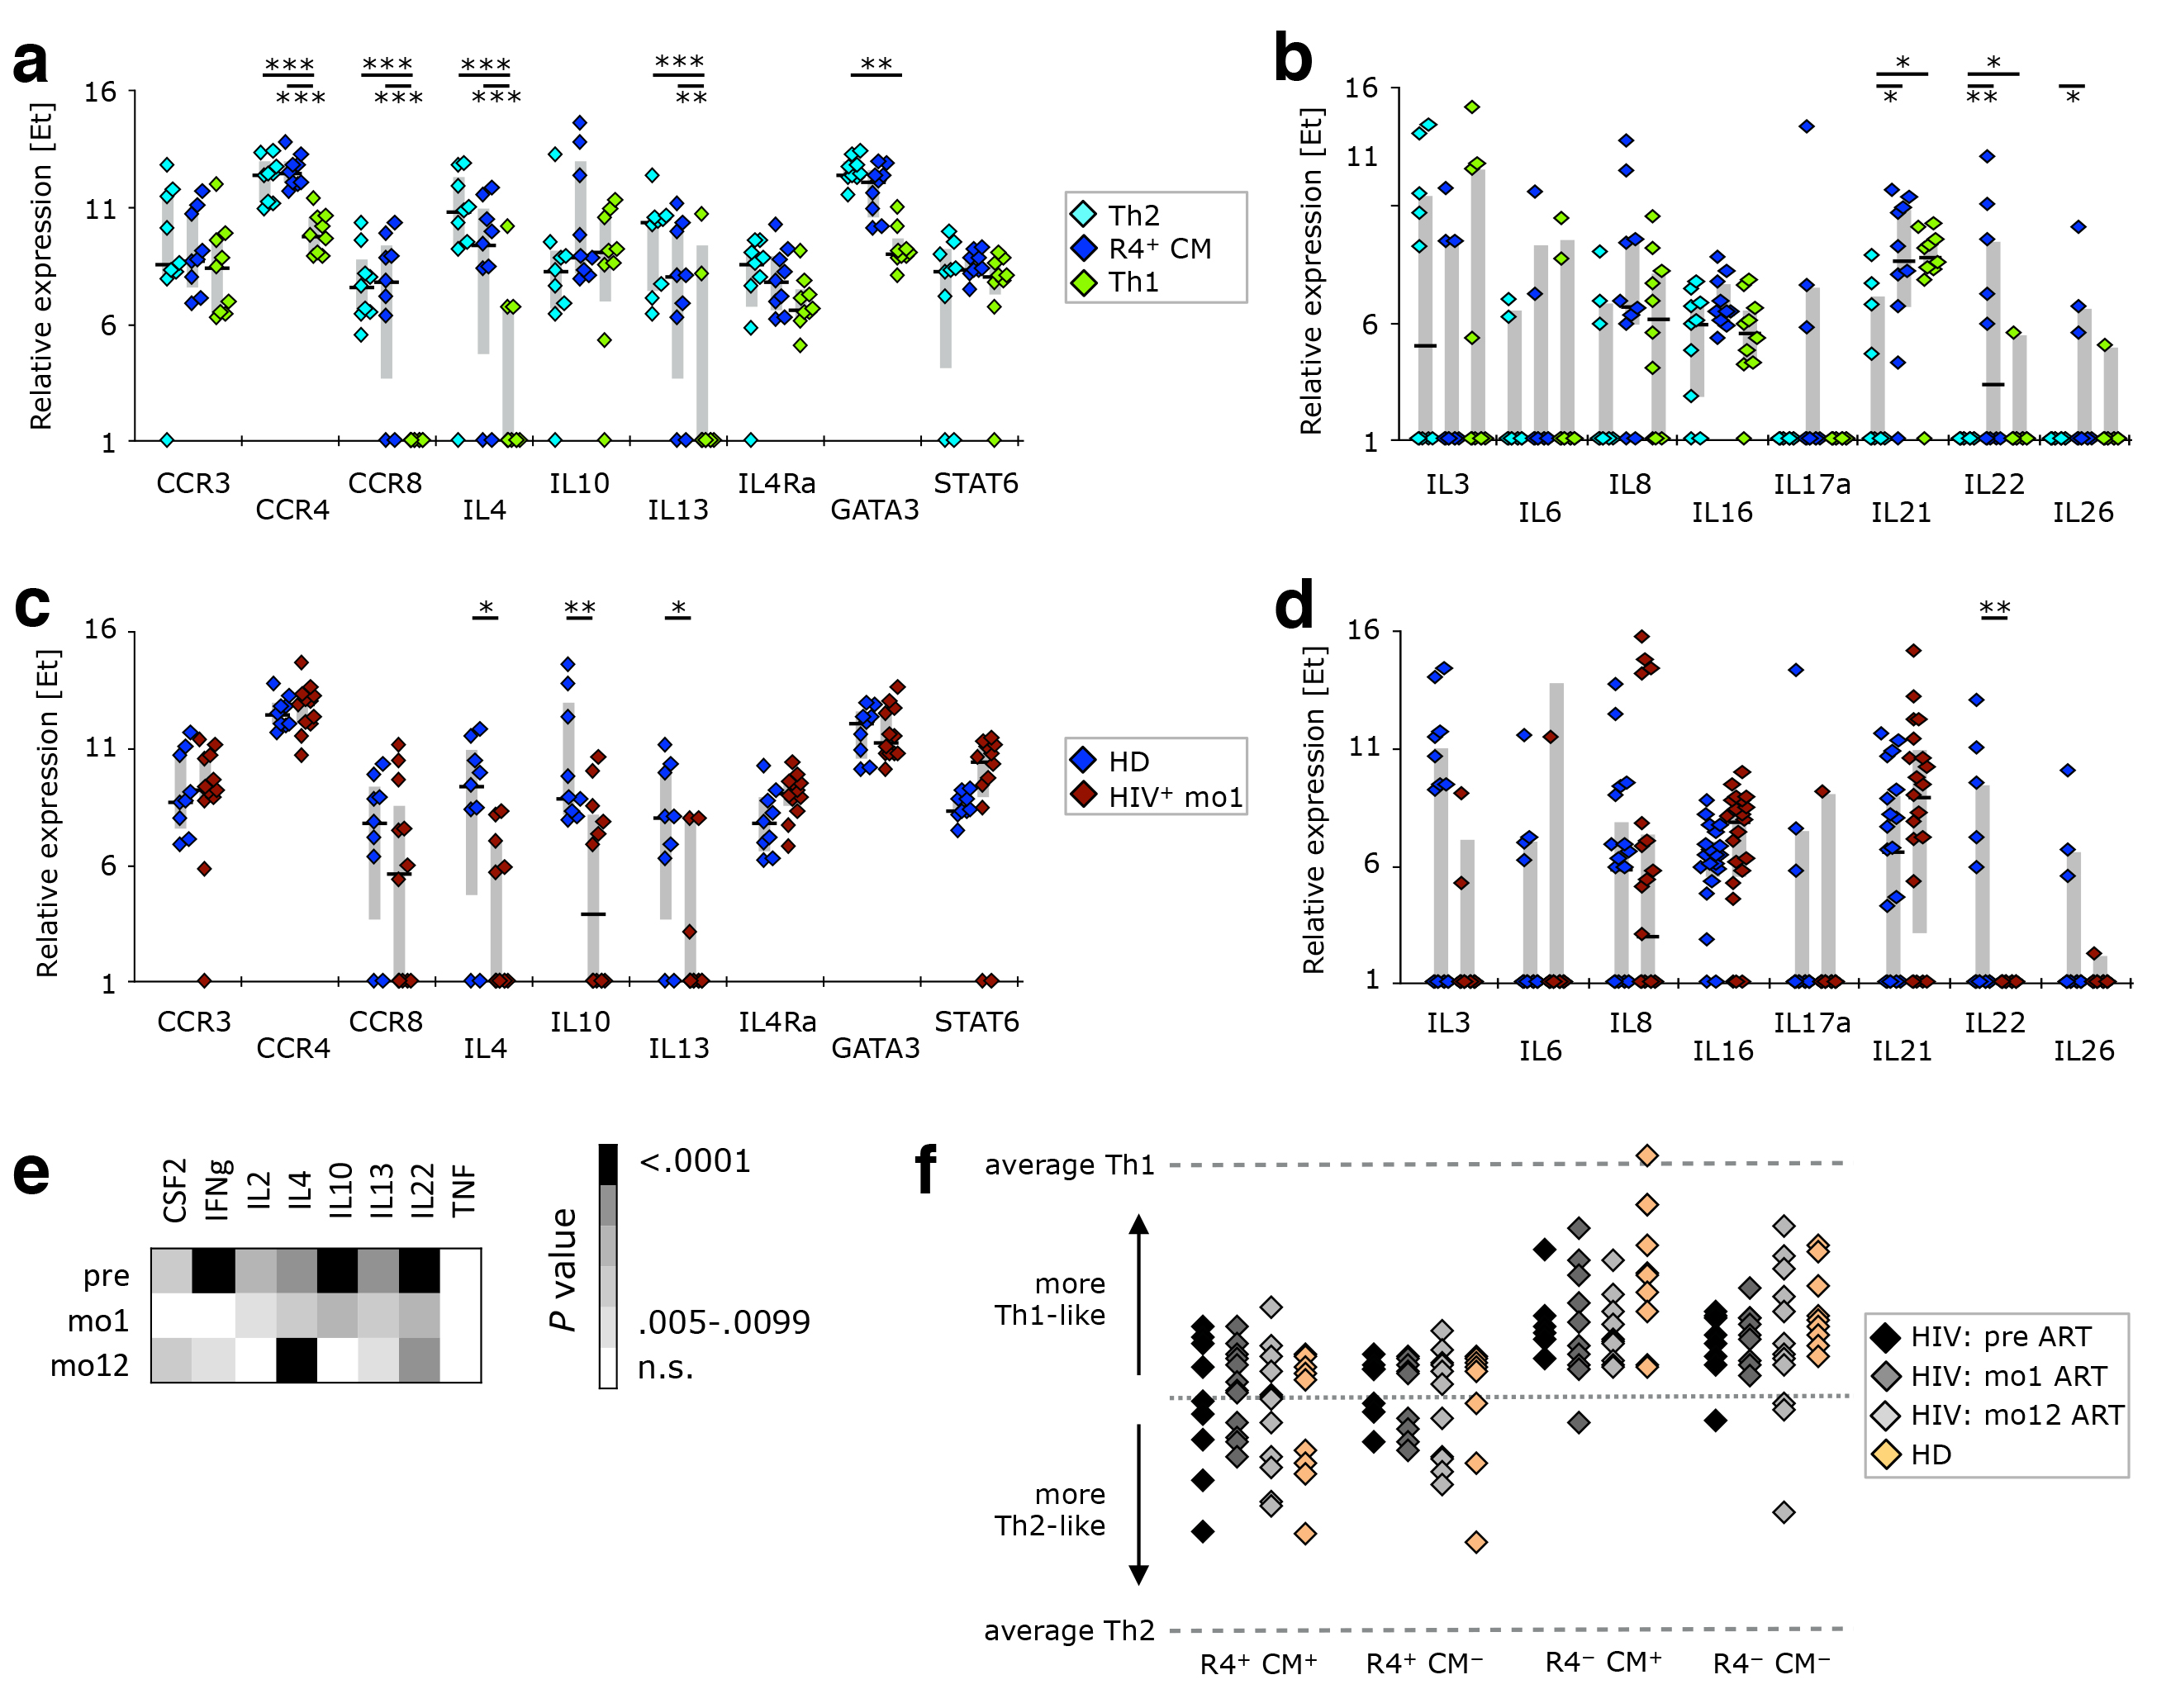
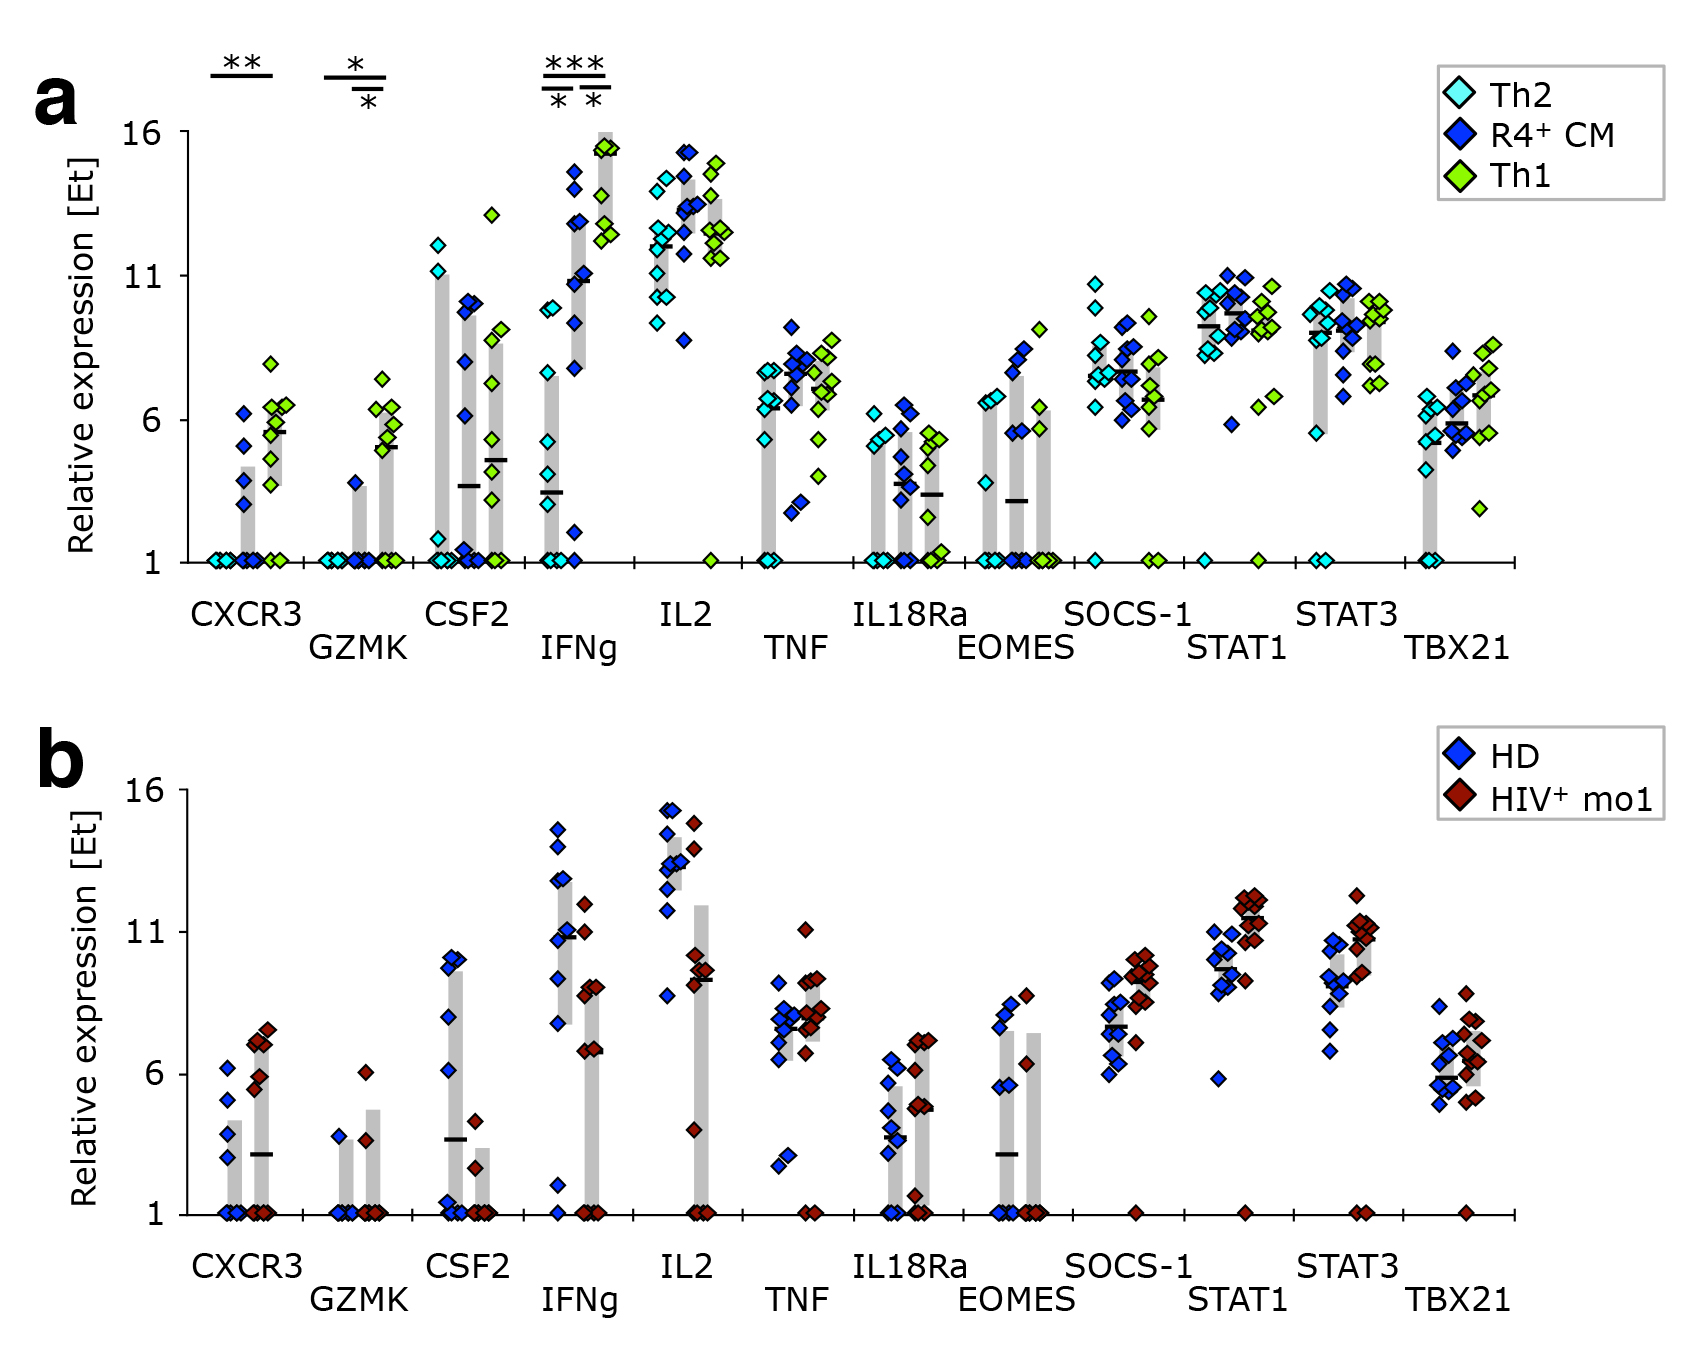
Figure 5. The gene expression profile of CCR4+ TCM is different from that of Th2-like cells. PBMC from healthy donors, as well as cells isolated before or after 1 or 12 months of ART from HIV-1-infected adults were stained with the “sorting” panel (Supplementary Table 1). Subsets of CD4+ T cells were sorted as indicated in Supplementary Figure 4 and their gene expression profiles determined by multi-parametric quantitative RT-PCR. (A) Th2-associated and (B) other cytokine genes were compared in Th2-like, CCR4+ TCM, and Th1-like cells isolated from healthy donors. CCR4+ TCM from HIV-1+ patients after 1 month of ART were compared to their counterparts from healthy donors in respect to expression of (C) Th2-associated or (D) other cytokine genes. (E) The expression profile of cytokine genes was investigated in non-naïve cells. Relative expression in HIV-1-infected individuals before ART, after 1 month of ART, or 1 year of ART was compared to that in healthy donors. (F) The overall gene expression pattern of CCR4+ TCM, CCR4+ TCM−, CCR4− TCM, and CCR4− TCM− cells was compared to that of Th1- or Th2-like cells sorted from healthy donors. Their calculated “Th-ness” is expressed as a point between those two extremes. Bar graphs show interquartile ranges, median bars, as well as individual data points. Statistically significant differences are indicated: *P < 0.01, **P < 0.001, ***P < 0.0001.
To investigate whether CCR4+ TCM are bona fide Th2-like cells, we compared the transcriptional profile of CCR4+ TCM, Th2- and Th1-like SEB-reactive CD4+ T cells from healthy donors. CCR4+ TCM indeed closely resembled Th2-like cells in respect to the expression of Th2- (Figure 5A) and Th1 -associated genes (Supplementary Figure 5), as well as most of the other cytokine genes investigated (Figure 5B). The only genes differentially expressed in these two cellular populations were IL21 and IL22 (both positive in CCR4+ TCM), the latter of which is typically produced by Th17- and Th22-like cells [42, 43]. CCR4+ TCM are unlikely to be Th22-like, however, as their levels of IL4 and IFNg transcripts are similar to those of Th2- and Th1-like cells, respectively, neither of which is produced by Th22 [44]. Unlike Th2- or Th1-like cells, CCR4+ TCM demonstrated some IL17a expression. This, together with expression of IL21 and IL22, suggests that these cells might contain an important fraction of cells with Th17-like functionality, even though chemokine receptor expression reveals only a small fraction of cells with a Th17-like phenotype (CCR4+ TCM have a chemokine receptor expression pattern comparable to total CCR4+ cells (Figure 4C).
CCR4+ TCM cells isolated from HIV-1 infected individuals one month after ART initiation had a transcriptional profile similar to that of healthy donors with respect to Th2- (Figure 5C) and Th1-associated genes (Supplementary Figure 5), as well as most other cytokine genes investigated (Figure 5D). However, there was evidence of reduced Th2-type cytokine transcript levels, as well as of IL22. This cytokine deficiency was not restricted to CCR4+ TCM cells or Th2-associated cytokines. We found that total non-naïve cells from ART-naïve HIV-1 patients expressed lower levels of CSF2, IFNg, IL-2, IL-4, IL-10, IL-13, and IL-22 mRNA transcripts (Figure 5E).
When considering all measured genes, CCR4+ cell populations (both TCM and non-TCM) were mixed in terms of having a more Th1- or Th2-like gene expression profile, while CCR4− samples were mostly Th1-like (Figure 5F).
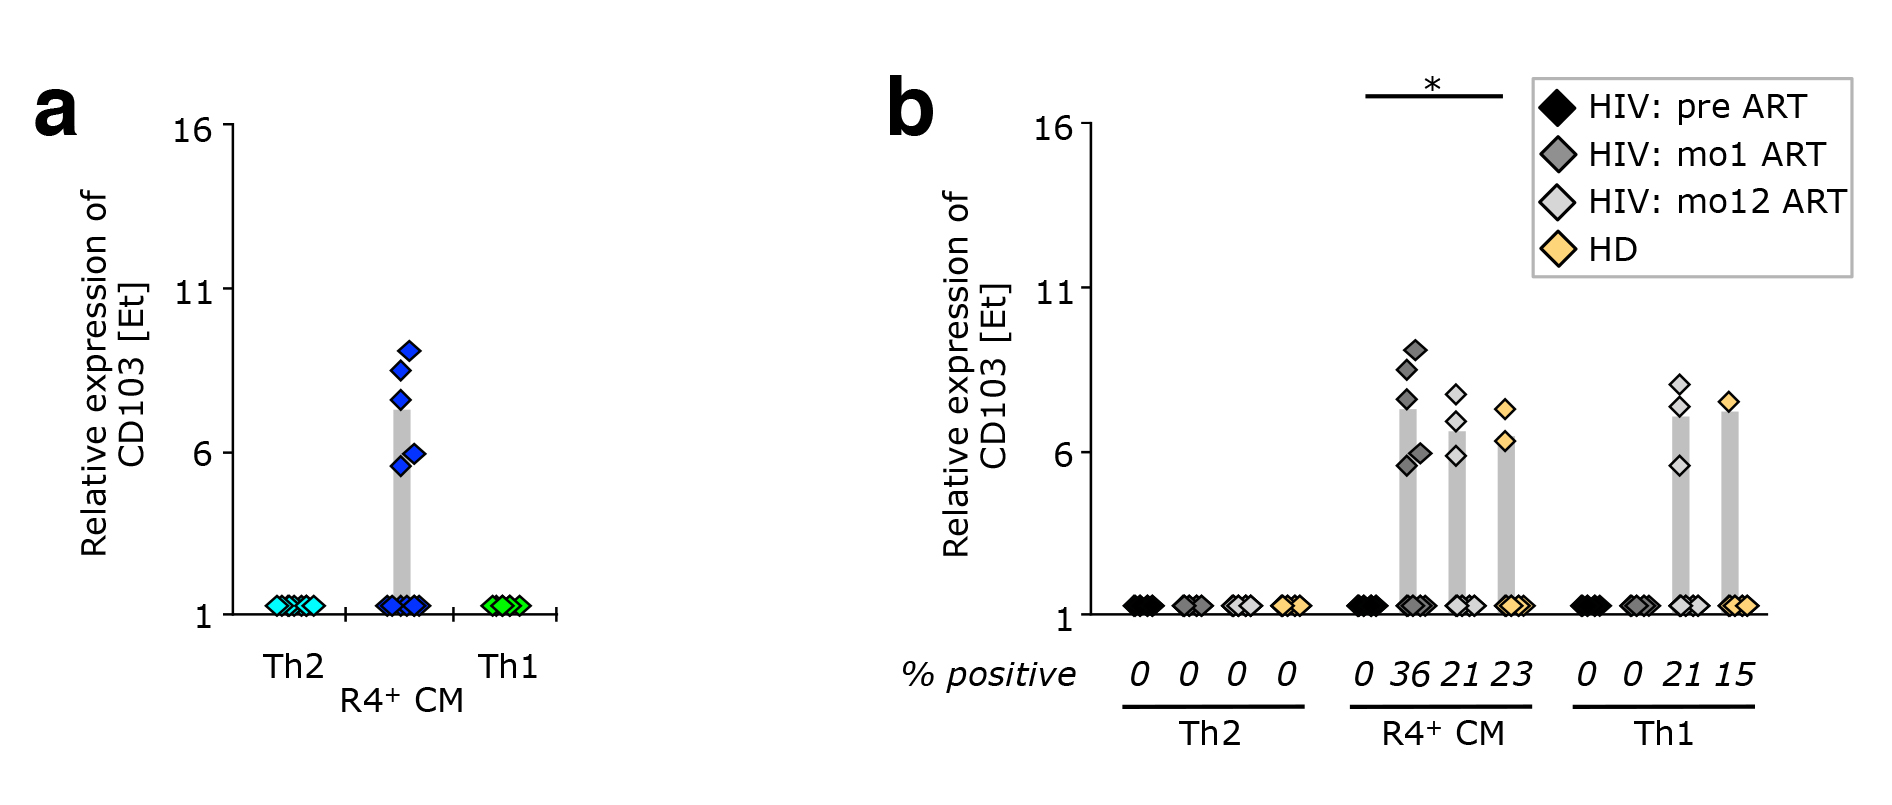
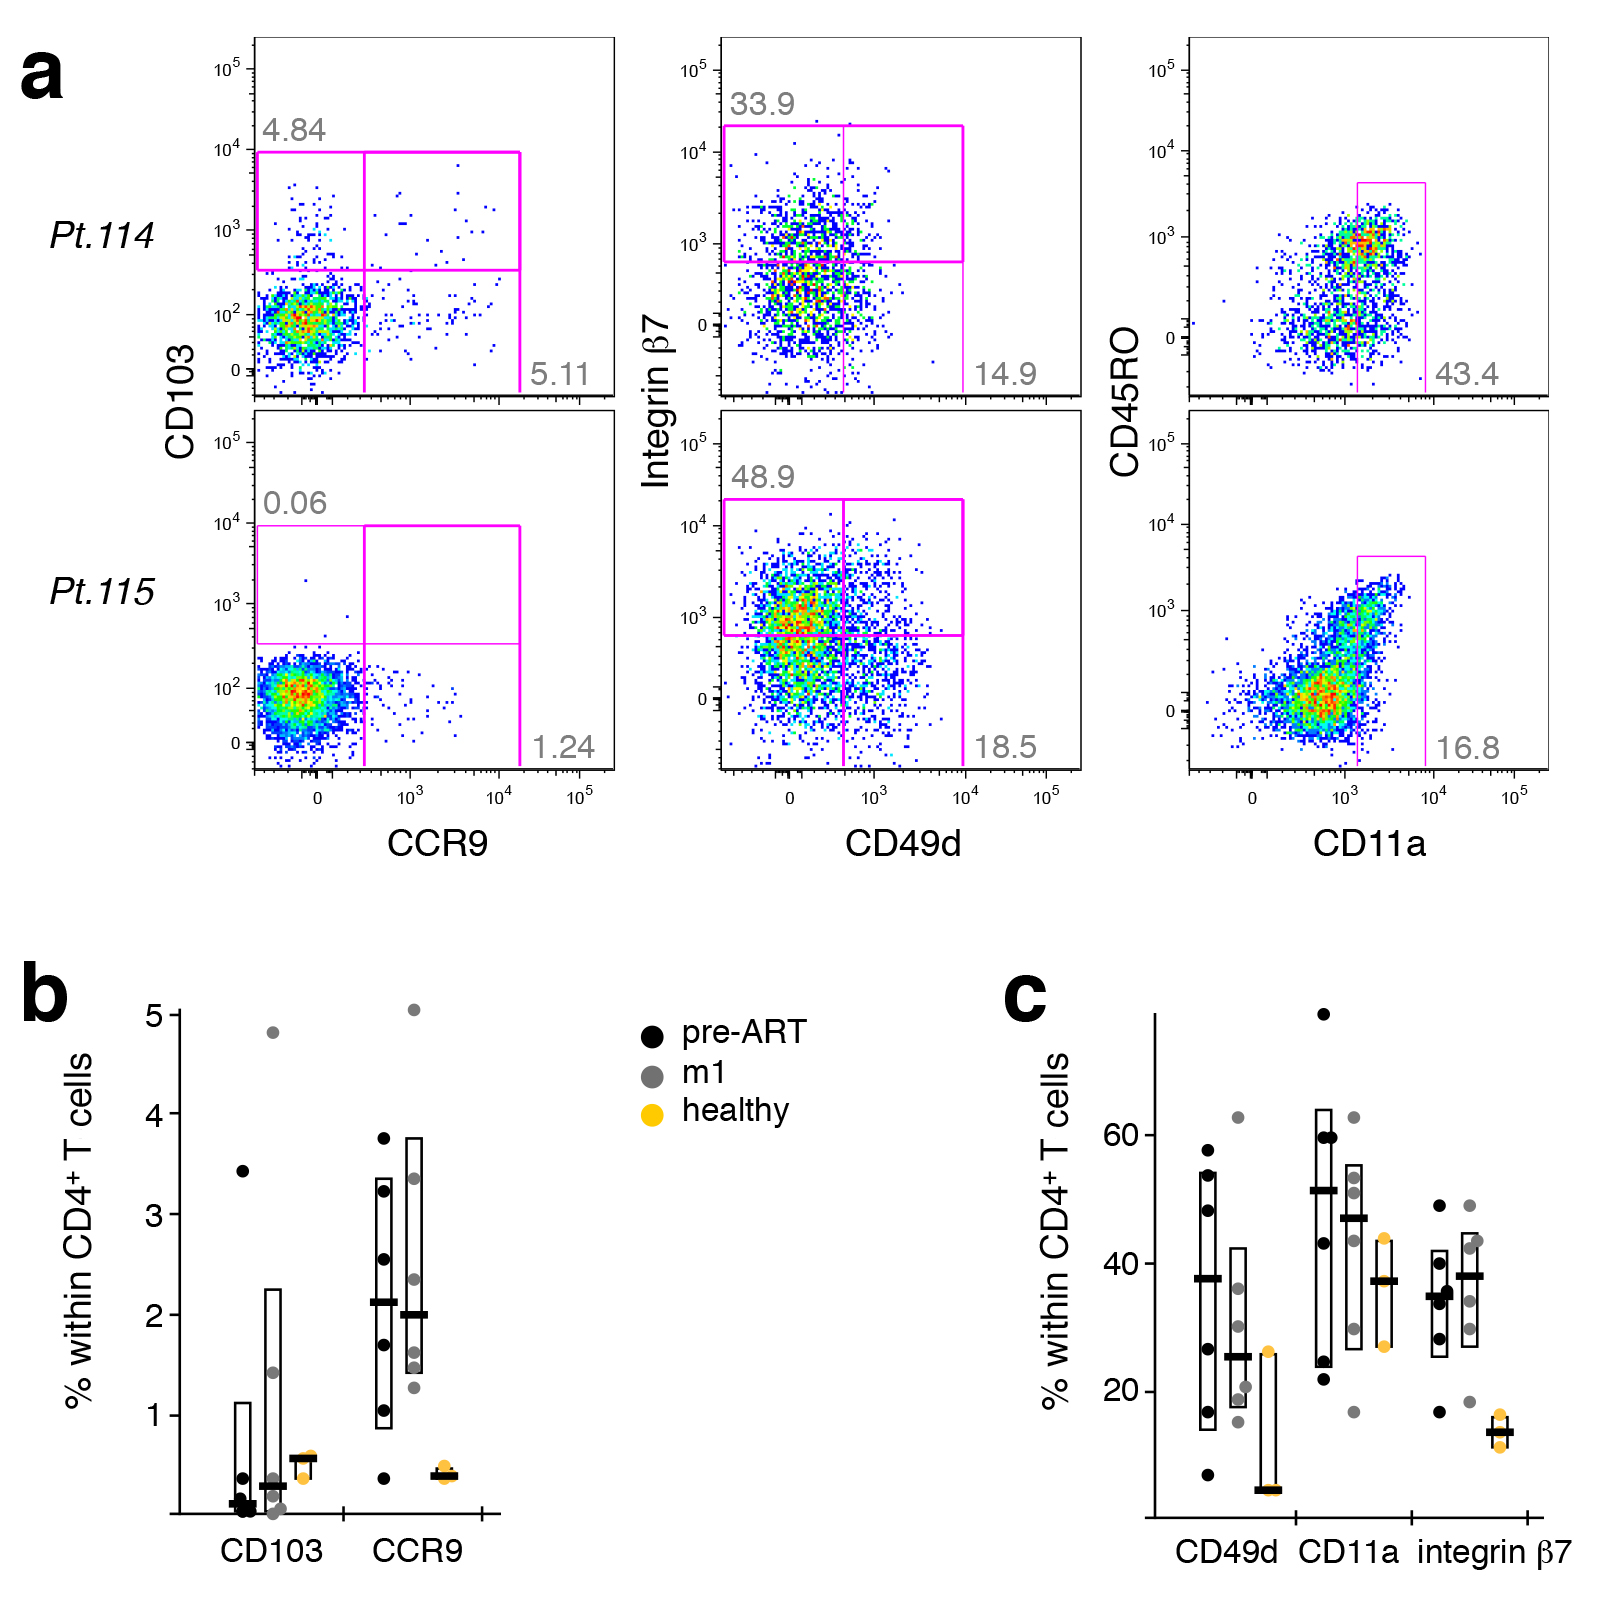
Figure 6. CCR4+ TCM appear to be released from peripheral tissue sites upon ART initiation. PBMC from healthy donors, as well as cells isolated before or after 1 or 12 months of ART from HIV-1-infected adults were stained with the “sorting” panel (Supplementary Table 1). Subsets of CD4+ T cells were sorted as indicated in Supplementary Figure 4 and their gene expression profiles determined by multi-parametric quantitative RT-PCR. (A) CD103 expression on Th2-like, CCR4+ TCM, and Th1-like cells isolated after 1 month of antiretroviral therapy. (B) Expression of CD103 in CCR4+ TCM, Th2-, and Th1-like cells from healthy donor PBMC (n = 9), and longitudinal samples from HIV-1 patients (n = 12). Bar graphs show interquartile ranges, median bars, as well as individual data points. Statistically significant differences are indicated: * P < 0.01, ** P < 0.001, *** P < 0.0001.
Strikingly, in PBMC from HIV-1 infected patients having received ART for one month, the integrin
There was a discordance in mRNA and protein expression of CD103, which might explain why this aberrantly expanding cellular subset was not identified previously. Down-regulation of CD103 (and other homing markers) typically occurs in a larger fraction of tissue-resident CD4+ TCM, likely heralding their release into peripheral blood (where we detected them). Maintenance of CD103 mRNA would allow for a rapid re-expression of CD103 proteins and a subsequent return to peripheral tissues.
We investigated the cell surface expression of several migration molecules on CD4+ T cells and found varied expression patterns between patients. HIV-1 patients appeared to have somewhat lower levels of CD103+ cells than healthy donors, while exhibiting higher levels of CCR9+ and integrin b7+ cells (Supplementary Figure 6). This was the case both pre-treatment and after 1 month of ART. Within CD4+ T cells, CD103 seemed to be preferentially expressed on CCR4+ cells.
We characterized the phenotypic and functional T-cell dynamics in peripheral blood of severely immuno-compromised HIV-1+ individuals following ART. Our data confirm previous findings of an early increase in TCM cells, as well as a gross reduction in overall activation levels. Almost all markers investigated, whether involved in T-cell differentiation, activation, or negative regulation, started normalizing early after ART initiation. These changes were most dramatic in CD4+ T cells, but mirrored by similar changes in CD8+ T cells, which retained a larger range of individual marker expression than CD4+ T cells.
In contrast to the general trend towards normalization, CD4+ T-cell activation (HLA-DR, ICOS, PD-1) initially increased in peripheral blood before gradually decreasing, too. CCR4+ cells demonstrated a more sustained increase, reflecting a skewing towards a Th2-like environment early after ART initiation, and a further deregulation away from the phenotype of healthy donors.
A shift from cells with Th1- to those with Th2-like functionality has previously been suggested to occur during HIV-1 infection [45-47]. It has been reported that long-term non-progressors exhibit a Th1-like cytokine profile, while progressors exhibit a Th2-like cytokine profile [47], and that increasing viral loads correlate with lower cytoplasmic levels of IL-2 and IFN-γ and concomitant increases in IL-4 and IL-10 levels after
stimulation with PMA/ionomycin [46]. Also, certain IL-4R
Early studies have shown that CD4+ TCM are released from tissues into the bloodstream early after commencing ART [4], leading to the initial boost in CD4 counts. The present data suggest that these CD4+ TCM are primarily CCR4+. Thus, the CCR4+ TCM cells appearing in the PBMC upon ART do not reflect a phenotypic change of cells preexisting in the blood stream—that is, an ART-induced change in the Th environment—but rather the appearance of a cell type previously sequestered in the tissues [50, 51].
This is supported by our findings that, after one month of therapy, CD103 transcripts were specifically expressed by CCR4+ TCM, while
no expression was detected in any of the subsets investigated prior to ART. The
Early after ART commencement, while PVL levels were still in the decline, these CCR4+ TCM were highly activated, expressing ICOS, HLA-DR, and PD-1. As the PVL were suppressed to undetectable levels at mo3 of ART, the activation of CCR4+ TCM also leveled off. However, there was no normalization of the Th2-like phenotype (% CCR4+ CD4+ T cells), even 1 year after ART.
Gene expression analyses confirmed that the CCR4+ TCM cells are largely comparable to classic Th2 cells in their Th1- and Th2-associated transcriptome. However, the fact that CD103 mRNA was detected in CCR4+ TCM but not Th2-like cells indicated that the cells released from tissues are not classical Th2-like cells. Expression of IL21 and IL22 (and to a lesser degree IL17a) transcripts, cytokines not typically associated with Th2-like cells, suggests that the CCR4+ TCM contains a fraction of cells with a Th17-like functionality. Such cells are important in controlling bacterial infections at mucosal surfaces such as the gut and lungs [53]; the measured Th17-like functionality correlates well with expression of CD103 mRNA, the protein product of which has been implicated with homing to gut and skin [54].
The recovery kinetics of naïve and memory CD4+ T cells on ART have been shown to differ depending on the extent of a patient’s CD4+ T-cell loss at the time of ART initiation [9]. Therefore, the present findings might not apply to all HIV-1+ individuals on ART, as we focused our study on severely immuno-compromised patients (< 200 CD4+ T cells/μl). In fact, we found an inverse correlation between CD4+ (P = 0.0008) or CD8+ (P = 0.0037) T-cell recovery and the CD4+ T-cell count pre-ART, reflecting a greater change in T-cell numbers experienced by those patients starting with a more severe T-cell depletion. Furthermore, individuals with lower pre-ART PVL were found to start with more differentiated CD4+ T cells and to exhibit a more rapid drop in late differentiation cells.
However, even though a substantial immune reconstitution occurs in the peripheral blood, it has been demonstrated that the mucosal immune system is more recalcitrant [55, 56], with CD4+ T cells expressing CCR5 and/or CXCR4 remaining preferentially depleted [56].
Overall we found that even in these very advanced HIV-1+ patients the CD4+ and CD8+ T-cell compartments in peripheral blood slowly revert towards a more “healthy” phenotype, with an overall reduction in the expression of activation markers and molecules associated with inhibition of cellular functions, as well as an upregulation of factors associated with T-cell homeostasis and a more balanced immune system. For the most part, these changes commence early after ART initiation. An exception was an ART-induced increase in the frequency of initially highly activated peripheral CCR4+ TCM cells. This reflects a redistribution of these cells from peripheral tissue sites to peripheral blood, caused by a reduction in the viral burden, as highlighted by their expression of mRNA transcripts of the gut- and skin-homing integrin CD103. However, even 1 year post-therapy, the immune system maintains an unusually Th2-biased composition, potentially underlying continued immunodeficiency in the presence of higher CD4+ T-cell counts.
We would like to thank Joanne Yu for antibody conjugations and titrations, Catherine Rehm and JoAnn Mican for help with PBMC sample logistics, Brian O. Porter and Sonya Krishnan for providing clinical information, Jamie Greenwald, Lis Antonelli, and Jessica Hodge for help with sample acquisition, and Kaimei Song for technical assistance. Y.D.M. is an International Society for Advancement of Cytometry (ISAC) Scholar. This work was supported by the Intramural Research Programs of the Vaccine Research Center and NIAID, NIH.
The authors declare no competing interests.
This work was supported by the Intramural Research Programs of the Vaccine Research Center and NIAID, NIH. The authors declare no competing interests.
1. Autran B, Carcelain G, Li TS, Blanc C, Mathez D, Tubiana R, Katlama C, Debre P, Leibowitch J. Positive effects of combined antiretroviral therapy on CD4+ T cell homeostasis and function in advanced HIV disease. Science. 1997;277(5322):112-6. PubMed PMID: 9204894.
2. Guihot A, Bourgarit A, Carcelain G, Autran B. Immune reconstitution after a decade of combined antiretroviral therapies for human immunodeficiency virus. Trends Immunol. 2011;32(3):131-7. PubMed PMID: 21317040. doi: 10.1016/j.it.2010.12.002
3. Pakker NG, Notermans DW, de Boer RJ, Roos MT, de Wolf F, Hill A, Leonard JM, Danner SA, Miedema F, Schellekens PT. Biphasic kinetics of peripheral blood T cells after triple combination therapy in HIV-1 infection: a composite of redistribution and proliferation. Nat Med. 1998;4(2):208-14. PubMed PMID: 9461195.
4. Bucy RP, Hockett RD, Derdeyn CA, Saag MS, Squires K, Sillers M, Mitsuyasu RT, Kilby JM. Initial increase in blood CD4(+) lymphocytes after HIV antiretroviral therapy reflects redistribution from lymphoid tissues. J Clin Invest. 1999;103(10):1391-8. PubMed PMID: 10330421. Pubmed Central PMCID: 408455. doi: 10.1172/JCI5863
5. Steffens CM, Smith KY, Landay A, Shott S, Truckenbrod A, Russert M, Al-Harthi L. T cell receptor excision circle (TREC) content following maximum HIV suppression is equivalent in HIV-infected and HIV-uninfected individuals. AIDS. 2001;15(14):1757-64. PubMed PMID: 11579236.
6. Kovacs JA, Lempicki RA, Sidorov IA, Adelsberger JW, Herpin B, Metcalf JA, Sereti I, Polis MA, Davey RT, Tavel J, Falloon J, Stevens R, Lambert L, Dewar R, Schwartzentruber DJ, Anver MR, Baseler MW, Masur H, Dimitrov DS, Lane HC. Identification of dynamically distinct subpopulations of T lymphocytes that are differentially affected by HIV. J Exp Med. 2001;194(12):1731-41. PubMed PMID: 11748275. Pubmed Central PMCID: 2193579.
7. Mohri H, Perelson AS, Tung K, Ribeiro RM, Ramratnam B, Markowitz M, Kost R, Hurley A, Weinberger L, Cesar D, Hellerstein MK, Ho DD. Increased turnover of T lymphocytes in HIV-1 infection and its reduction by antiretroviral therapy. J Exp Med. 2001;194(9):1277-87. PubMed PMID: 11696593. Pubmed Central PMCID: 2195973.
8. Hazenberg MD, Stuart JW, Otto SA, Borleffs JC, Boucher CA, de Boer RJ, Miedema F, Hamann D. T-cell division in human immunodeficiency virus (HIV)-1 infection is mainly due to immune activation: a longitudinal analysis in patients before and during highly active antiretroviral therapy (HAART). Blood. 2000;95(1):249-55. PubMed PMID: 10607709.
9. Lepej SZ, Begovac J, Vince A. Changes in T-cell subpopulations during four years of suppression of HIV-1 replication in patients with advanced disease. FEMS Immunol Med Microbiol. 2006;46(3):351-9. PubMed PMID: 16553807. doi: 10.1111/j.1574-695X.2005.00034.x
10. Autran B. Effects of antiretroviral therapy on immune reconstitution. Antivir Ther. 1999;4 Suppl 3:3-6. PubMed PMID: 16021864.
11. Barbour JD, Ndhlovu LC, Xuan Tan Q, Ho T, Epling L, Bredt BM, Levy JA, Hecht FM, Sinclair E. High CD8+ T cell activation marks a less differentiated HIV-1 specific CD8+ T cell response that is not altered by suppression of viral replication. PLoS One. 2009;4(2):e4408. PubMed PMID: 19198651. Pubmed Central PMCID: 2634967. doi: 10.1371/journal.pone.0004408
12. Lim A, Tan D, Price P, Kamarulzaman A, Tan HY, James I, French MA. Proportions of circulating T cells with a regulatory cell phenotype increase with HIV-associated immune activation and remain high on antiretroviral therapy. AIDS. 2007;21(12):1525-34. PubMed PMID: 17630546. doi: 10.1097/QAD.0b013e32825eab8b
13. Almeida M, Cordero M, Almeida J, Orfao A. Relationship between CD38 expression on peripheral blood T-cells and monocytes, and response to antiretroviral therapy: a one-year longitudinal study of a cohort of chronically infected ART-naive HIV-1+ patients. Cytometry B Clin Cytom. 2007;72(1):22-33. PubMed PMID: 17051525. doi: 10.1002/cyto.b.20144
14. Glencross DK, Janossy G, Coetzee LM, Lawrie D, Scott LE, Sanne I, McIntyre JA, Stevens W. CD8/CD38 activation yields important clinical information of effective antiretroviral therapy: findings from the first year of the CIPRA-SA cohort. Cytometry B Clin Cytom. 2008;74 Suppl 1:S131-40. PubMed PMID: 18228566. doi: 10.1002/cyto.b.20391
15. Casazza JP, Betts MR, Picker LJ, Koup RA. Decay kinetics of human immunodeficiency virus-specific CD8+ T cells in peripheral blood after initiation of highly active antiretroviral therapy. J Virol. 2001;75(14):6508-16. PubMed PMID: 11413318. Pubmed Central PMCID: 114374. doi: 10.1128/JVI.75.14.6508-6516.2001
16. Lopez M, Soriano V, Rallon N, Cascajero A, Gonzalez-Lahoz J, Benito JM. Suppression of viral replication with highly active antiretroviral therapy has no impact on the functional profile of HIV-specific CD8(+) T cells. Eur J Immunol. 2008;38(6):1548-58. PubMed PMID: 18421792. doi: 10.1002/eji.200738054
17. Mahnke YD, Greenwald JH, DerSimonian R, Roby G, Antonelli LR, Sher A, Roederer M, Sereti I. Selective expansion of polyfunctional pathogen-specific CD4(+) T cells in HIV-1-infected patients with immune reconstitution inflammatory syndrome. Blood. 2012;119(13):3105-12. PubMed PMID: 22219223. Pubmed Central PMCID: 3321870. doi: 10.1182/blood-2011-09-380840
18. Antonelli LR, Mahnke Y, Hodge JN, Porter BO, Barber DL, DerSimonian R, Greenwald JH, Roby G, Mican J, Sher A, Roederer M, Sereti I. Elevated frequencies of highly activated CD4+ T cells in HIV+ patients developing immune reconstitution inflammatory syndrome. Blood. 2010;116(19):3818-27. PubMed PMID: 20660788. Pubmed Central PMCID: 2981537. doi: 10.1182/blood-2010-05-285080
19. Dominguez MH, Chattopadhyay PK, Ma S, Lamoreaux L, McDavid A, Finak G, Gottardo R, Koup RA, Roederer M. Highly multiplexed quantitation of gene expression on single cells. J Immunol Methods. 2013;391(1-2):133-45. PubMed PMID: 23500781. doi: 10.1016/j.jim.2013.03.002
20. Roederer M, Nozzi JL, Nason MC. SPICE: exploration and analysis of post-cytometric complex multivariate datasets. Cytometry A. 2011;79(2):167-74. PubMed PMID: 21265010. Pubmed Central PMCID: 3072288. doi: 10.1002/cyto.a.21015
21. Gentleman RC, Carey VJ, Bates DM, Bolstad B, Dettling M, Dudoit S, Ellis B, Gautier L, Ge Y, Gentry J, Hornik K, Hothorn T, Huber W, Iacus S, Irizarry R, Leisch F, Li C, Maechler M, Rossini AJ, Sawitzki G, Smith C, Smyth G, Tierney L, Yang JY, Zhang J. Bioconductor: open software development for computational biology and bioinformatics. Genome Biol. 2004;5(10):R80. PubMed PMID: 15461798. Pubmed Central PMCID: 545600. doi: 10.1186/gb-2004-5-10-r80
22. Lin H, Lin C, Weng R. A note on Platt’s probabilistic outputs for support vector machines machine learning. Mach Learn. 2003;68:267-76.
23. Platt J. Probablistic outputs for support vector machines and comparisons to regularized likelihood methods. In: Smola A, Bartlett P, Scholkopf B, Schuurmans D, editors. Advances in Large Margin Classifiers. Cambridge, MA: MIT Press; 1999. p. 61-74.
24. Cortes C, Vapnik V. Support-Vector Networks. Machine Learning. 1995;20:273-97.
25. Meyer D, Dimitriadou E, Hornik K, Weingessel A, Leisch F. e1071: Misc Functions of the Department of Statistics (e1071), TU Wien. R package version 1.6-4. 2014. Available from: http://CRAN.R-project.org/package=e1071.
26. Ritchie ME, Phipson B, Wu D, Hu Y, Law CW, Shi W, Smyth GK. limma powers differential expression analyses for RNA-sequencing and microarray studies. Nucleic Acids Research. 2015;43. doi: 10.1093/nar/gkv007
27. Smyth G, Michaud J, Scott H. The use of within-array replicate spots for assessing differential expression in microarray experiments. Bioinformatics. 2005;21:2067-75.
28. Smyth GK. Linear models and empirical bayes methods for assessing differential expression in microarray experiments. Stat Appl Genet Mol Biol. 2004;3:Article3. PubMed PMID: 16646809. doi: 10.2202/1544-6115.1027
29. Huber P. Robust Statistics: Wiley; 1981.
30. Venables WN, Ripley BD. Modern Applied Statistics with S, Fourth Edition. New York: Springer; 2002.
31. Benjamini Y, Hochnerg Y. Controlling the false discovery rate: a practical and powerful approach to multiple testing. Journal of the Royal Statistical Society. 1995;Series B 57 (1):289-300.
32. Mahnke YD, Song K, Sauer MM, Nason MC, Giret MT, Carvalho KI, Costa PR, Roederer M, Kallas EG. Early immunologic and virologic predictors of clinical HIV-1 disease progression. AIDS. 2012. PubMed PMID: 23211771. doi: 10.1097/QAD.0b013e32835ce2e9
33. Liu Z, Hultin LE, Cumberland WG, Hultin P, Schmid I, Matud JL, Detels R, Giorgi JV. Elevated relative fluorescence intensity of CD38 antigen expression on CD8+ T cells is a marker of poor prognosis in HIV infection: results of 6 years of follow-up. Cytometry. 1996;26(1):1-7. PubMed PMID: 8809474. 10.1002/(SICI)1097-0320(19960315)26:1<1::AID-CYTO1>3.0.CO;2-L
34. Bonecchi R, Bianchi G, Bordignon PP, D'Ambrosio D, Lang R, Borsatti A, Sozzani S, Allavena P, Gray PA, Mantovani A, Sinigaglia F. Differential expression of chemokine receptors and chemotactic responsiveness of type 1 T helper cells (Th1s) and Th2s. J Exp Med. 1998;187(1):129-34. PubMed PMID: 9419219. Pubmed Central PMCID: 2199181.
35. Campbell JD, HayGlass KT. T cell chemokine receptor expression in human Th1- and Th2-associated diseases. Arch Immunol Ther Exp (Warsz). 2000;48(6):451-6. PubMed PMID: 11197598.
36. Rivino L, Messi M, Jarrossay D, Lanzavecchia A, Sallusto F, Geginat J. Chemokine receptor expression identifies Pre-T helper (Th)1, Pre-Th2, and nonpolarized cells among human CD4+ central memory T cells. J Exp Med. 2004;200(6):725-35. PubMed PMID: 15381728. Pubmed Central PMCID: 2211963. doi: 10.1084/jem.20040774
37. Gosselin A, Monteiro P, Chomont N, Diaz-Griffero F, Said EA, Fonseca S, Wacleche V, El-Far M, Boulassel MR, Routy JP, Sekaly RP, Ancuta P. Peripheral blood CCR4+CCR6+ and CXCR3+CCR6+CD4+ T cells are highly permissive to HIV-1 infection. J Immunol. 2010;184(3):1604-16. PubMed PMID: 20042588. doi: 10.4049/jimmunol.0903058
38. Acosta-Rodriguez EV, Rivino L, Geginat J, Jarrossay D, Gattorno M, Lanzavecchia A, Sallusto F, Napolitani G. Surface phenotype and antigenic specificity of human interleukin 17-producing T helper memory cells. Nat Immunol. 2007;8(6):639-46. PubMed PMID: 17486092. doi: 10.1038/ni1467
39. Duhen T, Geiger R, Jarrossay D, Lanzavecchia A, Sallusto F. Production of interleukin 22 but not interleukin 17 by a subset of human skin-homing memory T cells. Nat Immunol. 2009;10(8):857-63. PubMed PMID: 19578369. doi: 10.1038/ni.1767
40. Annunziato F, Galli G, Cosmi L, Romagnani P, Manetti R, Maggi E, Romagnani S. Molecules associated with human Th1 or Th2 cells. Eur Cytokine Netw. 1998;9(3 Suppl):12-6. PubMed PMID: 9831180.
41. Arno A, Ruiz L, Juan M, Zayat MK, Puig T, Balague M, Romeu J, Pujol R, O'Brien WA, Clotet B. Impact on the immune system of undetectable plasma HIV-1 RNA for more than 2 years. AIDS. 1998;12(7):697-704. PubMed PMID: 9619800.
42. Kim CJ, Nazli A, Rojas OL, Chege D, Alidina Z, Huibner S, Mujib S, Benko E, Kovacs C, Shin LY, Grin A, Kandel G, Loutfy M, Ostrowski M, Gommerman JL, Kaushic C, Kaul R. A role for mucosal IL-22 production and Th22 cells in HIV-associated mucosal immunopathogenesis. Mucosal Immunol. 2012;5(6):670-80. PubMed PMID: 22854709. doi: 10.1038/mi.2012.72
43. Rutz S, Eidenschenk C, Ouyang W. IL-22, not simply a Th17 cytokine. Immunol Rev. 2013;252(1):116-32. PubMed PMID: 23405899. doi: 10.1111/imr.12027
44. Eyerich S, Eyerich K, Pennino D, Carbone T, Nasorri F, Pallotta S, Cianfarani F, Odorisio T, Traidl-Hoffmann C, Behrendt H, Durham SR, Schmidt-Weber CB, Cavani A. Th22 cells represent a distinct human T cell subset involved in epidermal immunity and remodeling. J Clin Invest. 2009;119(12):3573-85. PubMed PMID: 19920355. Pubmed Central PMCID: 2786807. doi: 10.1172/JCI40202
45. Becker Y. The changes in the T helper 1 (Th1) and T helper 2 (Th2) cytokine balance during HIV-1 infection are indicative of an allergic response to viral proteins that may be reversed by Th2 cytokine inhibitors and immune response modifiers--a review and hypothesis. Virus Genes. 2004;28(1):5-18. PubMed PMID: 14739648. doi: 10.1023/B:VIRU.0000012260.32578.72
46. Klein SA, Dobmeyer JM, Dobmeyer TS, Pape M, Ottmann OG, Helm EB, Hoelzer D, Rossol R. Demonstration of the Th1 to Th2 cytokine shift during the course of HIV-1 infection using cytoplasmic cytokine detection on single cell level by flow cytometry. AIDS. 1997;11(9):1111-8. PubMed PMID: 9233457.
47. Levy JA. HIV pathogenesis and long-term survival. AIDS. 1993;7(11):1401-10. PubMed PMID: 8280406.
48. Soriano A, Lozano F, Oliva H, Garcia F, Nomdedeu M, De Lazzari E, Rodriguez C, Barrasa A, Lorenzo JI, Del Romero J, Plana M, Miro JM, Gatell JM, Vives J, Gallart T. Polymorphisms in the interleukin-4 receptor alpha chain gene influence susceptibility to HIV-1 infection and its progression to AIDS. Immunogenetics. 2005;57(9):644-54. PubMed PMID: 16189667. doi: 10.1007/s00251-005-0041-x
49. Spellberg B, Edwards JE, Jr. Type 1/Type 2 immunity in infectious diseases. Clin Infect Dis. 2001;32(1):76-102. PubMed PMID: 11118387. doi: 10.1086/317537
50. Chun TW, Nickle DC, Justement JS, Meyers JH, Roby G, Hallahan CW, Kottilil S, Moir S, Mican JM, Mullins JI, Ward DJ, Kovacs JA, Mannon PJ, Fauci AS. Persistence of HIV in gut-associated lymphoid tissue despite long-term antiretroviral therapy. J Infect Dis. 2008;197(5):714-20. PubMed PMID: 18260759. doi: 10.1086/527324
51. Moir S, Chun TW, Fauci AS. Pathogenic mechanisms of HIV disease. Annu Rev Pathol. 2011;6:223-48. PubMed PMID: 21034222. doi: 10.1146/annurev-pathol-011110-130254
52. Cerf-Bensussan N, Jarry A, Brousse N, Lisowska-Grospierre B, Guy-Grand D, Griscelli C. A monoclonal antibody (HML-1) defining a novel membrane molecule present on human intestinal lymphocytes. Eur J Immunol. 1987;17(9):1279-85. PubMed PMID: 3498635. doi: 10.1002/eji.1830170910
53. Rendon JL, Choudhry MA. Th17 cells: critical mediators of host responses to burn injury and sepsis. J Leukoc Biol. 2012;92(3):529-38. PubMed PMID: 22753950. Pubmed Central PMCID: 3427614. doi: 10.1189/jlb.0212083
54. Baekkevold ES, Wurbel MA, Kivisakk P, Wain CM, Power CA, Haraldsen G, Campbell JJ. A role for CCR4 in development of mature circulating cutaneous T helper memory cell populations. J Exp Med. 2005;201(7):1045-51. PubMed PMID: 15795234. Pubmed Central PMCID: PMC2213118. doi: 10.1084/jem.20041059
55. Guadalupe M, Sankaran S, George MD, Reay E, Verhoeven D, Shacklett BL, Flamm J, Wegelin J, Prindiville T, Dandekar S. Viral suppression and immune restoration in the gastrointestinal mucosa of human immunodeficiency virus type 1-infected patients initiating therapy during primary or chronic infection. J Virol. 2006;80(16):8236-47. PubMed PMID: 16873279. Pubmed Central PMCID: 1563811. doi: 10.1128/JVI.00120-06
56. Mehandru S, Poles MA, Tenner-Racz K, Jean-Pierre P, Manuelli V, Lopez P, Shet A, Low A, Mohri H, Boden D, Racz P, Markowitz M. Lack of mucosal immune reconstitution during prolonged treatment of acute and early HIV-1 infection. PLoS Med. 2006;3(12):e484. PubMed PMID: 17147468. Pubmed Central PMCID: 1762085. doi: 10.1371/journal.pmed.0030484
57. Mahnke YD, Beddall MH, Roederer M. OMIP-017: human CD4(+) helper T-cell subsets including follicular helper cells. Cytometry Part A : the journal of the International Society for Analytical Cytology. 2013;83(5):439-40. doi: 10.1002/cyto.a.22269 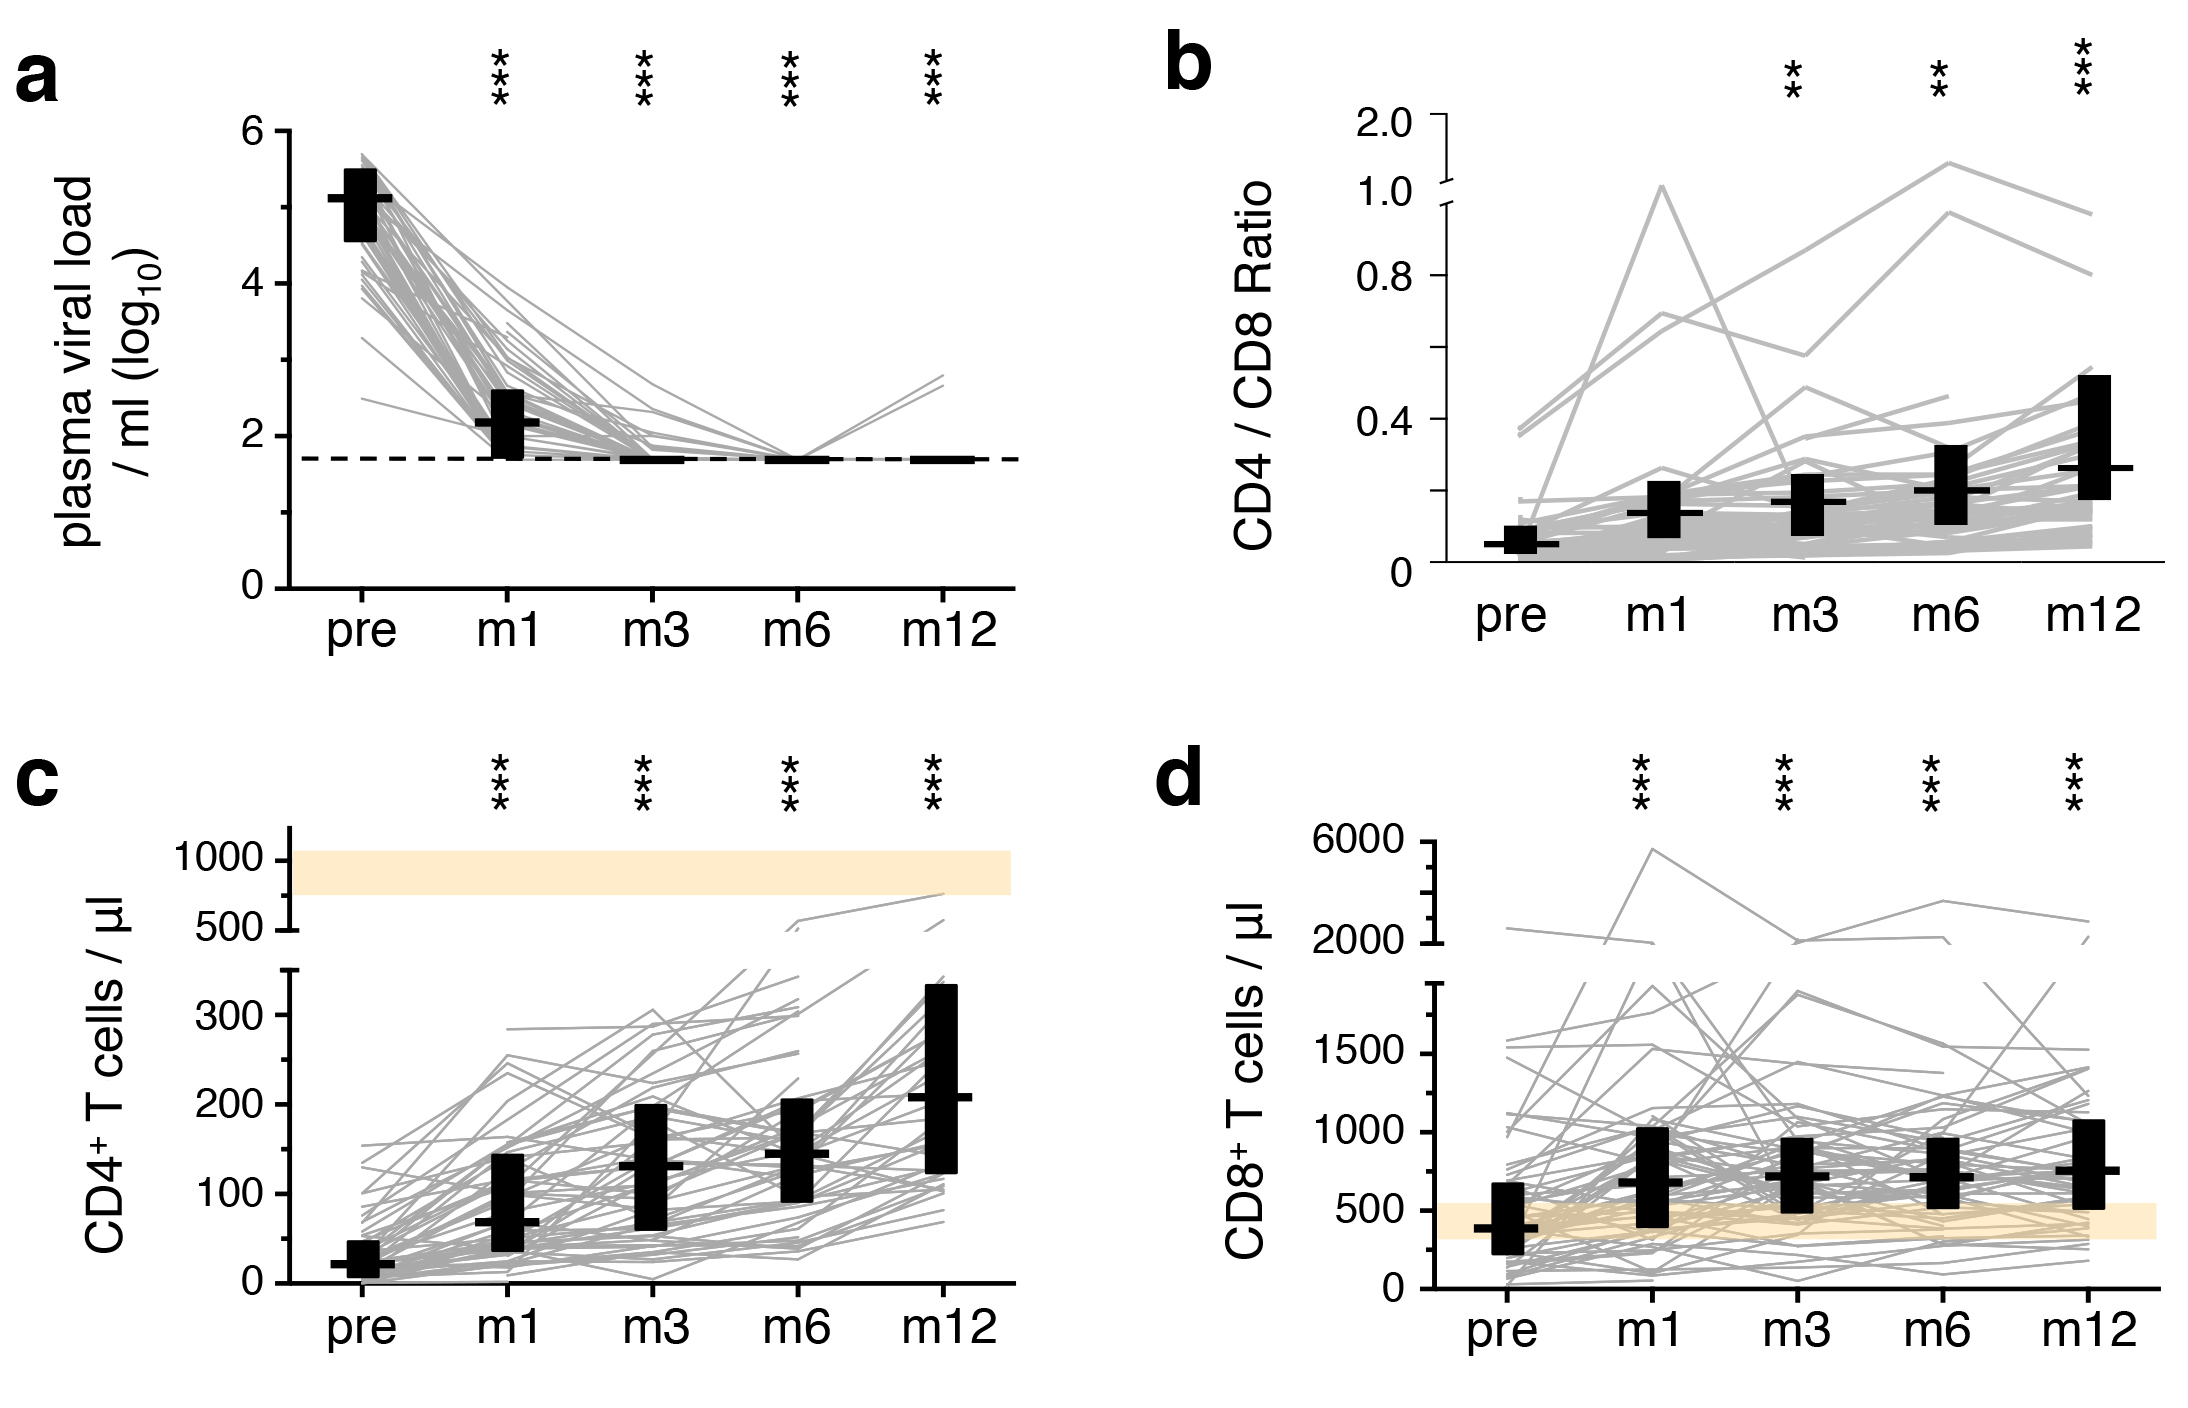
Supplementary Figure 1. Suppression of viral loads and recovery of T-cell counts on ART. (A) The plasma viral load was determined by measuring HIV-1 RNA at each sampling time-point. The detection threshold was 50 copies/ml (indicated by the broken line), with rare exceptions of 100 or 500 copies/ml. The number of CD4+ T-cells (B) and CD8+ T-cells/μl (C) in peripheral blood were measured. Bars illustrate median values, while boxes show the inter-quartile range. Healthy ranges are indicated in orange (generated from 288 healthy donor PBMC processed in the testing laboratory). All timepoints were compared to corresponding pre-ART measurements: * P < 0.01, ** P < 0.001, *** P <0.0001.
Supplementary Figure 2. ART-induced change towards less differentiated CD8+ T-cells. PBMC were sampled before, as well as after 1, 3, 6, and 12 months of ART. The distribution of differentiation stages (A) and frequency of individual differentiation subsets (B) was investigated in CD8+ T-cells. T-cell differentiation subsets were defined by expression of CD45RO (“RO”), CCR7 (“R7”) and CD27 (“27”). Differentiation indices (DI; medians and interquartile ranges) are indicated next to each pie. The average T-cell differentiation profile as well as the interquartile range of the differentiation indices in healthy donors are shown. (C) Markers of Tcell differentiation. (D) Inhibitory receptors. (E) Markers of activation; GrB – Granzyme B. (F) Mean fluorescence intensity of CD38. Graphs show interquartile ranges, median bars, as well as individual data points. Orange areas represent the interquartile ranges of corresponding measurements in healthy individuals. All timepoints were compared to corresponding pre-ART measurements: * P < 0.01, ** P < 0.001, *** P < 0.0001.
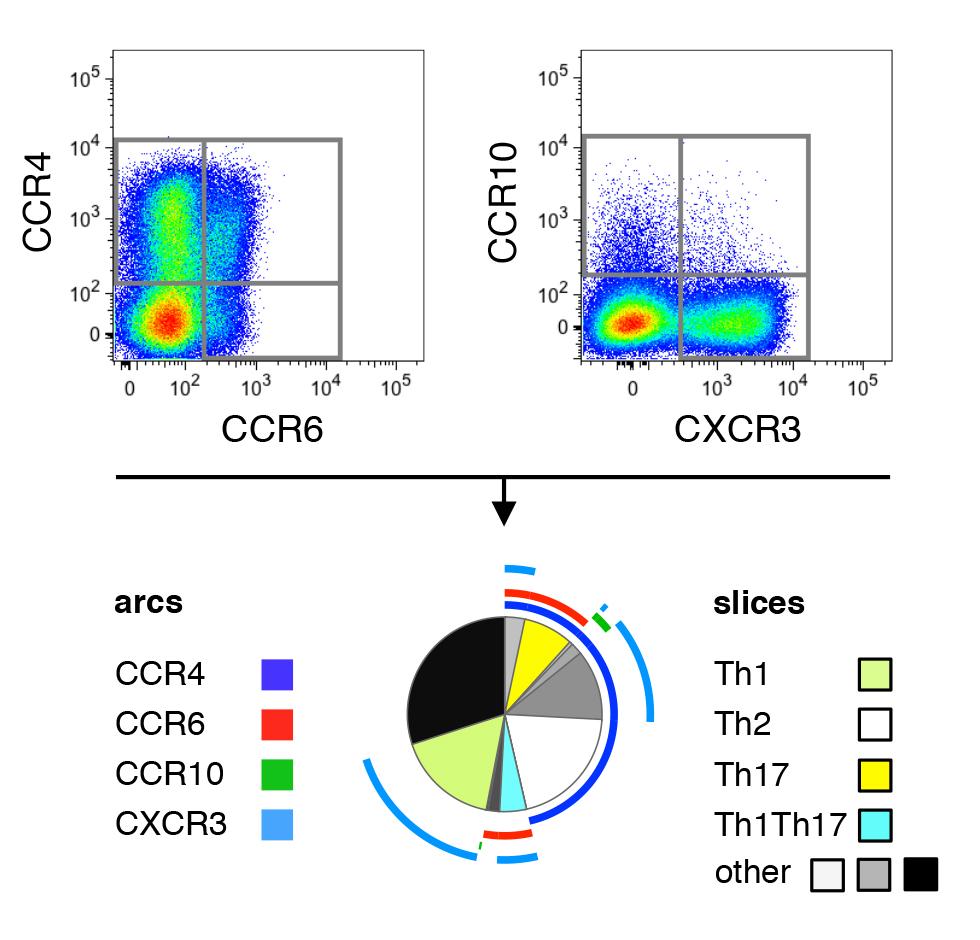
Supplementary Figure 3. Chemokine receptor staining and definition of Th subsets. Gates for the expression of CCR4, CCR6, CCR10, and CXCR3 were defined within total CD4+ T cells. Th subsets were identified by the resulting co-expression pattern, following the gating scheme published in OMIP-017[57].
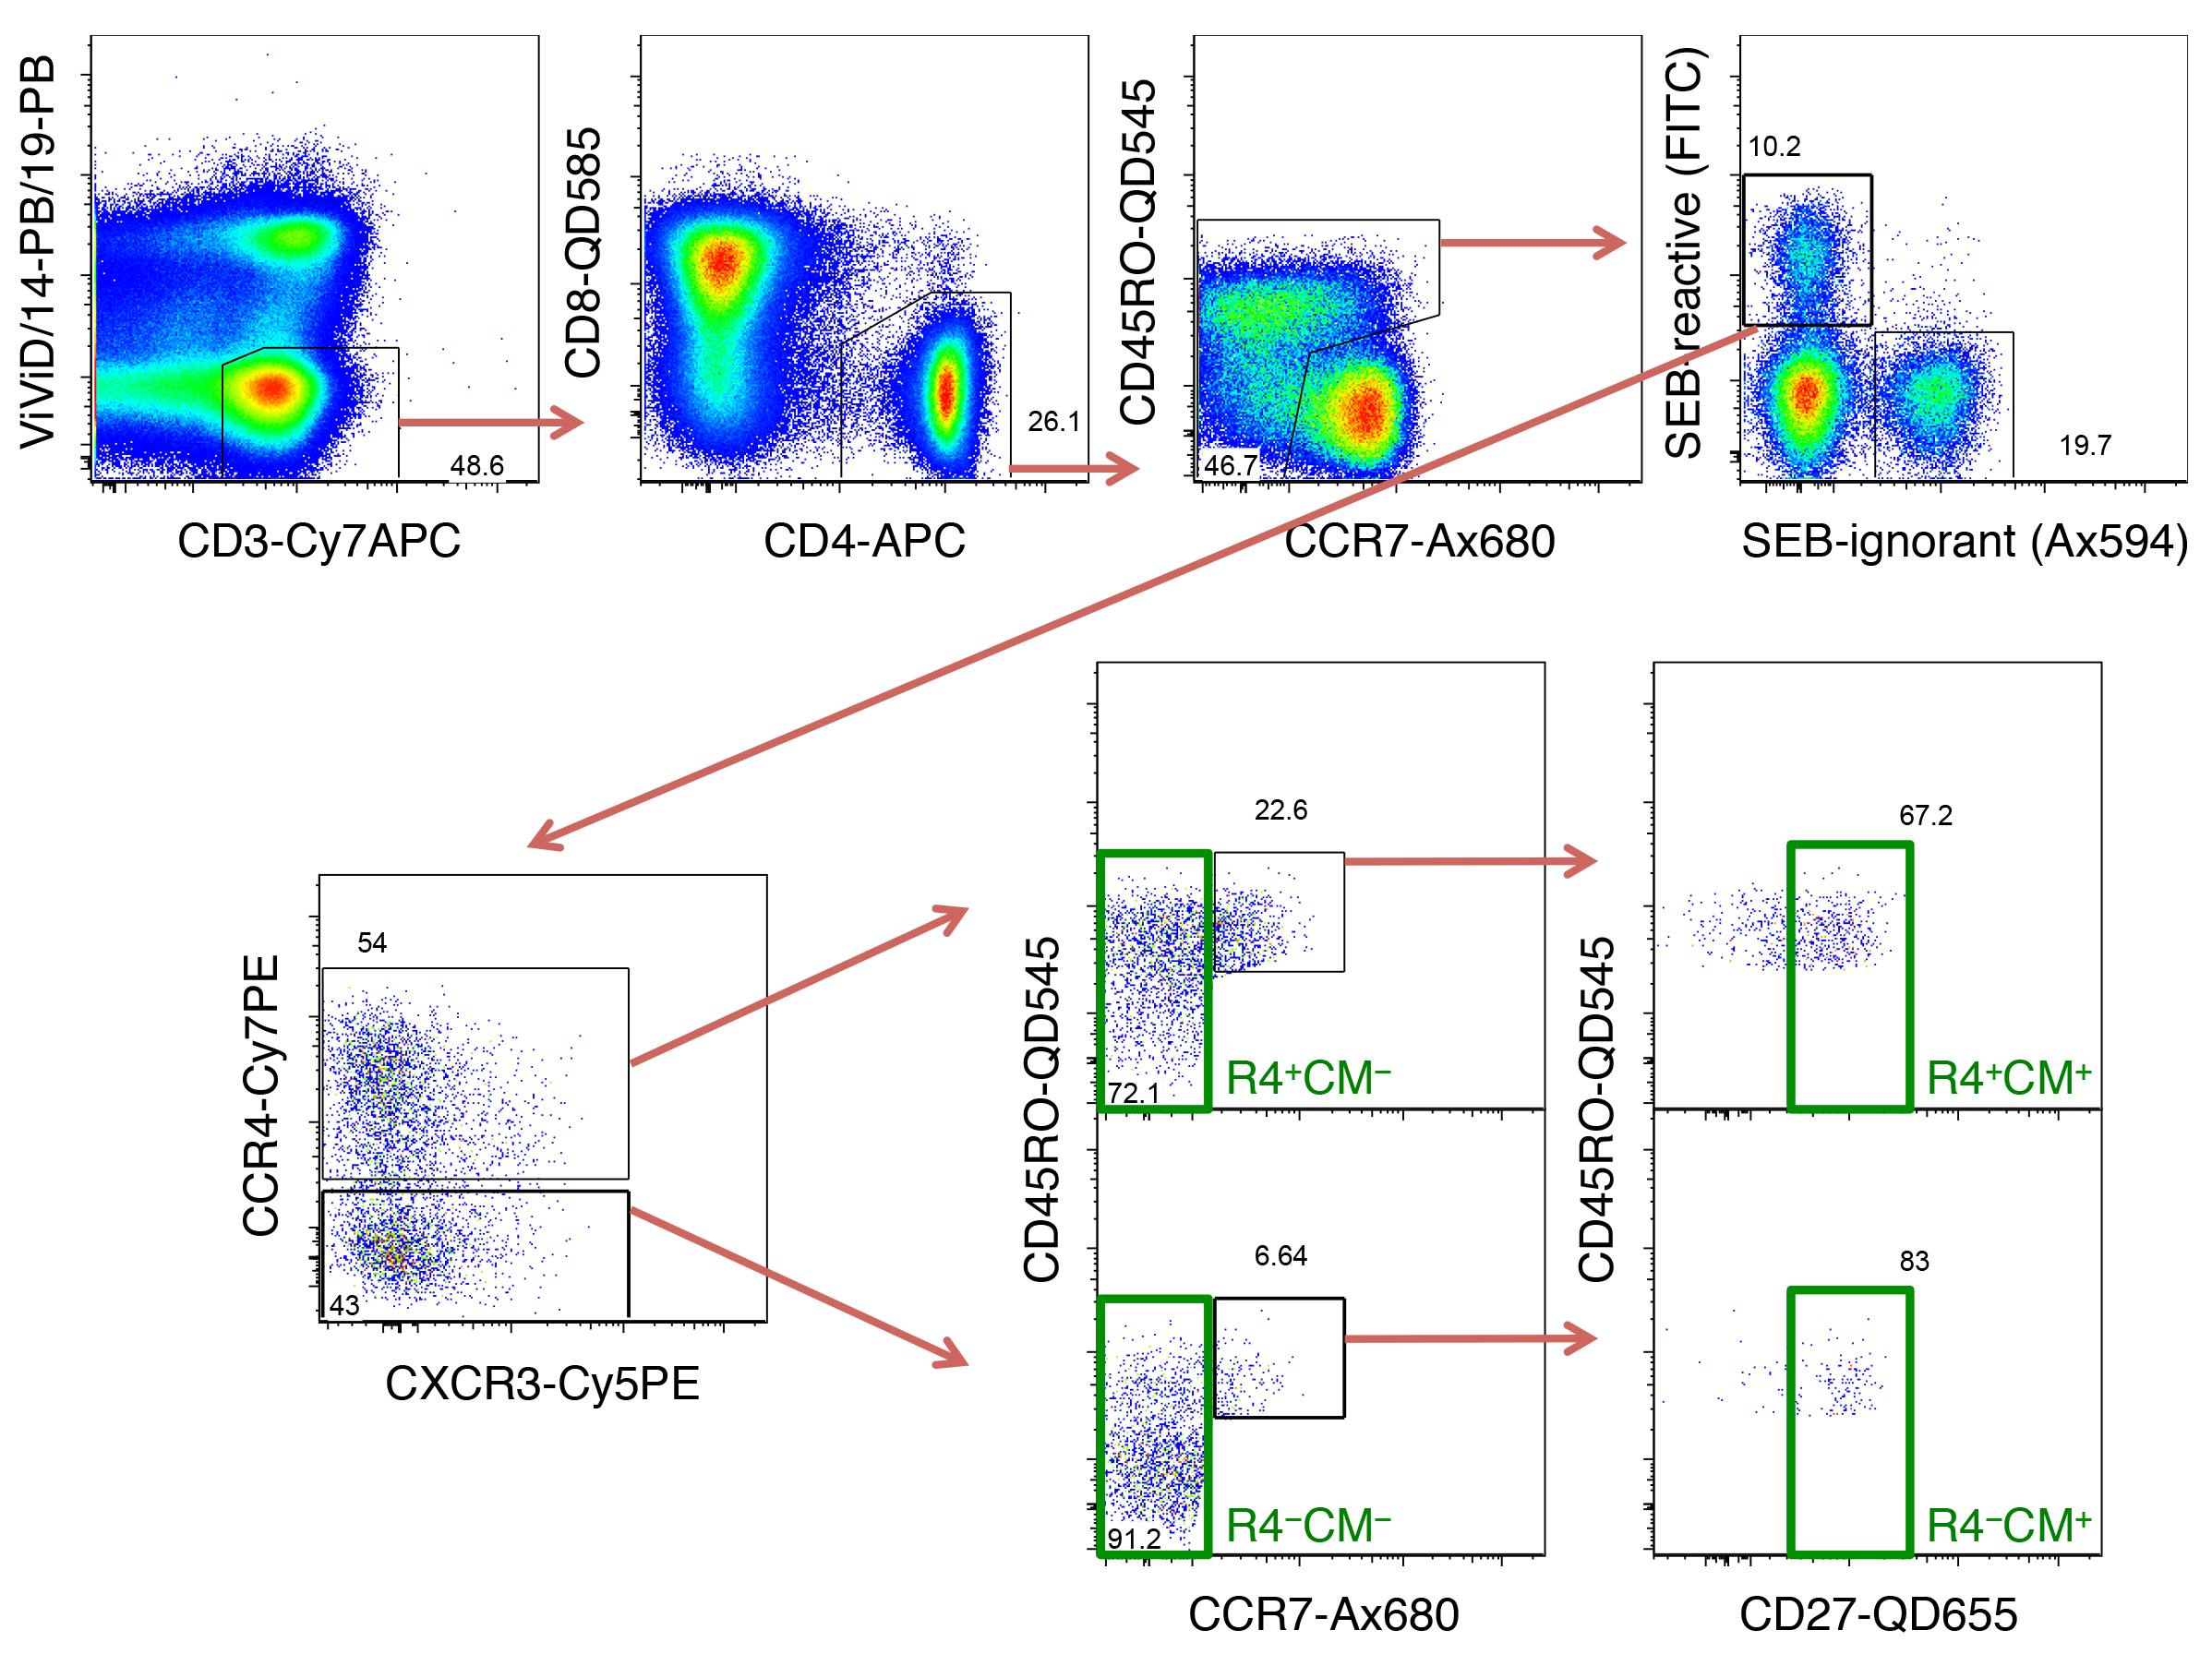
Supplementary Figure 4. T-cell subsets sorted for gene expression analysis. PBMC were stimulated with SEB for 3 hours, before sorting seven CD4+ T-cell subsets from SEB-reactive cells as indicated in this gating scheme. After identifying live CD3+ cells within singlet, aggregate-negative lymphocytes, non-naive CD4+ T cells were selected by excluding CD45RO− CCR7+ cells. Within these, T-cells expressing TCR-Vβ12, -Vβ14 or -Vβ17 are known to react to SEB, so FITC-conjugated Abs were used for these three TCR-Vβ chains. Within such SEB-reactive cells, CCR4+ and CCR4− cells were selected and individually gated for TCM (CD45RO+ CCR7+ CD27+) or TCM− subsets. Further, total SEB-reactive CD4+ T-cells, as well as stringently gated Th1- (CCR4− CCR6− CCR10− CXCR3+) and Th2-like cells (CCR4+ CCR6− CCR10− CXCR3−) were also sorted.
Supplementary Figure 5. CCR4+ TCM resemble Th2-like cells in respect to their expression of Th1 associated genes. PBMC from healthy donors, as well as cells isolated before or after 1 or 12 months of ART from HIV-1-infected adults were stained with the “sorting” panel (Supplementary Table 1). Subsets of CD4+ T-cells were sorted as indicated in Supplementary Figure 4 and their gene expression profiles determined by multi-parametric quantitative RT-PCR. (A) Th1-associated genes were compared in Th2-like, CCR4+ TCM, and Th1-like cells isolated from healthy donors. (B) CCR4+ TCM from HIV-1+ patients after 1 month of ART were compared to their counterparts from healthy donors in respect to expression of Th1-associated genes. Bar graphs show interquartile ranges, median bars, as well as individual data points. Statistically significant differences are indicated: * P < 0.01, ** P < 0.001, *** P < 0.0001.