Use of Dried Blood Spots to Elucidate Full-Length
Transmitted/Founder HIV-1 Genomes
Published July 20, 2016
Transmitted/Founder HIV-1 Genomes
Read in PDF format
Authors
Jesus F. Salazar-Gonzalez1*, Maria G. Salazar2*, Damien C. Tully3, Colin B. Ogilvie3, Gerald H. Learn 4, Todd M. Allen3, Sonya L. Heath2, Paul Goepfert2, Katharine J. Bar4
Affiliated Institutions
1 Comprehensive Cancer Center, University of Alabama at Birmingham, Birmingham, Alabama2 Department of Medicine, University of Alabama at Birmingham, Birmingham, Alabama
3 Ragon Institute of MHG, MIT, and Harvard, Boston, Massachusetts
4 Department of Medicine, Perelman School of Medicine, University of Pennsylvania, Philadelphia, Pennsylvania
* Present address: Jesus F. Salazar-Gonzalez and Maria G. Salazar, MRC/Uganda Virus Research Institute, Entebbe, Uganda
Corresponding Author
Katharine J. Barbark@upenn.edu
215-573-8497
Running Title
Dried blood spots to identify HIV founder virus
DOI
10.20411/pai.v1i1.116
Suggested Citation
Salazar-Gonzalez JF, Salazar MG, Tully DC, Ogilvie CB, Learn GH, Allen TM, Heath SL, Goepfert P, Bar KJ. Use of Dried Blood Spots to Elucidate Full-Length Transmitted/Founder HIV-1 Genomes. Pathogens and Immunity. 2016;1(1):129-53. doi: 10.20411/pai.v1i1.116Abstract
Background: Identification of HIV-1 genomes responsible for establishing clinical infection in newly infected individuals is fundamental to prevention and pathogenesis research. Processing, storage, and transportation of the clinical samples required to perform these virologic assays in resource-limited settings requires challenging venipuncture and cold chain logistics. Here, we validate the use of dried-blood spots (DBS) as a simple and convenient alternative to collecting and storing frozen plasma.
Methods: We performed parallel nucleic acid extraction, single genome amplification (SGA), next generation sequencing (NGS), and phylogenetic analyses on plasma and DBS.
Results: We demonstrated the capacity to extract viral RNA from DBS and perform SGA to infer the complete nucleotide sequence of the transmitted/founder (TF) HIV-1 envelope gene and full-length genome in two acutely infected individuals. Using both SGA and NGS methodologies, we showed that sequences generated from DBS and plasma display comparable phylogenetic patterns in both acute and chronic infection. SGA was successful on samples with a range of plasma viremia, including samples as low as 1,700 copies/ml and an estimated ~50 viral copies per blood spot. Further, we demonstrated reproducible efficiency in gp160 env sequencing in DBS stored at ambient temperature for up to three weeks or at -20ºC for up to five months.
Conclusions: These findings support the use of DBS as a practical and cost-effective alternative to frozen plasma for clinical trials and translational research conducted in resource-limited settings.
Keywords: dried blood spots, single genome sequencing, transmitted/founder virus, viral diversity, resource-limited settings
Introduction
Accurate identification and characterization of the virus that establishes productive clinical HIV-1 infection, or the transmitted/founder (TF) virus, is fundamental to many areas of HIV research. The exact identification of TF HIV-1 genomes was first enabled by single genome amplification strategies (SGA) [1-7], which utilize endpoint dilution amplification of plasma viral HIV-1 RNA to accurately and proportionally represent full-length genes or genomes from the complex circulating virus quasispecies. SGA has been an enabling technology for TF identification because it allows linkage between distant sites by sequencing of longer continuous templates and minimizes in vitro errors associated with bulk polymerase chain reaction (PCR) techniques [6, 8]. SGA applied to acutely HIV-1 infected cohorts enabled the enumeration and characterization of TF viruses and demonstrated the strict transmission bottleneck existent in heterosexual, men who have sex with men (MSM), and injection drug user (IDU) transmission [1-5, 9], and the immune pressures at play in acutely infected individuals [7, 10, 11]. More recently, identification of the TF viruses that break through in clinical vaccine trials has enabled genetic and phenotypic sieve studies [9, 12-17]. By comparing features of the TF viruses establishing infection in vaccine recipients to those of placebo recipients, sieve analyses have identified properties of the specific viruses blocked (or “sieved”) by vaccine-induced immune pressure. Examples include CD8 T-cell epitopes in conserved viral structural proteins [15] and antibody targets in envelope [14]. In addition, SGA analysis of the breakthrough rebound viruses that arise after or during clinical trials of curative strategies [18, 19] has the potential to elucidate the mechanisms of successful virus suppression or eradication and the pathways that viruses utilize to escape. For example, SGA and phenotypic characterization of breakthrough viruses emerging during or after passive administration of broadly neutralizing antibodies (bNAbs) allows accurate identification of neutralization escape variants and their pathways of developing resistance [20]. The HIV-1 field is currently testing multiple novel prevention strategies in large clinical trials, including vaccines, passively administered bNAbs, pre-exposure prophylaxis, and microbicides. For each of these trials, identifying and analyzing the breakthrough TF viruses for relevant properties (e.g., drug resistance, neutralization sensitivity, linked transmission networks, etc.) will be of paramount importance to the interpretation of trial results.
Accurate identification of TF or breakthrough viruses requires frequent venipuncture to obtain plasma samples near the time of transmission or rebound and places significant burdens on trial subjects and clinical staff (repeated venipuncture) and infrastructure (cold storage and shipping of many plasma samples). For these critically important trials, especially those conducted in resource-limited settings, simple and cost-effective protocols are needed. The capacity to use dried blood spots (DBS) to identify and study the breakthrough TF viruses, in lieu of stored plasma samples, would greatly facilitate cost-effective clinical trials.
The past several years have yielded multiple demonstrations of the feasibility of DBS as an alternative clinical specimen for HIV-1 diagnosis, viral load quantification, and drug-resistance genotyping [21-27]. The World Health Organization has identified DBS as the sample type for HIV resistance genotyping in settings without the capacity to collect, store, and transport plasma [28]. DBS have important advantages over plasma, particularly in resource-limited settings, as they are simple to collect, represent non-hazardous material, and require substantially less strict cold storage, in terms of both space and temperature for storage and transportation [21]. While studies of paired DBS and plasma samples have reported concordant results for HIV-1 genotyping and viral load quantification [21, 22, 26, 27], no previous study has demonstrated the feasibility of using DBS to examine HIV-1 envelope (env) gene diversity in acute and chronic infection or identify the TF env or full-length genome during primary HIV-1 infection. Recently, investigators presented an in-house SGA assay to amplify HIV-1 DNA from DBS obtained from infant heel-prick blood in field settings in Lusaka, Zambia [29], but no DNA sequencing data were included. Here, we examined the feasibility of using DBS to delineate HIV env diversity in acute and chronic infection and to identify the TF envs and complete genomes responsible for establishing productive clinical infection. We found that SGA from DBS provided equivalent sequencing results compared to those derived from plasma, and sufficient efficiency to merit its consideration in future clinical trials.
Material and Methods
Patients. Peripheral blood samples were obtained from 9 subjects with either acute/early (n = 2) or chronic (n = 7) HIV infection. All patients provided written informed consent for blood collection and subsequent analysis, under protocols approved by the Institutional Review Board of the University of Alabama at Birmingham. Clinical and laboratory staging of HIV infection was estimated by a battery of commercial assays, including HIV-1 enzyme immunoassay, Western blot, and quantitative polymerase chain reaction.
DBS and plasma collection. Whole blood was collected by venipuncture from HIV-infected individuals in tubes containing acid-citrate-dextrose (ACD) as an anticoagulant. Plasma was separated within 6 hours of the time of blood collection by centrifugation, aliquoted in clean tubes, and stored at −80ºC. DBS were prepared at the University of Alabama at Birmingham Center for AIDS Research laboratories by pipetting 50 µl of freshly collected ACD whole blood in each of 5 circles of a Whatman 903 card (Whatman Inc., Florham Park, NJ). Cards from each patient were then allowed to air-dry in a flat position at ambient temperature for 2-4 hours, followed by short-term storage at ambient temperature (~23ºC) in a sealed plastic bag along with silica gel desiccant sachets. After short-term storage, DBS enclosed in sealed bags were transferred to a non-frost-free −20ºC freezer for long-term storage.
Nucleic acid extraction from plasma and DBS. Individual 50 µl DBS were submitted to RNA extraction by two techniques based on DBS card manufacturer instructions. For technique 1, DBS were incubated with 400 µl of RNase-free water for 30 minutes at 37ºC, followed by transfer of the reddish fluid to a clean microcentrifuge tube containing 1 ml of TRIzol reagent (Life Technologies). In technique 2, DBS were directly incubated in 1 ml of TRIzol reagent (Life Technologies) for 30 minutes at room temperature, followed by transfer of the TRIzol-sample mix to a clean microcentrifuge tube. Plasma samples were similarly analyzed in two ways. For the first method, 1 ml of TRIzol was mixed and incubated with 25 µl of liquid plasma (the estimated average amount of plasma dried in 50 µl blood spots) for 30 minutes at room temperature. At the end of the incubation, RNA was extracted from the TRIzol containing samples following the manufacturer’s instructions (Life Technologies). For the second method, RNA was extracted from 25 µl of liquid plasma using a QIAamp viral RNA mini kit and following the manufacturer’s instructions (QIAGEN, Valencia, CA), which served as a reference RNA standard to estimate the efficiency of SGA assays performed in all other RNA extraction procedures. Total RNA was isolated via precipitation, washed, and resuspended in 30 µl of RNase-free water (for procedures using TRIzol) or 60 µl of elution buffer (for the QIAGEN protocol), as per the manufacturers’ instructions. RNA preparations were used either immediately for cDNA synthesis or stored at −80ºC.
cDNA synthesis. Reverse transcription was carried out with SuperScript III, using the protocol recommended by the manufacturer (Invitrogen Life Technologies, Carlsbad, CA) as previously described [4-6]. Briefly, 15 µl of nucleic acid extract from either plasma or DBS was reverse-transcribed in a final volume of 40 µl of 1x reverse transcription buffer, 5 mM dithiothreitol, 0.5 mM of each deoxynucleoside triphosphate (dNTPs), 0.25 µM antisense primer, 2 units/µl RNase inhibitor, and 10 units/µl SuperScript III. Reverse primer sequences to generate cDNAs for env, 5′- and 3′-half genome amplification have been previously published [4, 7]. Reactions were incubated at 50ºC for 60 min, followed by an additional hour at 55ºC. At the end of the incubation, reactions were stopped by heat (70ºC for 15 min), followed by RNaseH digestion at 37ºC for 20 min. Tubes containing cDNA were then immediately used for SGA or stored at −80ºC.
Single genome amplification and sequencing. To amplify full-length env genes, half-genomes and near full-length genomes (9-Kb), cDNA was endpoint diluted to an estimated single copy per well, followed by nested PCR using SGA procedures described previously [4, 6]. Primers were slightly different to amplify the 5′-half fragment for this study, as indicated below. Briefly, first- and second-round PCR were carried out similarly in 20 μl reactions containing 1x High Fidelity Platinum PCR buffer, 2 mM MgSO4, 0.2 mM of each dNTP, 0.2 μM each of sense and antisense primers, and 0.025 units/μl platinum Taq High Fidelity polymerase (Invitrogen, Carlsbad, CA) in MicroAmp optical 96-well reaction plates (Thermo Scientific, Foster City, CA) and sealed with ABI MicroAmp adhesive film. 5′-half genomes were amplified in the first-round PCR using sense primer RVF1 5′-GGG TCT CTC TGG TTA GAC CAG ATC-3′ (nt 454-477 HXB2) and antisense primer B5R1 5′-CTT GCC ACA CAA TCA TCA CCT GCC AT-3′ (nt 5,052–5,077 HXB2) using the following PCR conditions: 94ºC for 2 minutes followed by 35 cycles of 94ºC for 15 seconds; 55ºC for 30 seconds; and 68ºC for 5 minutes, with a final extension of 68ºC for 10 minutes. Next, 1 or 2 μl of first-round product was transferred to a final 20 μl PCR reaction containing sense primer RVF20 5′-GAG CCT GGG AGC TCT CTG GCT A (nt 479–500 HXB2) and antisense primer B5R2 5′- CAA TCA TCA CCT GCC ATC TGT TTT CCA TA-3′ (nt 5,040–5,068 HXB2), and a ~5 Kb fragment was amplified using the same reagent mix as the first round. PCR conditions were the same as the first round, but with a total of 45 PCR cycles. PCR positive wells containing amplicons of the predicted size by agarose gel electrophoresis were selected for DNA sequencing. Sanger sequencing was performed in a 3730xl DNA Analyzer using BigDye Terminator v.3.1 chemistry following the manufacturer’s protocols (Thermo Scientific, Carlsbad, CA). Amplicons were sequenced bidirectionally and chromatograms were edited using Sequencher program, version 5.1 (Gene Codes Corporation, Ann Arbor, MI). PCR products displaying mixed bases at one or multiple nucleotide positions were excluded from further analysis.
Efficiency comparisons. The estimated efficiency of the method to amplify HIV-1 from single molecules was based on the number of amplicons derived from a unit of plasma equivalents present in paired DBS and plasma extracts. We assigned 100% efficiency to HIV amplification from frozen plasma extracted with the QIAamp viral RNA mini kit. The efficiency in DBS was then calculated using the number of amplicons derived from plasma equivalents present in the DBS extract after considering that approximately half the volume of the 50 µl of whole blood spotted on the filter paper is plasma.
Next generation 454 deep sequencing. DBS vRNA from samples T8250 and N8261 were amplified using nested reverse transcriptase PCR (RT-PCR) over three overlapping regions of the genome (gag, pol, and a 3′genomic half). Primer sequences and PCR conditions are available upon request. First-round RT-PCR was performed using the Superscript III one-step RT-PCR system with Platinum Taq DNA polymerase with High Fidelity (Invitrogen, Carlsbad, CA). Each RT-PCR reaction was composed of 10 μl of RNA, 25 μl of 2x reaction mix (buffer, deoxynucleoside triphosphate, and MgSO4), 0.4 µM of forward and reverse primers and 1 μl of enzyme mix, and water. Takara Ex Taq DNA polymerase Hot Start enzyme (Takara Bio Inc., Shiga, Japan) was used for the second-round PCR using 2 μl of round 1 product and 0.6 µM of each primer according to the manufacturer’s directions. For post-PCR quality control purposes, the products were run on precast 1% agarose E-gels. Positive PCR products were purified using the QIAquick PCR Purification Kit (Qiagen) or the PureLink Quick Gel Extraction Kit (Invitrogen) and concentrations were determined using the Thermo Scientific Nanodrop 8000 spectrophotometer (Nanodrop Products). Amplifications from the same subject were pooled with concentration ratios of gag: pol: 3′half being 1:1:3.
Purified PCR products from each sample were pooled in equimolar ratios, fragmented using the transposon-mediated Nextera DNA Sample Prep Kit (Illumina) following the manufacturer’s protocol, and purified with a DNA Clean and Concentrator Kit (Zymo Research). Adapters and barcodes were added by limited-cycle PCR (Nextera). Small fragments were removed following Roche’s recommended size selection protocol and quantified using a Promega Quantiflor-ST fluorometer. After quantification, barcoded samples were pooled at a final concentration of 107 molecules/μl to create the library for sequencing on the GS Junior 454 Genome Sequencer (Roche Diagnostics). Emulsion PCR, breaking, and DNA sequencing were performed according to the manufacturer’s protocols for Lib-L (Roche Diagnostics). Resulting sequence reads were then cleaned and assembled into a de novo consensus using AV454 and VICUNA [30,31]. Reads were first clustered to form contigs using min hashes and an inexact string matching based search to infer similarity. Contigs were validated by iteratively aligning each constituent read to the consensus, and then aggressively merged to form a de novo consensus assembly of the viral population. The reads were then corrected for systematic 454 errors such as homopolymer indels and carry-forward/incomplete extensions and aligned to the consensus assembly using the previously developed software RC454 [30] with a variant calling performed by V-Phaser [32]. Briefly, V-Phaser uses phase and quality filtering with a probability model that recalibrates quality scores for individual bases to iteratively refine probabilities and to define the threshold required to statistically call variants in the presence of errors with high specificity and high sensitivity [32]. Analyses were further subjected to manual inspection to identify and discard any sequencing artifacts.
Phylogenetic analysis. SGA-derived env nucleotide sequences from each subject were aligned using ClustalW, and manually adjusted [33]. Intrapatient env diversity was determined by pairwise comparison of sequences using uncorrected sequence distances. For each subject, a maximum likelihood (ML) phylogenetic tree was inferred using PhyML, version 3.0 [34], and phylogenetic support was based on 100 bootstrap replicates. The genetic identity of TF env genes in individuals with recent infection was inferred as described previously [4]. APOBEC-associated G-to-A hypermutated sequences were excluded from analysis in the inference of the TF env sequence according to the Los Alamos National Laboratory (LANL) HIV Sequence Database tool Hypermut 2.0 [35]: http://www.hiv.lanl.gov/content/sequence/HYPERMUT/hypermut.html. Highlighter analysis of SGA sequences was performed using the LANL Highlighter tool: http://www.hiv.lanl.gov/content/sequence/HIGHLIGHT/highlighter_top.html. Poisson-fitter analyses were performed to determine whether env sequences conformed to predictions of a mathematical model of random viral evolution and to estimate the time to most recent common ancestor (MRCA) or the minimum number of days required to explain the observed within-patient HIV-1 sequence diversification from a single common ancestor sequence. This analysis was done using the Poisson-Fitter tool from the LANL (http://www.hiv.lanl.gov/content/sequence/POISSON_FITTER/poisson_fitter.html), as previously described [4, 36].
Statistical analysis. Evidence of statistical compartmentalization was assessed using programs implemented by HyPhy software [37], including the Slatkin-Maddison (SM) test, which compares the minimum number of intercompartmental migration events to the frequency distribution of migration events in 1,000 randomized trees [38]. Two-sample tests were performed to compare intra-patient sequence diversity between DBS vs plasma viral populations using the DIVEIN web tool (http://www.ncbi.nlm.nih.gov/pubmed/20569214) [39] Correlations of method efficiency and viral load were performed using Spearman’s rank test. Nonparametric statistics were employed due to the small number of env sequences that were amplified from the DBS and plasma of some subjects. Statistical significance was defined for P values of < 0.05.
Nucleotide sequence accession numbers. All SGA sequences determined in this study were deposited in GenBank under accession numbers KU901727–KU901998. Deep sequencing data are available in the NCBI sequence read archive under the accession number SRA307377.
Table 1. Study subjects characteristics and number of SGA-derived env sequences. a. Subject was previously on ART, but had been off ART for > 3 months prior to 12/28/11 sample.
|
|
|
|
|
|
|
|
|
|
|
|
|
|
|
|
|
|
|
|
|
|
|
|
|
|
|
|
|
|
|
|
|
|
|
|
|
|
|
|
|
|
|
|
|
|
|
|
|
|
|
|
|
|
|
|
|
|
|
|
|
|
|
|
|
|
|
|
|
|
|
|
|
|
|
|
|
|
|
|
|
Sample |
ID |
|
|
|
|
|
|
|
|
J6161 |
|
|
|
|
|
|||
|
K8072 |
|
|
|
|
|
|
|
|
|
T8107 |
|
|
|
|
|
|
|
|
|
F6817 |
|
|
|
|
|
|
|
|
|
A8110 |
|
|
|
|
|
|
|
|
|
J7180 |
|
|
|
|
|
|||
|
T8250 |
|
|
|
|
|
|||
|
N8261 |
|
|
|
|
|
|||
|
T4590 |
|
|
|
|
|
|
|
|
|
Median |
|
|
|
|
|
|||
a) Input HIV copy number was estimated for 25 ml of plasma using patient’s viral load measurements.
b) Efficiencies compared to an equivalent amount of autologous plasma processed by an automated commercial protocol (5-7).
c) Efficiencies compared to baseline DBS (stored for 1-3 weeks at room temperature).
Results
Performance characteristics of the viral RNA extraction and SGA of HIV-1 from DBS. To begin, we examined our capacity to isolate intact HIV-1 RNA for endpoint dilution PCR amplification of gp160 HIV-1 env from DBS stored at ambient temperatures for up to 3 weeks (20 days). We studied samples from 9 HIV-1-infected subjects (Table 1) and determined the number of gp160 sequences that could be amplified by standard SGA after TRIzol-based extraction (see methods) from a single DBS. This method was chosen based on DBS card recommendations, to isolate RNA preferentially over proviral DNA, to improve yields with a non-column-based isolation method, and to avoid unknown reagents in the final elution buffer that might affect subsequent PCR reactions [40]. We estimated individual blood spots contained between ~50 and 561,250 copies of HIV-1 RNA. This calculation was based on plasma viral load measurements for the 9 samples, which ranged from 1,710 to 22,450,000 copies/ml, the 50 µl quantity of blood per DBS, and the assumption that approximately 50% of whole blood volume is plasma. Extracted RNA underwent cDNA synthesis and endpoint dilution PCR and yielded reasonable numbers of gp160 env genes from each DBS (range 4-21 env sequences, median 10 per DBS) (Table 1). Notably, even DBS from subjects with the lowest viral loads (1,170 for F6817 and 2,200 for J6161) produced multiple amplicons per single DBS (Table 1). This number of gp160 env sequences from a single DBS suggests that the 5 DBS contained on commercially available cards could yield between 20 and > 100 sequences.
Notably, there was no correlation between the viral load of the sample and the efficiency of SGA from DBS, as determined by Spearman correlation test (r: −0.220, P > 0.05). Indeed, similar env amplification efficiencies were observed for DBS RNA extracted with TRIzol-alone from subjects T8250 (14.1%), T4590 (11.8%), T8107 (11.2%), and F6817 (8.3%) despite their broad range of viral loads (range: 1,710–22,450,000 copies/ml) (Table 2).
Upon determining that we could amplify multiple intact gp160 env sequences, we next tested the efficiency of vRNA extraction from DBS compared with standard plasma viral RNA extraction methods. We compared DBS RNA extraction protocol to our gold standard procedure to extract vRNA from frozen plasma by automated commercial kit (QIAGEN QIAamp viral RNA mini kit). Of note, when tested in 9 plasma specimens, vRNA extraction by the TRIzol reagent protocol was substantially less efficient than the Qiagen protocol; approximately half the number (median 52.8%) of plasma SGA-derived env sequences were obtained by TRIzol compared to the QIAGEN protocol. We next compared TRIzol extraction from DBS to the QIAGEN protocol’s automated extraction from plasma, which yielded a median of 11.2% as many sequences by volume (range 1–41.0%). Alternate extraction protocols, including using water coupled with TRIzol RNA isolation reagents, were less efficient, with a median of 4.6% (range 0.1–26.7%) (Table 2).
RNA integrity is a critical factor in PCR amplification efficiency, and HIV-1 RNA spotted on filter paper is well documented to be prone to degradation, but the rate of degradation reported has varied by study, environmental conditions, and desired application [21]. We evaluated SGA yields from DBS stored for different lengths of time at ambient temperature and −20ºC. As seen in Table 2, short-term storage of DBS from 1 to 20 days at ambient temperature supported the generation of multiple SGA env amplicons. As predicted, SGA yields decreased with increased storage at ambient temperatures. Spearman rank correlation analysis showed a significant inverse correlation between DBS storage time and assay efficiency (r = −0.0703, P = 0.027). As shown in Table 2, DBS stored for either 1 or 6 days at room temperature had the highest env amplification efficiencies (see J6161 and K8072), whereas DBS stored for 18 days (N8261) had lesser amplification efficiencies. Further, a DBS stored for 24 days at room temperature failed to generate any full-length gp160 env amplicons despite a viral load of 29,920 copies/ml in an acutely infected subject, though amplification of multiple short fragments (~400 bp) was possible (data not shown).
Finally, we tested the capacity to preserve vRNA integrity when DBS were promptly (within 1-20 days) frozen. For five subjects, DBS were stored at −20ºC for 3-5 months (Table 2). In each of these samples, viral RNA integrity was largely preserved, allowing successful amplification of full-length env genes with only modestly reduced efficiency (19–89%) when compared to baseline DBS (Table 2).
Download as a PowerPoint Slide
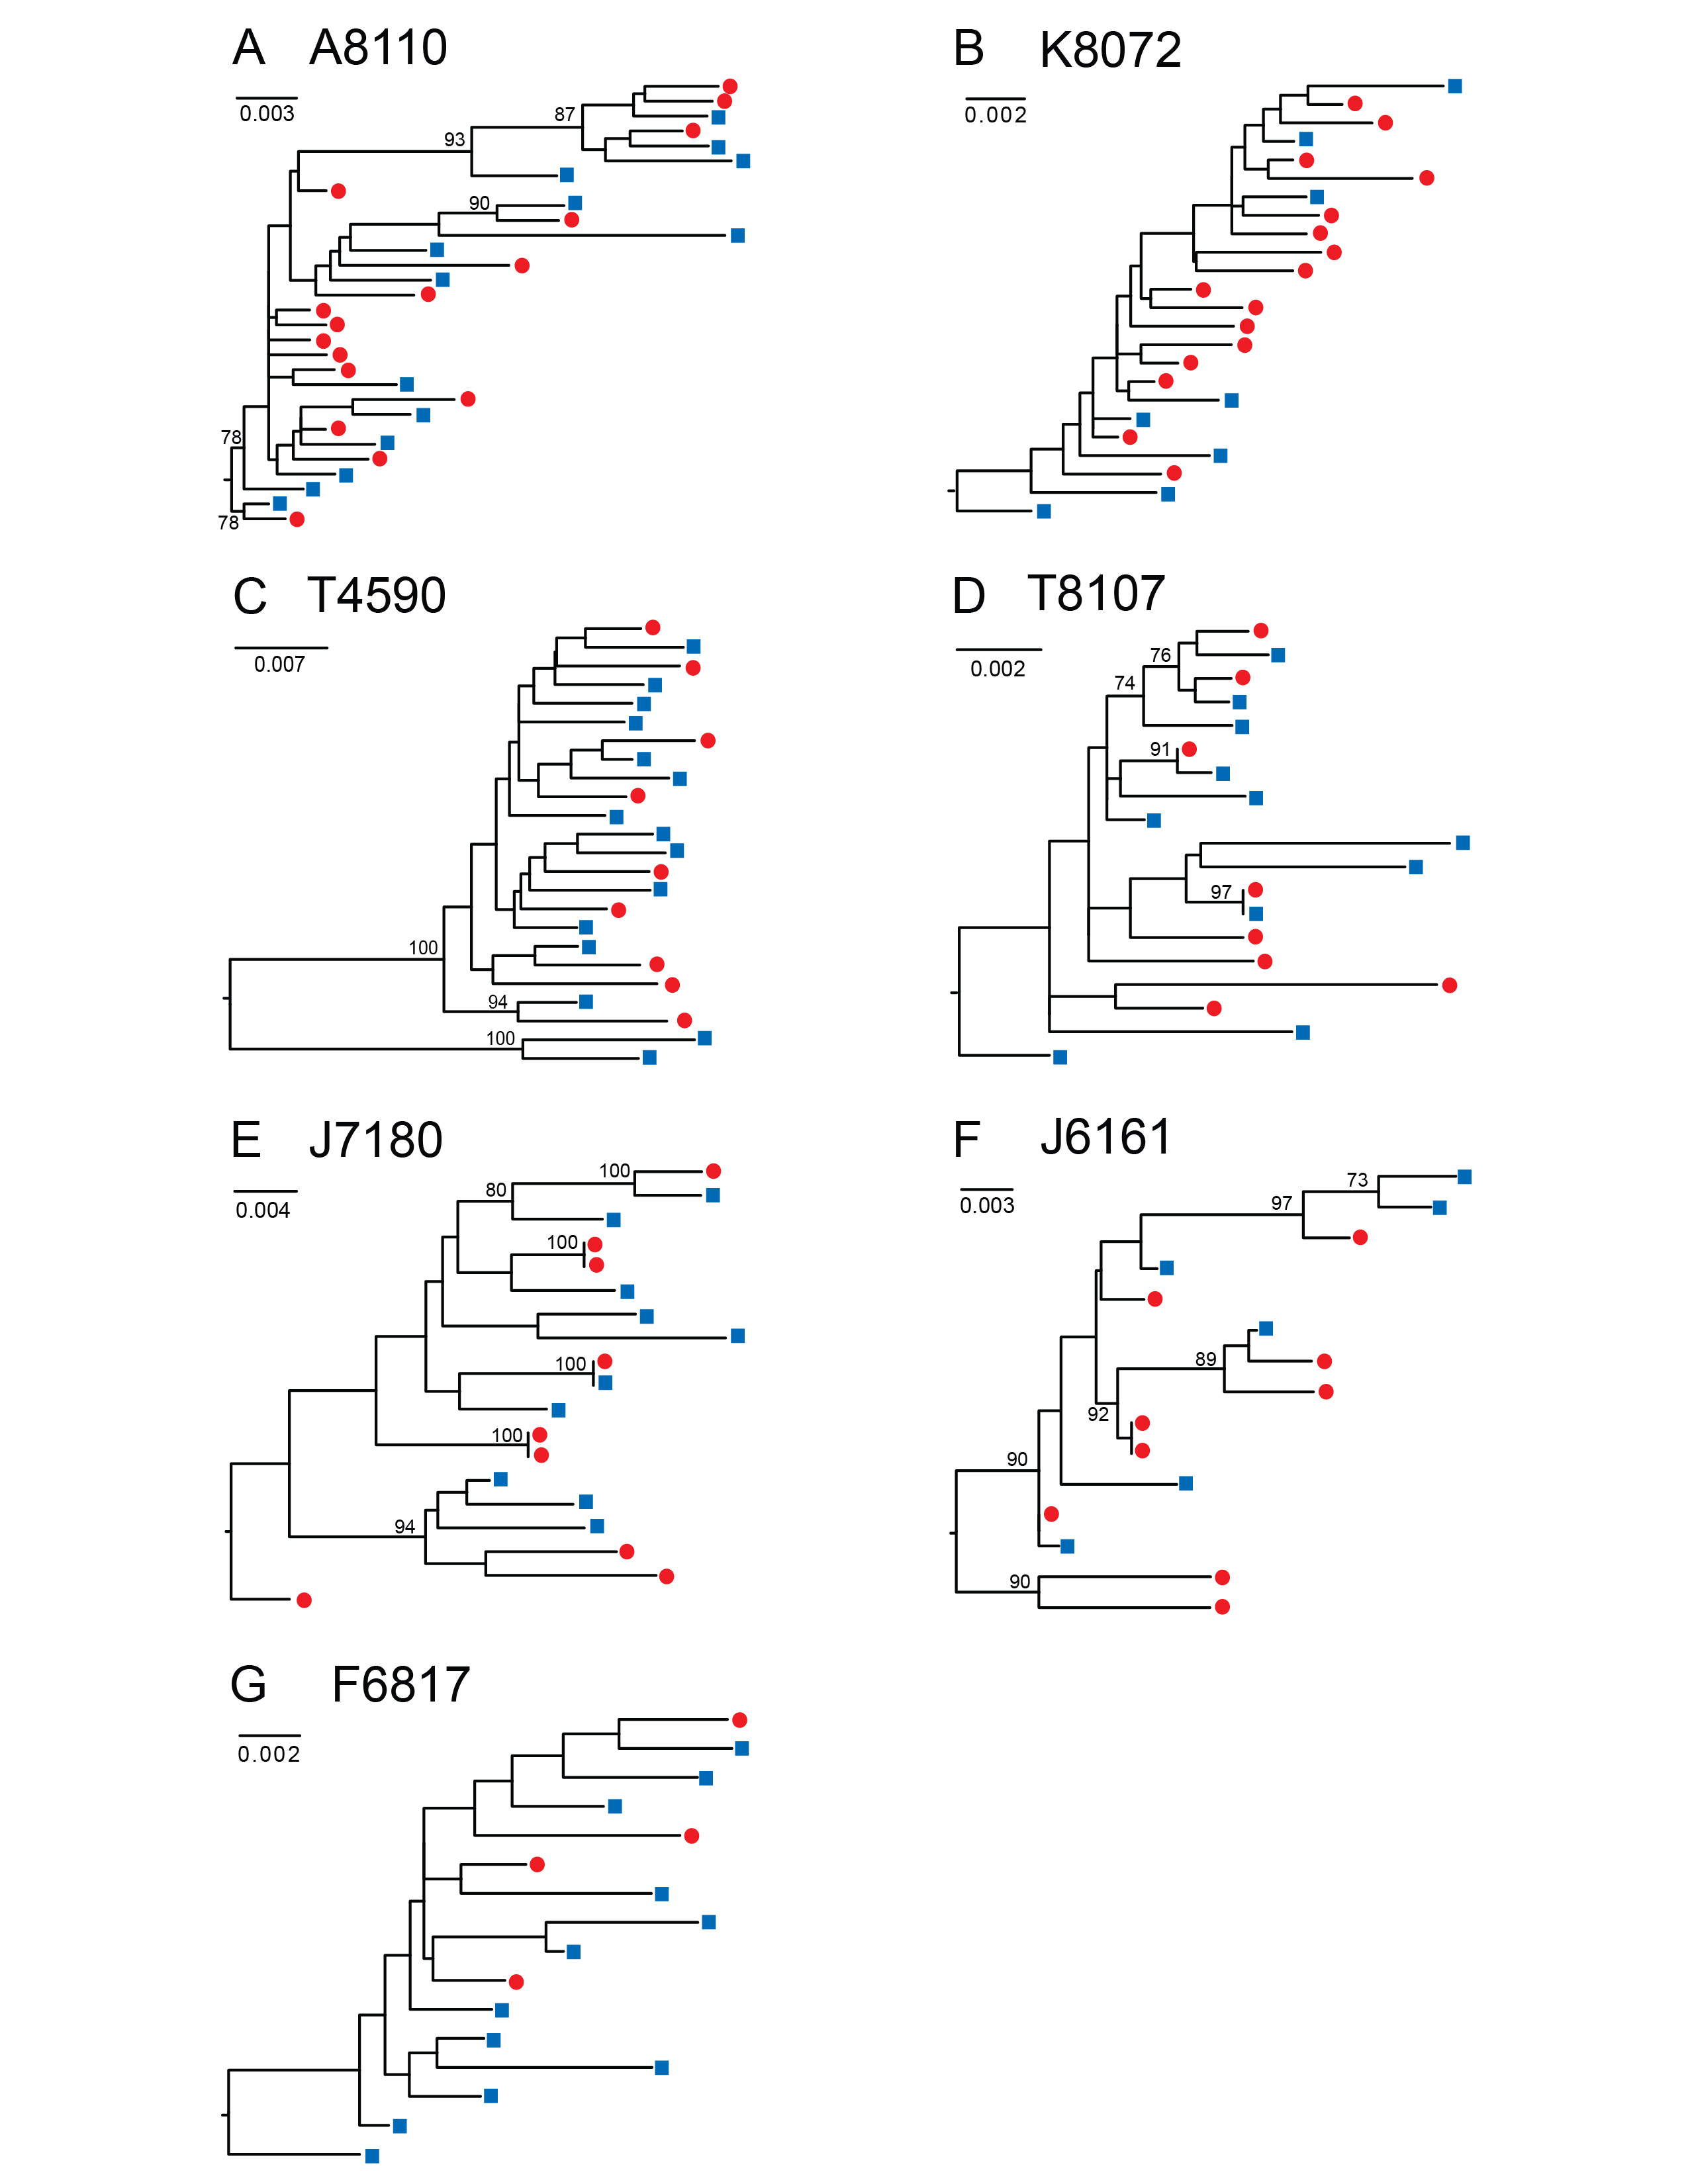
Figure 1. HIV-1 env sequences derived from DBS are genetically heterogeneous and phylogenetically indistinguishable from plasma variants. Maximum likelihood phylogenetic analyses are shown for gp160 HIV-1 env nucleotide sequences amplified by SGA from DBS (red circles) and plasma (blue squares) from seven chronically HIV-infected subjects (A to G). A single env sequence from subject T4590 (C) was excluded due to a large deletion. Numerals at nodes indicate approximate likelihood ratio test values of ≥ 0.73. The scale bar represents the number of nucleotide substitutions per site.
SGA-derived HIV-1 env sequences from chronically infected subjects are phylogenetically similar in paired DBS and plasma samples. To determine the capacity of DBS to replace plasma as a sample platform for SGA, we compared the gp160 env sequences generated from each sample source in a panel of HIV-1 infected subjects. We amplified 228 full-length HIV-1 env genes (range 15-42, median 23 sequences per subject) from paired plasma and DBS samples obtained from 7 subjects with chronic HIV-1 infection who were off antiretroviral therapy (ART) (Fiebig stage VI; n=6 antiretroviral treatment naïve subjects and n=1 subject with previous ART experience) (Table 1). The subjects had plasma viral loads ranging from 1,710 to 22,450,000 copies/ml, allowing us to test a broad range of input HIV-1 viral loads. We performed RNA extraction, cDNA synthesis and SGA from the DBS and plasma samples and compared the SGA-derived sequences phylogenetically (Figure 1). For these chronically infected subjects, maximum likelihood phylogenetic analyses showed that DBS env sequences were phylogenetically heterogeneous and indistinguishable from those derived from plasma; that is, DBS env sequences were interspersed among plasma env sequences in phylogenetic trees (Figure 1). As has been previously reported in chronic HIV-1 quasispecies, clusters of identical or near-identical sequences were noted in three chronically infected subjects (Figure 1D, E, and F), suggesting recent clonal expansion of some variants [41, 42]. In two subjects (Figure 1 D, E), these identical sequences were derived from DBS and plasma sources, reinforcing the idea that comparable populations were sequenced by the different methods. To test for bias associated with DBS vs plasma source, we tested for differences in viral diversity and compartmentalization (Table S1). Intra-patient env sequence diversity was not significantly different in any individual when tested by a two-sample test for sequence diversity. Using a phylogenetically-based Slatkin-Maddison test to investigate whether viruses from DBS had any evidence of compartmentalization, we compared the minimum possible number of intercompartmental migration events to the frequency distribution of migration events in 1,000 randomized trees [35], and found that none of the 7 chronically HIV-infected and 2 acutely infected subjects examined showed statistical evidence of compartmentalization in DBS. Last, phylogenetic analysis of all env sequences demonstrated no evidence of cross-contamination between samples, as each subject's sequences clustered in separate branches of the tree with inter-strain diversities typically observed for subtype B viruses (Figure S1).
Download as a PowerPoint Slide
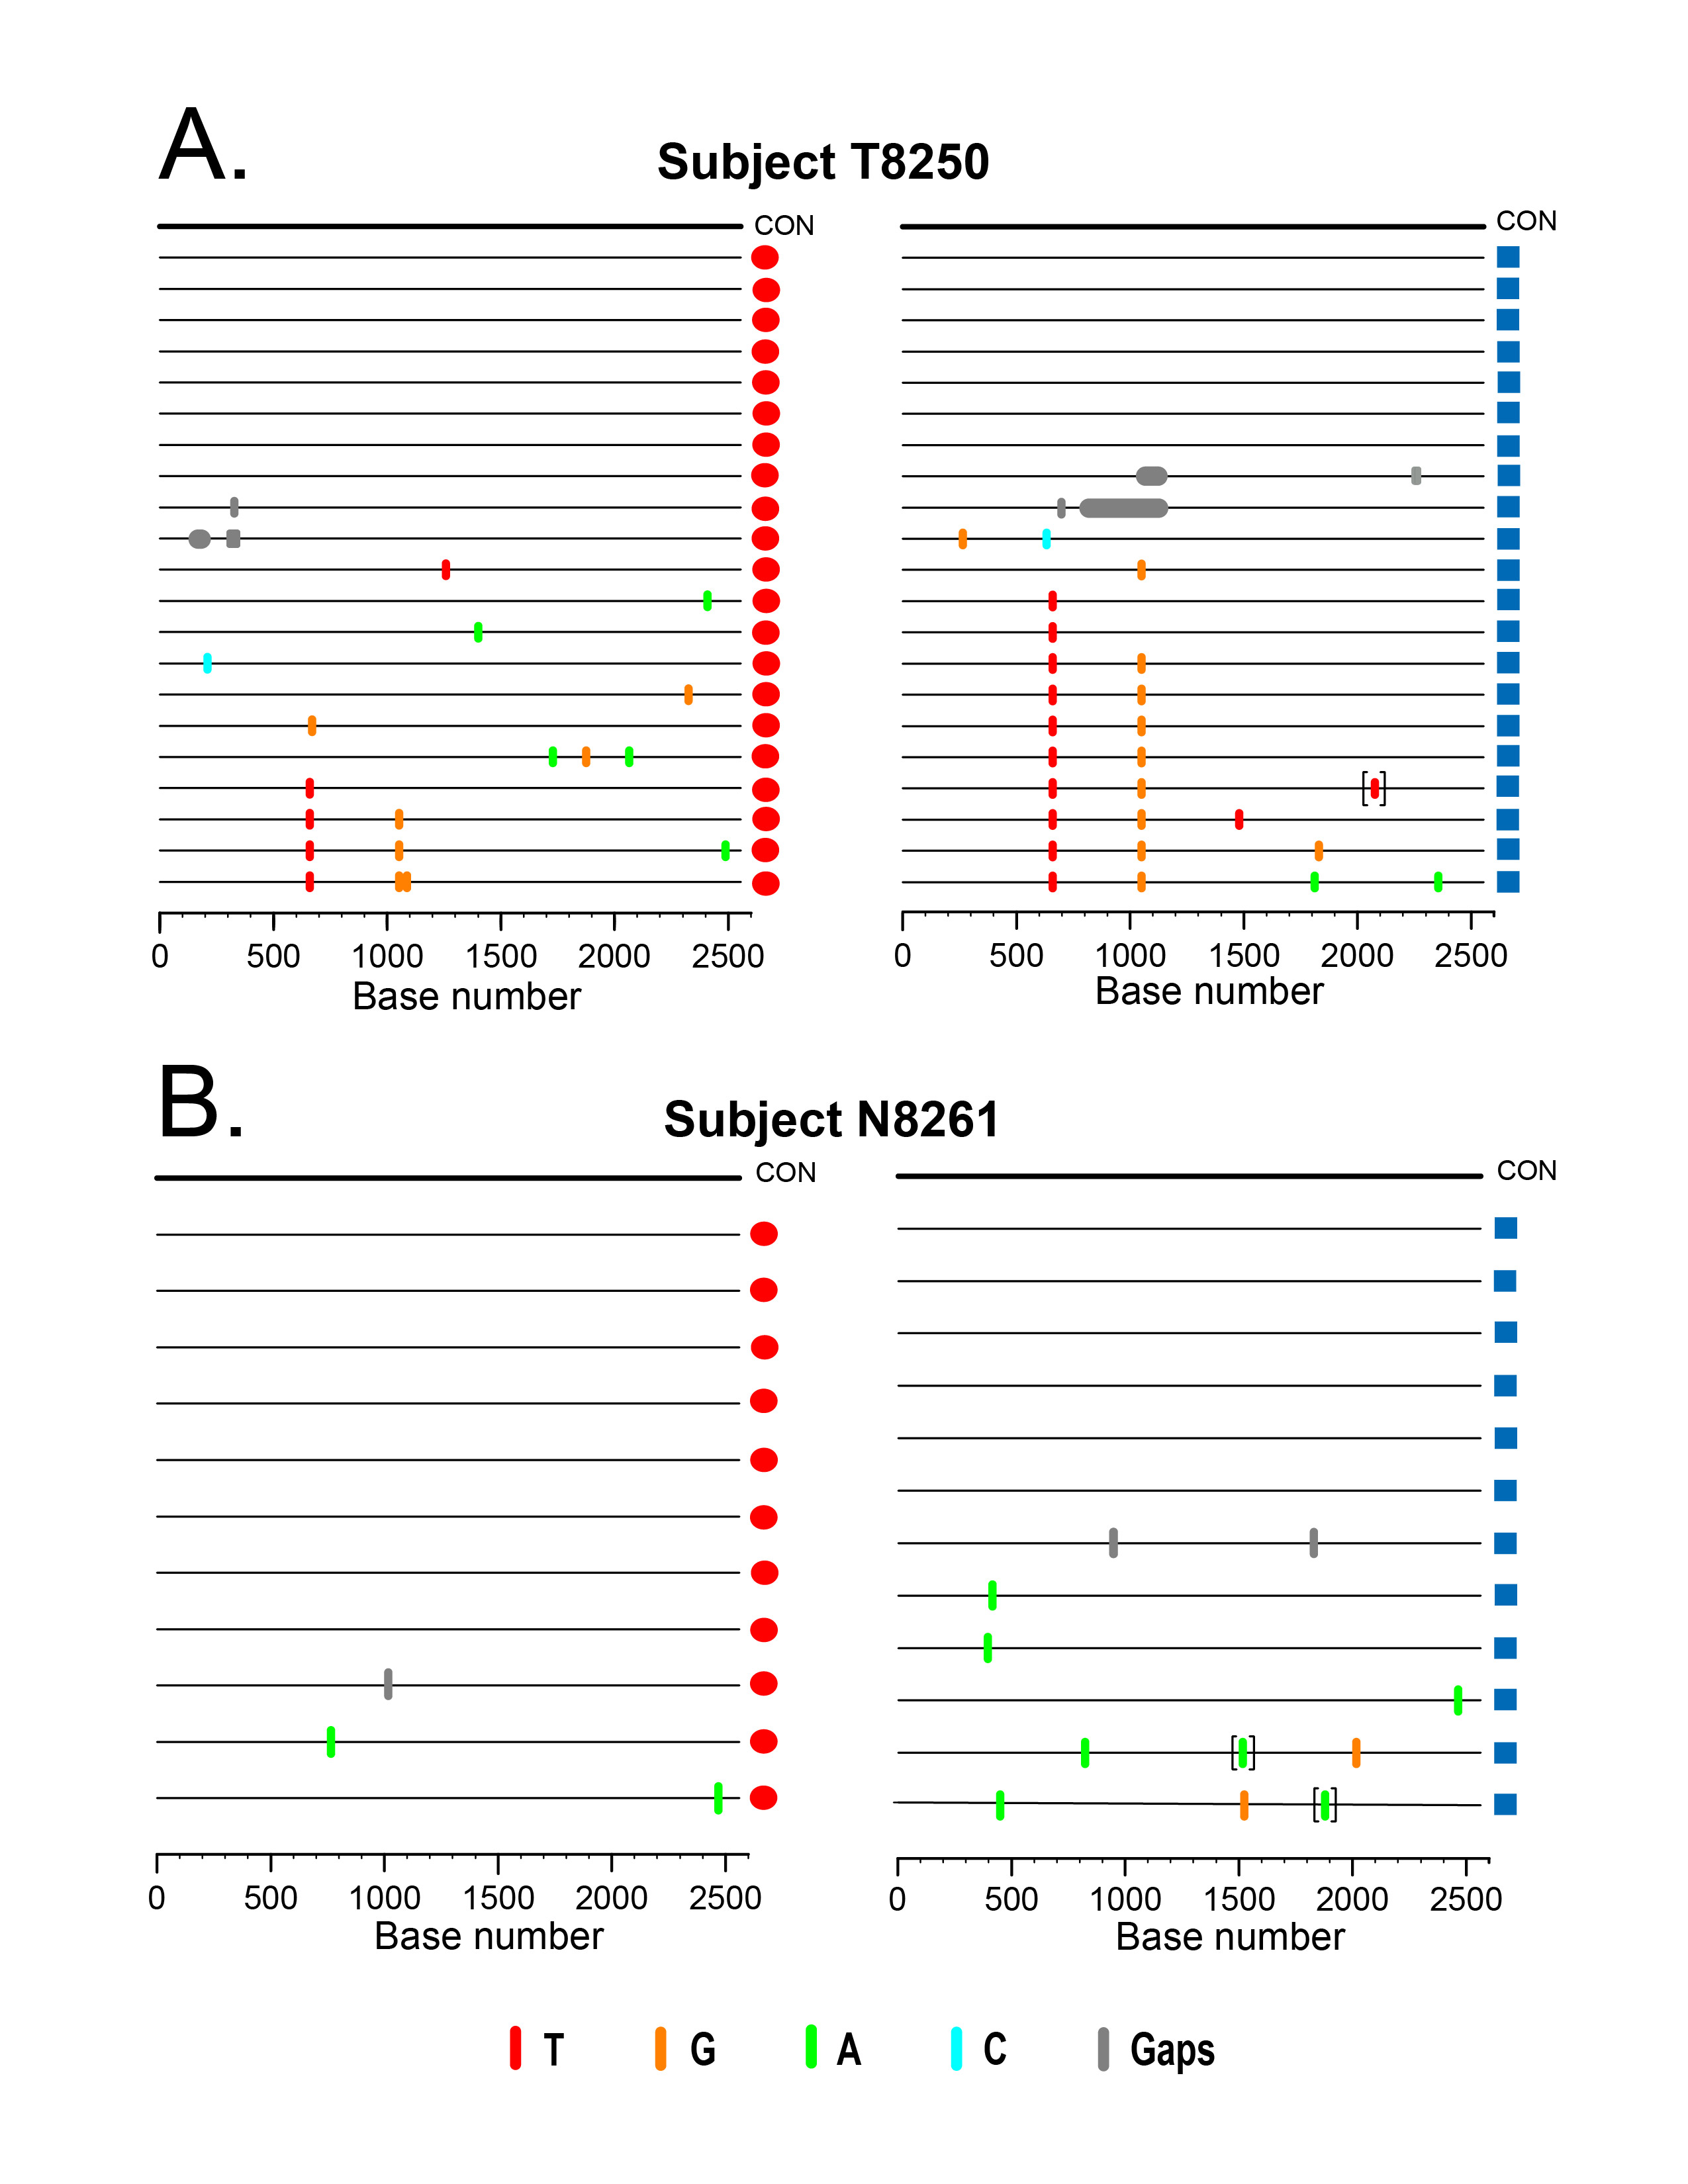
Figure 2. HIV-1 env sequences from paired DBS-plasma samples coalesce to a common ancestor in two acutely infected subjects. Highlighter plots of gp160 env sequences derived from DBS (red circles) or plasma (blue squares) from subjects T8250 (A) and N8261 (B) exhibit low genetic diversity and coalesce to identical TF env sequences for each subject. In T8250, shared polymorphisms occur at the same two nucleotide positions in both DBS and plasma sequences. Nucleotide differences from the inferred consensus sequence are indicated by tic marks color-coded for each base or gaps due to nucleotide deletions; tics inside brackets indicate nucleotide insertions. The horizontal axis indicates env nucleotide positions.
Table 3. Statistics and mathematical model estimates of the most recent common ancestor (MRCA) of HIV env sequences derived from DBS and plasma in two acutely infected individuals.
|
Sample ID |
|
|
|
|
|
|
|
|
|
|
|
T8250 DBS |
|
|
|
|
|
|
|
|
|
|
|
T8250 plasma |
|
|
|
|
|
|
|
|
|
|
|
N8261 DBS |
|
|
|
|
|
|
|
|
|
|
|
N8261 plasma |
|
|
|
|
|
|
|
|
|
|
Identification of a single HIV-1 TF gp160 env gene using either DBS or plasma. We next examined the feasibility of using DBS as an alternative sample matrix to infer the TF HIV-1 env gene sequence. Figure 2 depicts Highlighter plots of the SGA-derived gp160 env sequences from DBS and plasma from 2 acutely infected subjects. In Figure 2A and B, the sequences from subject T8250 demonstrate similar low diversity lineages for DBS and plasma-derived sequences, which coalesce into a single, identical consensus sequence that represents the TF env. The DBS and plasma sequences each demonstrate random mutations as well as two sites of shared polymorphisms (a synonymous mutation at HXB2 position 6881 and a non-synonymous mutation at position 7279), which likely represent early stochastic mutations or selection. Importantly, they are at identical positions in the DBS and plasma derived sequences. Sequences from Subject N8261 (Figure 2C, D) also demonstrate low-diversity lineages with largely identical sequences that coalesce to a single, shared TF env sequence for both DBS and plasma sequence sets. Thus, for both subjects, a low-diversity lineage coalesces to an unambiguous consensus sequence that is identical for DBS and plasma sequences. Importantly, as predicted for all TF viruses [4], the deduced amino acid sequence of the inferred consensus env gene corresponding to subjects T8250 and N8261 had intact open reading frames for the env gene and partial sequences coding for tat, rev, and vpu genes. Of interest, in both subjects the DBS sequences had a higher proportion of identical sequences (38% vs 29% and 73% vs 58%, for T8250 and N8261, respectively), a trend towards lower estimated time to MRCA (27 vs 28 days for T8250 and 6 vs 19 for N8261, with overlapping 95% CI), and better conformed to a model of random virus replication in acute HIV-1 infection when compared to plasma sequences (Table 3) [4, 43]. Strong inter-assay reproducibility was observed in the SGA sequences generated for the two acutely infected individuals. For both T8250 and N8261, SGA was performed in multiple independent sessions, each of which yielded the identical amino acid TF sequence.
Download as a PowerPoint Slide
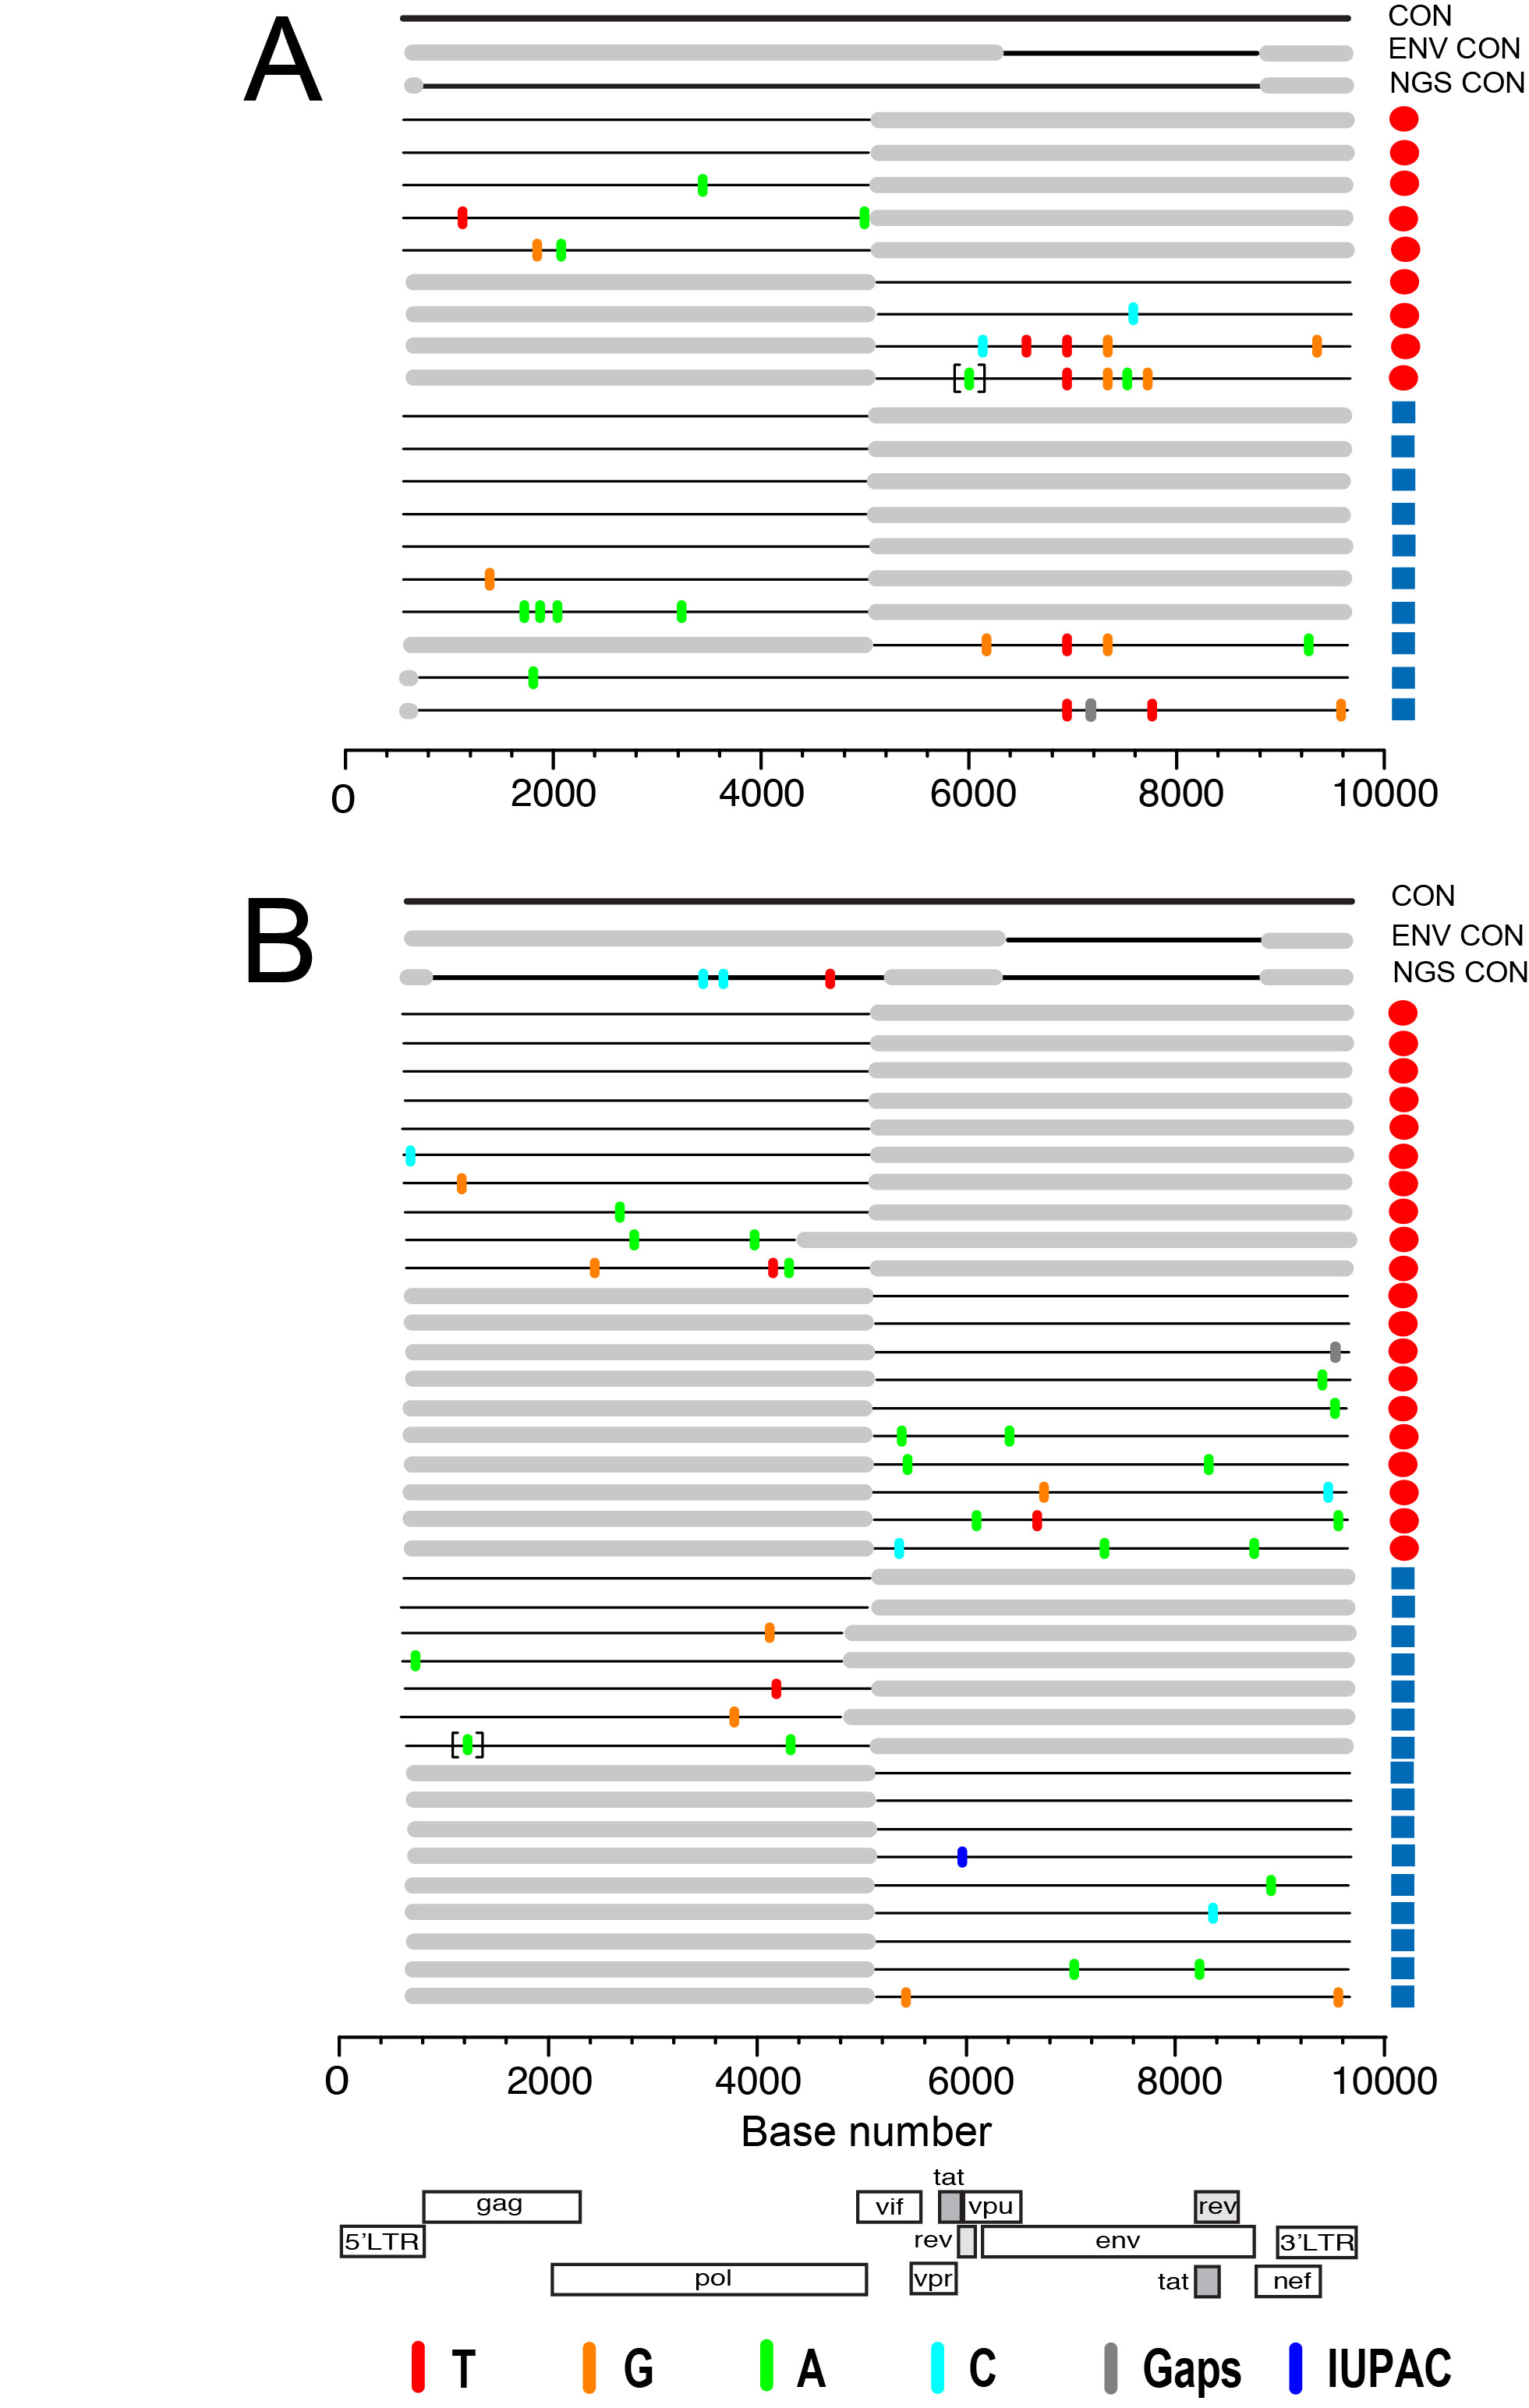
Figure 3. Comparison of whole HIV-1 genomes from DBS by SGA and deep sequencing in two acutely infected subjects. Half- and full-genome HIV-1 sequences derived from DBS (red circles) and plasma (blue squares) from subjects T8250 (A) and N8261 (B) are aligned to a patient-specific consensus master sequence from SGA sequences (top line), gp160 env sequences (second line from top), and 454 deep sequences (third line). Colored tics and brackets are as defined in Figure 2. Flanking gray boxes indicate regions not amplified, while gray tics indicate intergenomic deletions. The horizontal axis indicates nucleotide positions based on HXB2 reference sequence numbering. The HIV-1 genome cartoon at the bottom depicts the flanking LTRs and 9 canonical protein-coding genes.
Identification of the full-length HIV TF genome by SGA and next generation sequencing from DBS. We aimed to infer the complete nucleotide sequence of the TF HIV-1 virus in paired DBS-plasma samples. SGA analysis of 5′-half (n = 12), 3′-half (n = 5), and near-full length 9 Kb (n=2) genomes generated from DBS or plasma coupled with the larger set of gp160env sequences allowed the identification of the full-length TF HIV-1 genome in subject T8250 (Figure 3A). Half-genome sequences showed a Poisson distribution of mutations coalescing to a single consensus. Shared polymorphisms seen in the env gene region were resolved by using the larger set of env-only sequences; there were no additional shared polymorphisms outside the env gene. 5′-half genome sequences were highly homogeneous and had no ambiguous positions, thus allowing the identification of the full-length TF genome of subject T8250. Highlighter analysis of 5′-half (n = 17) and 3′-half (n = 19) HIV-1 genome sequences from subject N8261 also revealed a Poisson distribution of mutations (Figure 3B) which, together with the gp160env sequences, allowed inference of the identical single transmitted/founder HIV-1 genome using sequences from both DBS and plasma.
Download as a PowerPoint Slide
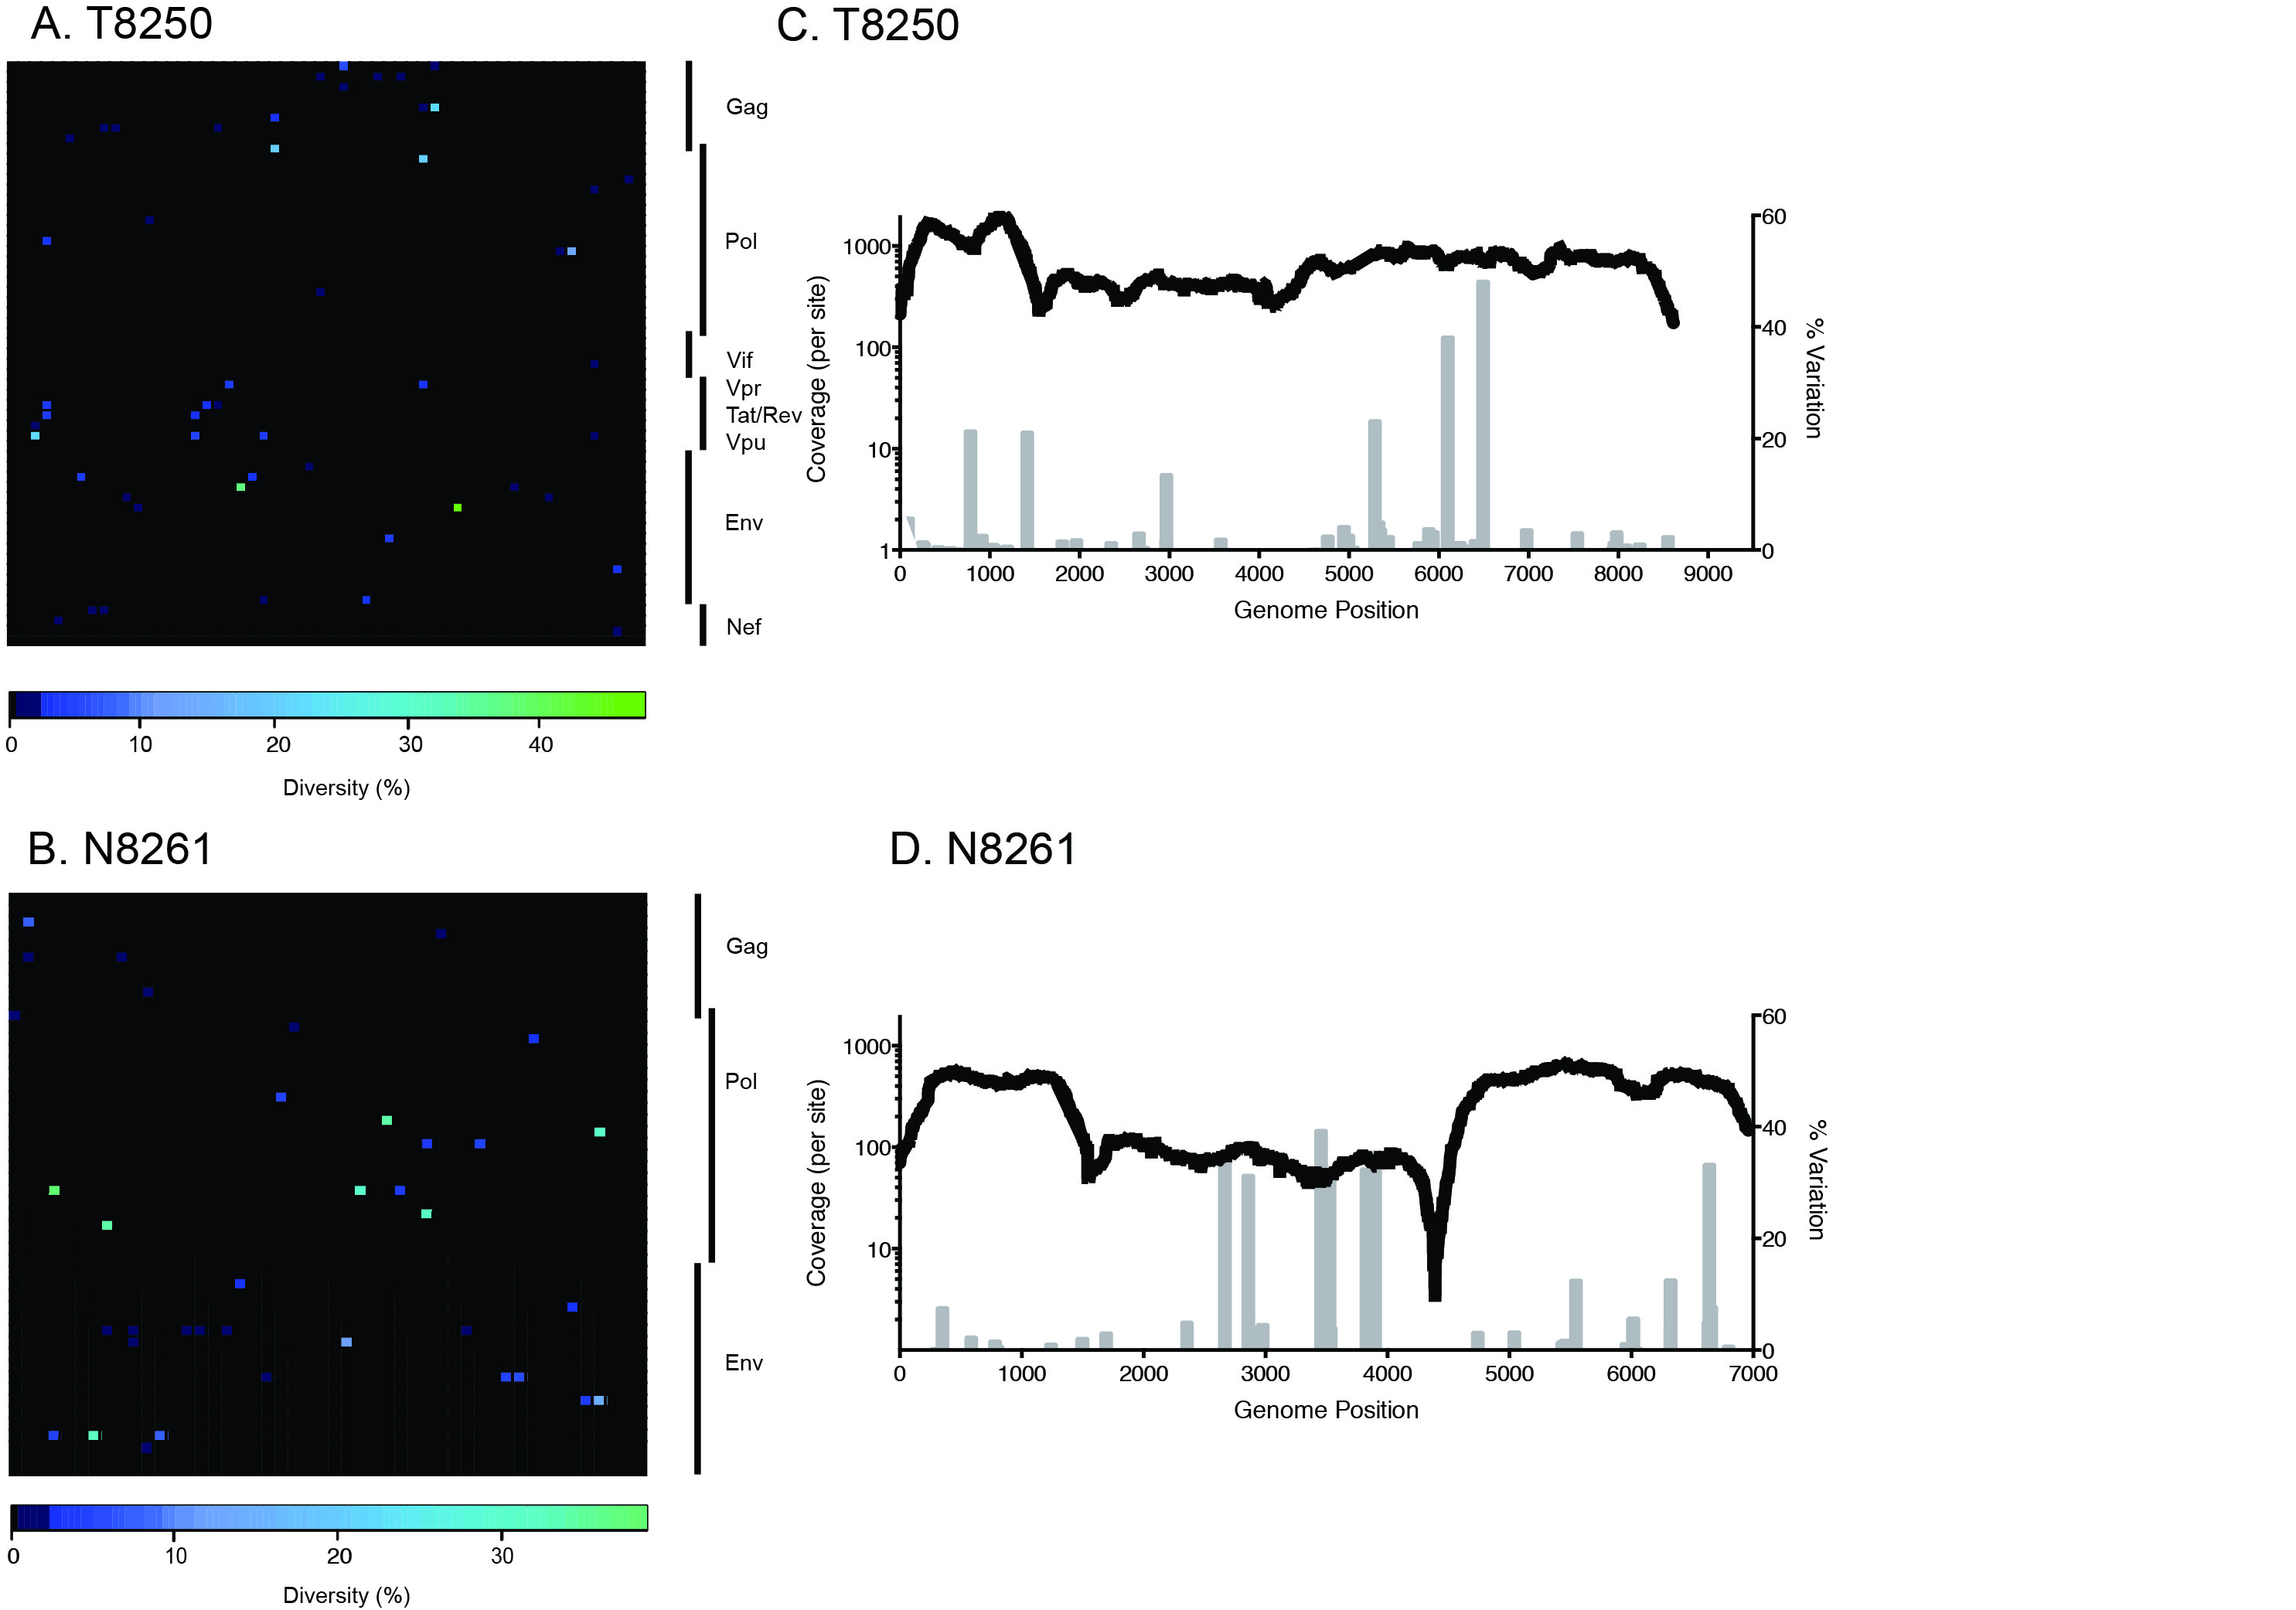
Figure 4. 454 deep sequencing of TF HIV-1 progeny in two subjects with acute infection. Heat maps illustrate both non-synonymous and synonymous codon sequence diversity of HIV-1 from DBS RNA in subjects T8250 (A) and N8261 (B). The plots are a graphical representation of the frequency of the intra-host sequence diversity with respect to the dominant codon residue (% diversity) for each codon (x-axis) of individual canonical HIV-1 proteins (y-axis). Each square represent a single codon, colored to reflect the percentage of reads that differ from the consensus residue. The diversity scale is color-coded with completely conserved residues in black and marine-blue tones for low-frequency polymorphisms in codons (< 10%), sky-blue tones for those with moderately high frequency (10–30%) and green for high frequency polymorphisms (> 30%). The entire HIV-1 proteome of subject T8250 is represented in the upper plot, whereas the pol, gag, and env proteins are depicted for patient N8261 in the lower plot. Coverage plots depicting the coverage (sequencing reads per site, black line) and the level of variation (gray bars) at a given codon across the sequenced region of the genome are shown for subjects T8250 (C) and N8261 (D).
We next assessed the capacity for DBS samples to be used in a next-generation sequencing (NGS) approach to identify the TF genome. With greater sequencing depth than standard SGA, NGS has improved sensitivity to detect minor variants (see sensitivity analysis in [4]). A direct comparison of a T8250 HIV-1 consensus sequence built from NGS sequencing reads (HXB2 positions: 501–9606) showed a 100% match with the consensus inferred by SGA of DBS and plasma (Figure 3A). Nucleotide polymorphisms are shown in heat map format in Figure 4, and demonstrate that the vast majority of codon sites exhibited low diversity, with the minor variant generally comprising less than 10% of reads. In particular, the two shared polymorphisms in the env gene detected by SGA were also observed by NGS at modestly higher frequencies. The GCC to GCT synonymous mutation at HXB2 position 6881 occurred in 38% of 336 high quality deep sequencing reads and 19% (4 out of 21) of SGA-derived env sequences from DBS, while the CAA to CGA non-synonymous mutation at position 7279 occurred in 48% of 509 deep sequencing reads (shown in green on the heatmap in Figure 4A) and 14% (3 out of 21) of SGA-derived env sequences. A third shared polymorphism detected in 23% of deep sequencing reads (547 HQ read depth) in the vpu gene (HXB2 position 6072) was observed in 25% (1 out of 4) of 3′-half sequences from DBS. Four additional shared polymorphisms that were not sampled by SGA were detected by NGS at frequencies ranging from 6% to 21% in the gag/pol region (HQ read depth range: 164–712) (Figure 4C). In N8261, the consensus sequence constructed from NGS sequencing reads showed a 99.96% match with the consensus sequence inferred by SGA of DBS and plasma (Figure 3B) with only 3 nucleotide differences in pol distinguishing the 2 methods. For the 3 nucleotide discrepancies, the number of NGS quality reads was relatively low (< 100) (Figure 4D) and the SGA consensus bases were observed, but represented minor variants (frequency of 31–35%). Finally, as predicted, the inferred TF genome of the virus in both T8250 and N8261 coded for an intact viral proteome for all major canonical HIV-1 proteins.
Discussion
In the present study, we tested the feasibility of using DBS to amplify full-length HIV-1 env genes by SGA and deep sequencing to assess sequence diversity in chronic infection and identify the full-length TF HIV-1 genome (or env gene) in recently infected individuals. We found that SGA from vRNA extracted from matched DBS and plasma were phylogenetically indistinguishable in representing the diversity of chronic HIV-1 quasispecies. This demonstration suggests that sophisticated sequence analyses are possible in research subjects and clinical trial participants throughout the world, including those sampled in locations far from a centralized laboratory facility. We also found that sequences from matched DBS and plasma samples identified a single TF virus with an identical env gene and full-length HIV-1 genome sequences by SGA and deep sequencing methodologies. Our study provides proof of concept that DBS can be used for both SGA and deep sequencing methods that form the cornerstone of modern molecular virology research.
While less efficient than sequencing vRNA extracted from plasma that is flash frozen and stored at −80ºC, vRNA yields from DBS are sufficient for the vast majority of viral analyses currently employed, including identification of the complete TF genome. For env analyses, each DBS yielded between 4 and >20 gp160 env sequences. Given the 5 DBS per typical commercially available DBS card and the potential to relatively easily collect multiple cards per subject at one time, the 10–30 sequences generally used to infer the TF virus [1-5, 14, 15], are achievable. Similar numbers of sequences would be adequate to measure other viral parameters, including the characterization of the complex viral populations that could break through a suppressive and/or curative therapy and characterization of the HIV-1 quasispecies in an actively viremic individual off antiretroviral therapy.
Our analysis found that the efficiency of SGA from DBS was dependent on several factors, including the RNA extraction method and storage time and temperature. We utilized a fairly standard vRNA isolation procedure to achieve sufficient yields to perform SGA; expectedly, variations on this protocol altered the efficiency of this process. As demonstrated in a recent study by Monleau and colleagues [40], additional RNA isolation assay optimization could increase efficiency further. As expected, we found that nucleic acid degradation occurred with DBS stored for weeks at ambient temperatures and, to a lesser extent, for months at −20ºC. The fact that storage of a single DBS sample for just 1 day at ambient temperature showed the highest efficiency in env amplification (41% using a TRIzol-alone protocol) compared to the significant lower efficiencies after 6–20 days of storage (Table 2) suggest that either prompt processing or immediate transfer of DBS cards to −20°C should result in higher PCR yields. The latter is supported by the observation that DBS placed at −20ºC within three weeks of collection preserved 19.4% to 88.9% of the RNA molecules remaining intact after the initial storage at ambient temperature, and those placed in freezers earlier (within a week) were even better preserved (Table 2). Further, DBS cards stored for months in non-frost-free −20ºC freezers maintained much of their viability. Though we do not expect RNA degradation to be biased towards any particular RNA populations and do not suspect it would affect phylogenetic patterns, we did not directly test this. The World Health Organization recommends ≤14 days at ambient temperature after collection of DBS, which are then stored at −20ºC or −80ºC for monitoring HIV-1 drug resistance [28, 44]; this protocol would similarly maintain viability for SGA. A limitation of our study was the lack of assessment of the effects of the warm, humid conditions experienced in many tropical field settings. While this has decreased the efficiency of DBS-based assays in other studies [27, 45-47], we note the recent report from Zambia demonstrating successful PCR amplification of the HIV-1 DNA template from DBS [29]. While Seu and colleagues did not report sequencing results, their results strongly suggest that PCR and SGA are feasible in resource-limited field settings, though additional, larger field studies are warranted.
Several findings from the comparisons of matched DBS and plasma-derived acute HIV sequences suggest that our DBS sequences represent a mixture of plasma HIV-1 RNA and cell-associated proviral DNA (or, less likely, cell associated RNA). To begin, we found that plasma viral load measurements did not correlate with the efficiency of SGA. Indeed, samples with orders of magnitude differences in plasma viral load had relatively similar efficiencies in gp160 env amplification (Table 2). Further, compared to acute plasma-derived sequences, matched DBS sequences showed a trend towards greater identity with the TF virus and lower estimates of time to MRCA (Table 3). Cell-free HIV-1 plasma virions have remarkably short half-lives (< 1 day) [48] and represent only the most recent rounds of viral replication. Cellular proviral DNA or cellular RNA, in contrast, may represent longer-lived virus sequences from replication cycles occurring days to weeks earlier. These more archival sequences therefore lack the additional random polymorphisms that accrue over time and are genetically closer to the TF virus. The discordance between plasma viral load and SGA sequence yield coupled with more ancestral (more TF-like virus) populations sampled by DBS suggest that DBS contain both plasma vRNA and proviral DNA. While we used a nucleic acid isolation protocol designed to preferentially extract RNA over DNA, it is likely that a certain amount of proviral DNA was also isolated. The presence of proviral DNA in DBS is well established [22, 28]; a recent study by Masciotra and colleagues employing nonspecific nucleic acid extraction techniques found that as many as half of tested samples had amplifiable proviral DNA, with greater frequencies (up to 58%) in samples with higher plasma viral loads [22]. In addition, storage at ambient temperature may lead to degradation of the less stable vRNA and relative overrepresentation of DNA [27, 45-47]. Interestingly, increased representation of HIV DNA may actually be advantageous for TF identification. SGA of plasma vRNA and proviral DNA have been validated as equally able to identify the TF virus in acute samples [5] and the ability to amplify sequences representing earlier viral populations is beneficial to TF virus inference. In clinical specimens with low viral loads in chronically infected individuals, whose proviral DNA may reflect archived or defective virus, DNase treatment of DBS extracts should be considered to better reflect actively replicating plasma viral RNA [47].
As expected in the complex chronic HIV quasispecies, which are substantially more diverse and responding to multiple selective immune responses, subtle differences in timing between free plasma virus and cell-associated virus were not detected. Phylogenetically, paired DBS-plasma samples were highly similar; in fact, identical sequences from DBS and plasma were identified in several patients (Figure 1) and suggest that DBS and plasma are relatively equivalent specimens with which to characterize the circulating chronic HIV-1 viral quasispecies. Thus, we conclude that RNA-targeting nucleic acid isolation from DBS results in vRNA and some fraction of proviral DNA or cell-associated RNA that are less represented in acellular plasma. Importantly, this DNA does not alter the capacity for DBS to be used to accurately identify the TF virus and/or characterize chronic viral quasispecies. This conclusion echoes similar findings from previous studies of DBS-based assessments of clinically relevant HIV parameters, including plasma viral load and genotypic drug resistance, wherein subtle differences between matched DBS and plasma assays were attributed to contributions from DNA, but results from the matched samples were largely equivalent (reviewed in [21]).
In summary, this study demonstrates the feasibility of DBS as specimens for TF identification and viral diversity analyses in general. DBS provides significant cost savings and logistical advantages over standard plasma specimens. The capacity to utilize DBS in technically demanding molecular virology techniques expands opportunities for comprehensive and sophisticated studies in clinical trials and translational research to resource-limited settings across the world, including places where HIV-1 is most prevalent and intervention is most critical.
Acknowledgments
We thank the University of Alabama at Birmingham Center for AIDS Research (CFAR) DNA Sequencing core (P30AI027767) for providing DNA sequencing analyses. Our thanks to Kamellia Safavy for processing patients’ blood and preparing the DBS.
Financial Support
DCT was supported by an amfAR Mathilde Krim Fellowship award (108683-55-RKMT).
References
1. Abrahams MR, Anderson JA, Giorgi EE, Seoighe C, Mlisana K, Ping LH, Athreya GS, Treurnicht FK, Keele BF, Wood N, Salazar-Gonzalez JF, Bhattacharya T, Chu H, Hoffman I, Galvin S, Mapanje C, Kazembe P, Thebus R, Fiscus S, Hide W, Cohen MS, Karim SA, Haynes BF, Shaw GM, Hahn BH, Korber BT, Swanstrom R, Williamson C, Team CAIS, Center for HIVAVIC. Quantitating the multiplicity of infection with human immunodeficiency virus type 1 subtype C reveals a non-poisson distribution of transmitted variants. J Virol. 2009;83(8):3556-67. PubMed PMID: 19193811. Pubmed Central PMCID: 2663249. doi: 10.1128/JVI.02132-08
2. Bar KJ, Li H, Chamberland A, Tremblay C, Routy JP, Grayson T, Sun C, Wang S, Learn GH, Morgan CJ, Schumacher JE, Haynes BF, Keele BF, Hahn BH, Shaw GM. Wide variation in the multiplicity of HIV-1 infection among injection drug users. J Virol. 2010;84(12):6241-7. PubMed PMID: 20375173. Pubmed Central PMCID: 2876625. doi: 10.1128/JVI.00077-10
3. Haaland RE, Hawkins PA, Salazar-Gonzalez J, Johnson A, Tichacek A, Karita E, Manigart O, Mulenga J, Keele BF, Shaw GM, Hahn BH, Allen SA, Derdeyn CA, Hunter E. Inflammatory genital infections mitigate a severe genetic bottleneck in heterosexual transmission of subtype A and C HIV-1. PLoS Pathog. 2009;5(1):e1000274. PubMed PMID: 19165325. Pubmed Central PMCID: 2621345. doi: 10.1371/journal.ppat.1000274
4. Keele BF, Giorgi EE, Salazar-Gonzalez JF, Decker JM, Pham KT, Salazar MG, Sun C, Grayson T, Wang S, Li H, Wei X, Jiang C, Kirchherr JL, Gao F, Anderson JA, Ping LH, Swanstrom R, Tomaras GD, Blattner WA, Goepfert PA, Kilby JM, Saag MS, Delwart EL, Busch MP, Cohen MS, Montefiori DC, Haynes BF, Gaschen B, Athreya GS, Lee HY, Wood N, Seoighe C, Perelson AS, Bhattacharya T, Korber BT, Hahn BH, Shaw GM. Identification and characterization of transmitted and early founder virus envelopes in primary HIV-1 infection. Proc Natl Acad Sci U S A. 2008;105(21):7552-7. PubMed PMID: 18490657. Pubmed Central PMCID: 2387184. doi: 10.1073/pnas.0802203105
5. Li H, Bar KJ, Wang S, Decker JM, Chen Y, Sun C, Salazar-Gonzalez JF, Salazar MG, Learn GH, Morgan CJ, Schumacher JE, Hraber P, Giorgi EE, Bhattacharya T, Korber BT, Perelson AS, Eron JJ, Cohen MS, Hicks CB, Haynes BF, Markowitz M, Keele BF, Hahn BH, Shaw GM. High Multiplicity Infection by HIV-1 in Men Who Have Sex with Men. PLoS Pathog. 2010;6(5):e1000890. PubMed PMID: 20485520. Pubmed Central PMCID: 2869329. doi: 10.1371/journal.ppat.1000890
6. Salazar-Gonzalez JF, Bailes E, Pham KT, Salazar MG, Guffey MB, Keele BF, Derdeyn CA, Farmer P, Hunter E, Allen S, Manigart O, Mulenga J, Anderson JA, Swanstrom R, Haynes BF, Athreya GS, Korber BT, Sharp PM, Shaw GM, Hahn BH. Deciphering human immunodeficiency virus type 1 transmission and early envelope diversification by single-genome amplification and sequencing. J Virol. 2008;82(8):3952-70. PubMed PMID: 18256145. Pubmed Central PMCID: 2293010. doi: 10.1128/JVI.02660-07
7. Salazar-Gonzalez JF, Salazar MG, Keele BF, Learn GH, Giorgi EE, Li H, Decker JM, Wang S, Baalwa J, Kraus MH, Parrish NF, Shaw KS, Guffey MB, Bar KJ, Davis KL, Ochsenbauer-Jambor C, Kappes JC, Saag MS, Cohen MS, Mulenga J, Derdeyn CA, Allen S, Hunter E, Markowitz M, Hraber P, Perelson AS, Bhattacharya T, Haynes BF, Korber BT, Hahn BH, Shaw GM. Genetic identity, biological phenotype, and evolutionary pathways of transmitted/founder viruses in acute and early HIV-1 infection. J Exp Med. 2009;206(6):1273-89. PubMed PMID: 19487424. Pubmed Central PMCID: 2715054. doi: 10.1084/jem.20090378
8. Palmer S, Kearney M, Maldarelli F, Halvas EK, Bixby CJ, Bazmi H, Rock D, Falloon J, Davey RT, Jr., Dewar RL, Metcalf JA, Hammer S, Mellors JW, Coffin JM. Multiple, linked human immunodeficiency virus type 1 drug resistance mutations in treatment-experienced patients are missed by standard genotype analysis. J Clin Microbiol. 2005;43(1):406-13. PubMed PMID: 15635002. Pubmed Central PMCID: 540111. doi: 10.1128/JCM.43.1.406-413.2005
9. Sterrett S, Learn GH, Edlefsen PT, Haynes BF, Hahn BH, Shaw GM, Bar KJ. Low Multiplicity of HIV-1 Infection and No Vaccine Enhancement in VAX003 Injection Drug Users. Open Forum Infect Dis. 2014;1(2):ofu056. PubMed PMID: 25734126. Pubmed Central PMCID: 4281816. doi: 10.1093/ofid/ofu056
10. Bar KJ, Tsao CY, Iyer SS, Decker JM, Yang Y, Bonsignori M, Chen X, Hwang KK, Montefiori DC, Liao HX, Hraber P, Fischer W, Li H, Wang S, Sterrett S, Keele BF, Ganusov VV, Perelson AS, Korber BT, Georgiev I, McLellan JS, Pavlicek JW, Gao F, Haynes BF, Hahn BH, Kwong PD, Shaw GM. Early low-titer neutralizing antibodies impede HIV-1 replication and select for virus escape. PLoS Pathog. 2012;8(5):e1002721. PubMed PMID: 22693447. Pubmed Central PMCID: 3364956. doi: 10.1371/journal.ppat.1002721
11. Goonetilleke N, Liu MK, Salazar-Gonzalez JF, Ferrari G, Giorgi E, Ganusov VV, Keele BF, Learn GH, Turnbull EL, Salazar MG, Weinhold KJ, Moore S, B CCC, Letvin N, Haynes BF, Cohen MS, Hraber P, Bhattacharya T, Borrow P, Perelson AS, Hahn BH, Shaw GM, Korber BT, McMichael AJ. The first T cell response to transmitted/founder virus contributes to the control of acute viremia in HIV-1 infection. J Exp Med. 2009;206(6):1253-72. PubMed PMID: 19487423. Pubmed Central PMCID: 2715063. doi: 10.1084/jem.20090365
12. Edlefsen PT, Gilbert PB, Rolland M. Sieve analysis in HIV-1 vaccine efficacy trials. Curr Opin HIV AIDS. 2013;8(5):432-6. PubMed PMID: 23719202. Pubmed Central PMCID: 3863593. doi: 10.1097/COH.0b013e328362db2b
13. Edlefsen PT, Rolland M, Hertz T, Tovanabutra S, Gartland AJ, deCamp AC, Magaret CA, Ahmed H, Gottardo R, Juraska M, McCoy C, Larsen BB, Sanders-Buell E, Carrico C, Menis S, Bose M, Team RVS, Arroyo MA, O'Connell RJ, Nitayaphan S, Pitisuttithum P, Kaewkungwal J, Rerks-Ngarm S, Robb ML, Kirys T, Georgiev IS, Kwong PD, Scheffler K, Pond SL, Carlson JM, Michael NL, Schief WR, Mullins JI, Kim JH, Gilbert PB. Comprehensive sieve analysis of breakthrough HIV-1 sequences in the RV144 vaccine efficacy trial. PLoS Comput Biol. 2015;11(2):e1003973. PubMed PMID: 25646817. Pubmed Central PMCID: 4315437. doi: 10.1371/journal.pcbi.1003973
14. Rolland M, Edlefsen PT, Larsen BB, Tovanabutra S, Sanders-Buell E, Hertz T, deCamp AC, Carrico C, Menis S, Magaret CA, Ahmed H, Juraska M, Chen L, Konopa P, Nariya S, Stoddard JN, Wong K, Zhao H, Deng W, Maust BS, Bose M, Howell S, Bates A, Lazzaro M, O'Sullivan A, Lei E, Bradfield A, Ibitamuno G, Assawadarachai V, O'Connell RJ, deSouza MS, Nitayaphan S, Rerks-Ngarm S, Robb ML, McLellan JS, Georgiev I, Kwong PD, Carlson JM, Michael NL, Schief WR, Gilbert PB, Mullins JI, Kim JH. Increased HIV-1 vaccine efficacy against viruses with genetic signatures in Env V2. Nature. 2012;490(7420):417-20. PubMed PMID: 22960785. Pubmed Central PMCID: 3551291. doi: 10.1038/nature11519
15. Rolland M, Tovanabutra S, deCamp AC, Frahm N, Gilbert PB, Sanders-Buell E, Heath L, Magaret CA, Bose M, Bradfield A, O'Sullivan A, Crossler J, Jones T, Nau M, Wong K, Zhao H, Raugi DN, Sorensen S, Stoddard JN, Maust BS, Deng W, Hural J, Dubey S, Michael NL, Shiver J, Corey L, Li F, Self SG, Kim J, Buchbinder S, Casimiro DR, Robertson MN, Duerr A, McElrath MJ, McCutchan FE, Mullins JI. Genetic impact of vaccination on breakthrough HIV-1 sequences from the STEP trial. Nat Med. 2011;17(3):366-71. PubMed PMID: 21358627. Pubmed Central PMCID: 3053571. doi: 10.1038/nm.2316
16. Roederer M, Keele BF, Schmidt SD, Mason RD, Welles HC, Fischer W, Labranche C, Foulds KE, Louder MK, Yang ZY, Todd JP, Buzby AP, Mach LV, Shen L, Seaton KE, Ward BM, Bailer RT, Gottardo R, Gu W, Ferrari G, Alam SM, Denny TN, Montefiori DC, Tomaras GD, Korber BT, Nason MC, Seder RA, Koup RA, Letvin NL, Rao SS, Nabel GJ, Mascola JR. Immunological and virological mechanisms of vaccine-mediated protection against SIV and HIV. Nature. 2014;505(7484):502-8. PubMed PMID: 24352234. Pubmed Central PMCID: 3946913. doi: 10.1038/nature12893
17. Lee FH, Mason R, Welles H, Learn GH, Keele BF, Roederer M, Bar KJ. Breakthrough Virus Neutralization Resistance as a Correlate of Protection in a Nonhuman Primate Heterologous Simian Immunodeficiency Virus Vaccine Challenge Study. J Virol. 2015;89(24):12388-400. PubMed PMID: 26423953. Pubmed Central PMCID: 4665252. doi: 10.1128/JVI.01531-15
18. Caskey M, Klein F, Lorenzi JC, Seaman MS, West AP, Jr., Buckley N, Kremer G, Nogueira L, Braunschweig M, Scheid JF, Horwitz JA, Shimeliovich I, Ben-Avraham S, Witmer-Pack M, Platten M, Lehmann C, Burke LA, Hawthorne T, Gorelick RJ, Walker BD, Keler T, Gulick RM, Fatkenheuer G, Schlesinger SJ, Nussenzweig MC. Viraemia suppressed in HIV-1-infected humans by broadly neutralizing antibody 3BNC117. Nature. 2015;522(7557):487-91. PubMed PMID: 25855300. doi: 10.1038/nature14411
19. Henrich TJ, Hanhauser E, Marty FM, Sirignano MN, Keating S, Lee TH, Robles YP, Davis BT, Li JZ, Heisey A, Hill AL, Busch MP, Armand P, Soiffer RJ, Altfeld M, Kuritzkes DR. Antiretroviral-free HIV-1 remission and viral rebound after allogeneic stem cell transplantation: report of 2 cases. Ann Intern Med. 2014;161(5):319-27. PubMed PMID: 25047577. Pubmed Central PMCID: 4236912. doi: 10.7326/M14-1027
20. Lynch RM, Boritz E, Coates EE, DeZure A, Madden P, Costner P, Enama ME, Plummer S, Holman L, Hendel CS, Gordon I, Casazza J, Conan-Cibotti M, Migueles SA, Tressler R, Bailer RT, McDermott A, Narpala S, O'Dell S, Wolf G, Lifson JD, Freemire BA, Gorelick RJ, Pandey JP, Mohan S, Chomont N, Fromentin R, Chun TW, Fauci AS, Schwartz RM, Koup RA, Douek DC, Hu Z, Capparelli E, Graham BS, Mascola JR, Ledgerwood JE, Team VRCS. Virologic effects of broadly neutralizing antibody VRC01 administration during chronic HIV-1 infection. Sci Transl Med. 2015;7(319):319ra206. PubMed PMID: 26702094. doi: 10.1126/scitranslmed.aad5752
21. Bertagnolio S, Parkin NT, Jordan M, Brooks J, Garcia-Lerma JG. Dried blood spots for HIV-1 drug resistance and viral load testing: A review of current knowledge and WHO efforts for global HIV drug resistance surveillance. AIDS Rev. 2010;12(4):195-208. PubMed PMID: 21179184.
22. Masciotra S, Garrido C, Youngpairoj AS, McNulty A, Zahonero N, Corral A, Heneine W, de Mendoza C, Garcia-Lerma JG. High concordance between HIV-1 drug resistance genotypes generated from plasma and dried blood spots in antiretroviral-experienced patients. AIDS. 2007;21(18):2503-11. PubMed PMID: 18025887. doi: 10.1097/QAD.0b013e3281c618db
23. Rottinghaus EK, Ugbena R, Diallo K, Bassey O, Azeez A, Devos J, Zhang G, Aberle-Grasse J, Nkengasong J, Yang C. Dried blood spot specimens are a suitable alternative sample type for HIV-1 viral load measurement and drug resistance genotyping in patients receiving first-line antiretroviral therapy. Clin Infect Dis. 2012;54(8):1187-95. PubMed PMID: 22412066. doi: 10.1093/cid/cis015
24. Smit PW, Sollis KA, Fiscus S, Ford N, Vitoria M, Essajee S, Barnett D, Cheng B, Crowe SM, Denny T, Landay A, Stevens W, Habiyambere V, Perriens JH, Peeling RW. Systematic review of the use of dried blood spots for monitoring HIV viral load and for early infant diagnosis. PLoS One. 2014;9(3):e86461. PubMed PMID: 24603442. Pubmed Central PMCID: 3945725. doi: 10.1371/journal.pone.0086461
25. Uttayamakul S, Likanonsakul S, Sunthornkachit R, Kuntiranont K, Louisirirotchanakul S, Chaovavanich A, Thiamchai V, Tanprasertsuk S, Sutthent R. Usage of dried blood spots for molecular diagnosis and monitoring HIV-1 infection. J Virol Methods. 2005;128(1-2):128-34. PubMed PMID: 15913797. doi: 10.1016/j.jviromet.2005.04.010
26. McNulty A, Jennings C, Bennett D, Fitzgibbon J, Bremer JW, Ussery M, Kalish ML, Heneine W, Garcia-Lerma JG. Evaluation of dried blood spots for human immunodeficiency virus type 1 drug resistance testing. J Clin Microbiol. 2007;45(2):517-21. PubMed PMID: 17166967. Pubmed Central PMCID: 1829056. doi: 10.1128/JCM.02016-06
27. Youngpairoj AS, Masciotra S, Garrido C, Zahonero N, de Mendoza C, Garcia-Lerma JG. HIV-1 drug resistance genotyping from dried blood spots stored for 1 year at 4 degrees C. J Antimicrob Chemother. 2008;61(6):1217-20. PubMed PMID: 18344550. Pubmed Central PMCID: 2386080. doi: 10.1093/jac/dkn100
28. World Health Organization. WHO global strategy for the surveillance and monitoring of HIV drug resistance. 2012. http://www.who.int/hiv/pub/drugresistance/drug_resistance_strategy/en/
29. Seu L, Mwape I, Guffey MB. Single genome amplification of proviral HIV-1 DNA from dried blood spot specimens collected during early infant screening programs in Lusaka, Zambia. J Virol Methods. 2014;203:97-101. PubMed PMID: 24667303. Pubmed Central PMCID: 4024391. doi: 10.1016/j.jviromet.2014.03.001
30. Henn MR, Boutwell CL, Charlebois P, Lennon NJ, Power KA, Macalalad AR, Berlin AM, Malboeuf CM, Ryan EM, Gnerre S, Zody MC, Erlich RL, Green LM, Berical A, Wang Y, Casali M, Streeck H, Bloom AK, Dudek T, Tully D, Newman R, Axten KL, Gladden AD, Battis L, Kemper M, Zeng Q, Shea TP, Gujja S, Zedlack C, Gasser O, Brander C, Hess C, Gunthard HF, Brumme ZL, Brumme CJ, Bazner S, Rychert J, Tinsley JP, Mayer KH, Rosenberg E, Pereyra F, Levin JZ, Young SK, Jessen H, Altfeld M, Birren BW, Walker BD, Allen TM. Whole genome deep sequencing of HIV-1 reveals the impact of early minor variants upon immune recognition during acute infection. PLoS Pathog. 2012;8(3):e1002529. PubMed PMID: 22412369. Pubmed Central PMCID: 3297584. doi: 10.1371/journal.ppat.1002529
31. Yang X, Charlebois P, Gnerre S, Coole MG, Lennon NJ, Levin JZ, Qu J, Ryan EM, Zody MC, Henn MR. De novo assembly of highly diverse viral populations. BMC Genomics. 2012;13:475. PubMed PMID: 22974120. Pubmed Central PMCID: 3469330. doi: 10.1186/1471-2164-13-475
32. Macalalad AR, Zody MC, Charlebois P, Lennon NJ, Newman RM, Malboeuf CM, Ryan EM, Boutwell CL, Power KA, Brackney DE, Pesko KN, Levin JZ, Ebel GD, Allen TM, Birren BW, Henn MR. Highly sensitive and specific detection of rare variants in mixed viral populations from massively parallel sequence data. PLoS Comput Biol. 2012;8(3):e1002417. PubMed PMID: 22438797. Pubmed Central PMCID: 3305335. doi: 10.1371/journal.pcbi.1002417
33. Larkin MA, Blackshields G, Brown NP, Chenna R, McGettigan PA, McWilliam H, Valentin F, Wallace IM, Wilm A, Lopez R, Thompson JD, Gibson TJ, Higgins DG. Clustal W and Clustal X version 2.0. Bioinformatics. 2007;23(21):2947-8. PubMed PMID: 17846036. doi: 10.1093/bioinformatics/btm404
34. Guindon S, Dufayard JF, Lefort V, Anisimova M, Hordijk W, Gascuel O. New algorithms and methods to estimate maximum-likelihood phylogenies: assessing the performance of PhyML 3.0. Syst Biol. 2010;59(3):307-21. PubMed PMID: 20525638. doi: 10.1093/sysbio/syq010
35. Rose PP, Korber BT. Detecting hypermutations in viral sequences with an emphasis on G --> A hypermutation. Bioinformatics. 2000;16(4):400-1. PubMed PMID: 10869039.
36. Lee HY, Giorgi EE, Keele BF, Gaschen B, Athreya GS, Salazar-Gonzalez JF, Pham KT, Goepfert PA, Kilby JM, Saag MS, Delwart EL, Busch MP, Hahn BH, Shaw GM, Korber BT, Bhattacharya T, Perelson AS. Modeling sequence evolution in acute HIV-1 infection. J Theor Biol. 2009;261(2):341-60. PubMed PMID: 19660475. Pubmed Central PMCID: 2760689. doi: 10.1016/j.jtbi.2009.07.038
37. Pond SL, Frost SD, Muse SV. HyPhy: hypothesis testing using phylogenies. Bioinformatics. 2005;21(5):676-9. PubMed PMID: 15509596. doi: 10.1093/bioinformatics/bti079
38. Slatkin M. Detecting small amounts of gene flow from phylogenies of alleles. Genetics. 1989;121(3):609-12. PubMed PMID: 2714639. Pubmed Central PMCID: 1203644.
39. Giorgi EE, Bhattacharya T. A note on two-sample tests for comparing intra-individual genetic sequence diversity between populations. Biometrics. 2012;68(4):1323-6; author reply 6. PubMed PMID: 23004569. Pubmed Central PMCID: PMC3652673. doi: 10.1111/j.1541-0420.2012.01775.x
40. Monleau M, Montavon C, Laurent C, Segondy M, Montes B, Delaporte E, Boillot F, Peeters M. Evaluation of different RNA extraction methods and storage conditions of dried plasma or blood spots for human immunodeficiency virus type 1 RNA quantification and PCR amplification for drug resistance testing. J Clin Microbiol. 2009;47(4):1107-18. PubMed PMID: 19193835. Pubmed Central PMCID: 2668360. doi: 10.1128/JCM.02255-08
41. Salazar-Gonzalez JF, Salazar MG, Learn GH, Fouda GG, Kang HH, Mahlokozera T, Wilks AB, Lovingood RV, Stacey A, Kalilani L, Meshnick SR, Borrow P, Montefiori DC, Denny TN, Letvin NL, Shaw GM, Hahn BH, Permar SR, Center for HIVAVIA. Origin and evolution of HIV-1 in breast milk determined by single-genome amplification and sequencing. J Virol. 2011;85(6):2751-63. PubMed PMID: 21191008. Pubmed Central PMCID: 3067940. doi: 10.1128/JVI.02316-10
42. Parrish NF, Wilen CB, Banks LB, Iyer SS, Pfaff JM, Salazar-Gonzalez JF, Salazar MG, Decker JM, Parrish EH, Berg A, Hopper J, Hora B, Kumar A, Mahlokozera T, Yuan S, Coleman C, Vermeulen M, Ding H, Ochsenbauer C, Tilton JC, Permar SR, Kappes JC, Betts MR, Busch MP, Gao F, Montefiori D, Haynes BF, Shaw GM, Hahn BH, Doms RW. Transmitted/founder and chronic subtype C HIV-1 use CD4 and CCR5 receptors with equal efficiency and are not inhibited by blocking the integrin alpha4beta7. PLoS Pathog. 2012;8(5):e1002686. PubMed PMID: 22693444. Pubmed Central PMCID: 3364951. doi: 10.1371/journal.ppat.1002686
43. Giorgi EE, Funkhouser B, Athreya G, Perelson AS, Korber BT, Bhattacharya T. Estimating time since infection in early homogeneous HIV-1 samples using a poisson model. BMC Bioinformatics. 2010;11:532. PubMed PMID: 20973976. Pubmed Central PMCID: 2975664. doi: 10.1186/1471-2105-11-532
44. World Health Organization. Manual for drug resistance testing using dried blood spot specimens, March 2010. Geneva, Switzerland: World Health Organization; 2010. http://www.who.int/hiv/topics/drugresistance/dbs_protocol.pdf
45. Garcia-Lerma JG, McNulty A, Jennings C, Huang D, Heneine W, Bremer JW. Rapid decline in the efficiency of HIV drug resistance genotyping from dried blood spots (DBS) and dried plasma spots (DPS) stored at 37 degrees C and high humidity. J Antimicrob Chemother. 2009;64(1):33-6. PubMed PMID: 19403653. Pubmed Central PMCID: 2692501. doi: 10.1093/jac/dkp150
46. Hearps AC, Ryan CE, Morris LM, Plate MM, Greengrass V, Crowe SM. Stability of dried blood spots for HIV-1 drug resistance analysis. Curr HIV Res. 2010;8(2):134-40. PubMed PMID: 20163343.
47. Monleau M, Butel C, Delaporte E, Boillot F, Peeters M. Effect of storage conditions of dried plasma and blood spots on HIV-1 RNA quantification and PCR amplification for drug resistance genotyping. J Antimicrob Chemother. 2010;65(8):1562-6. PubMed PMID: 20542904. doi: 10.1093/jac/dkq205
48. Perelson AS, Neumann AU, Markowitz M, Leonard JM, Ho DD. HIV-1 dynamics in vivo: virion clearance rate, infected cell life-span, and viral generation time. Science. 1996;271(5255):1582-6. PubMed PMID: 8599114.
Supplementary Files

Download as a PowerPoint Slide
Supplementary Figure 1. Maximum-likelihood phylogenetic tree of all study participants. The 9 study subjects’ SGA-derived gp160 env sequences cluster independently, demonstrating a lack of cross-contamination. Sequences are color-coded by subject. Genetic distance is indicated by the scale bar.
